• Note d'application

Advancing Host Cell Protein Analyses Through the Combined Use of Microscale 2D RP/RP with CSH C18 and Ion Mobility Enabled MS Detection

Advancing Host Cell Protein Analyses Through the Combined Use of Microscale 2D RP/RP with CSH C18 and Ion Mobility Enabled MS Detection

  • Matthew A. Lauber
  • Catalin E. Doneanu
  • Stephan M. Koza
  • Weibin Chen
  • Kenneth J. Fountain
  • Waters Corporation

Abstract

Here, recent advances in microscale peptide chromatography are applied to HCP analysis. The novel charge-surface-modified C18 material, known as CSH C18, which can produce high peptide peak capacities even at high mass loads, is used in the format of a 15K psi capable 300 μm I.D. column along with an ACQUITY UPLC M-Class based 2D-RP/RP system and SYNAPT HDMSE detection to provide a robust analytical workflow for the identification of low concentrations of HCP impurities at single digit PPM levels (parts per million, or ng/mg).

Benefits

  • Detection of low, single digit PPM components in a complex protein sample
  • CSH C18 for improved resolving power at inordinately high mass loads to shift dynamic range to lower limits of detection
  • Ion mobility-enabled MS Detection (HDMSE) for improved mass spectral quality to produce higher confidence HCP identifications
  • Rugged, user-friendly 15K psi microscale LC to improve the ease-of-use of high sensitivity/sample-limited LC-MS

Introduction

Microscale LC-MS techniques are widely used by analytical laboratories for high sensitivity applications. Since improvements in peak capacity enhance the ability to resolve and detect trace-level components, high peak capacity separations are extremely advantageous in these examples of narrow I.D. (100–1000 μm) column chromatography, particularly during complex sample analyses, such as the identification of host cell protein (HCP) impurities in biotherapeutic products.1-3 Here, recent advances in microscale peptide chromatography are applied to HCP analysis. The novel charge-surface-modified C18 material, known as CSH C18, which can produce high peptide peak capacities even at high mass loads, is used in the format of a 15K psi capable 300 μm I.D. column along with an ACQUITY UPLC M-Class based 2D-RP/RP system and SYNAPT HDMSE detection to provide a robust analytical workflow for the identification of low concentrations of HCP impurities at single digit PPM levels (parts per million, or ng/mg).

Experimental

An IgG1K mAb (2.5 mg) was denatured, reduced, alkylated, and digested with trypsin in the presence of ~0.1% (w/v) RapiGest and 50 mM ammonium bicarbonate using reagents and conditions similar to those previously published.1 The resulting 2.5 μg/μL tryptic digest was prepared such that it was titrated to a basic pH (~pH 10) and spiked with tryptic peptides from rabbit glycogen phosphorylase at a concentration of 4 fmol/μL.

Method conditions (unless otherwise noted)

LC conditions

LC system:

ACQUITY UPLC M-Class 2D System with a CH-A 20 cm Column Heater (p/n 186015042)

Sample temp.:

5 °C

1st dimension mobile phase A (also weak needle wash):

20 mM ammonium formate, pH 10

1st dimension mobile phase B (also strong needle wash):

Acetonitrile

ASM dilution mobile phase:

0.1% TFA (v/v), water (ASM Pump A)

2nd dimension mobile phase A:

0.1% formic acid (v/v), water

2nd dimension mobile phase B:

0.1% formic acid (v/v), acetonitrile

1st dimension column temp.:

Ambient

Trapping column temp.:

Ambient (when configured for conventional silica C18 analytical columns), 60 °C (for CSH C18 analytical columns)

Analytical column temp.:

45 °C (conventional silica C18), 40 °C (CSH C18)

Injection volume:

80 μL (0.2 mg mass load) or 4 x 100 μL (1 mg mass load)

Sample loop volume:

250 μL (custom replacement of the standard 100 μL sample loop)

Run time per replicate analysis:

10 x [20 min 1st dimension step gradient and trapping method + 45 min 2nd dimension run]

1st dimension column:

XBridge Peptide BEH C18, 300Å, 5 μm, 1.0 x 50 mm (p/n 186003615) [Note: XBridge Peptide BEH C18, 130Å, 5 μm, 1.0 x 50 mm (p/n 186003571) can also be used. However, 1st dimension chromatographic selectivity may change.]

Analytical column:

Conventional silica C18, 100Å, 1.7 μm, 300 μm x 150 mm, or ACQUITY UPLC M-Class CSH C18, 130Å, 1.7 μm, 300 μm x 150 mm (p/n 186007563)

Trapping column:

ACQUITY UPLC M-Class Symmetry C18, 2D HCP Trap, 100Å, 5 μm, 300 μm x 25 mm (p/n 186007499)

Vials:

LCGC Certified Clear Glass 12 x 32 mm Screw Neck Qsert Vial (p/n 186001126C)

10 Step 2D-RP/RP inlet methods

2nd dimension pump

*All curve styles are linear.

Trapping (trapping valve position 2):

Time

Flow (μL/min)

%B

0

8.0

5% (2% or CSH C18)

Analytical (trapping valve position 1): For a conventional C18 2nd dimension column

Time

Flow (μL/min)

%B

0

8.0

5% (2% or CSH C18)

30

8.0

40% (37% for CSH C18)

32

8.0

85

34

8.0

85

36

8.0

5% (2% for CSH C18)

45

8.0

5% (2% for CSH C18)

For a CSH C18 2nd dimension column

Time

Flow (μL/min)

%B

0

8

2

30

8

37

32

8

85

34

8

85

36

8

2

45

8

2

Trapping (trapping valve position 2):

Time

Flow (μL/min)

%B

0.0

10

3

0.2

10

3

0.5

10

X

15.5

10

X

16.0

10

3

20.0

10

3

Analytical (trapping valve position 1):

Time

Flow (μL/min)

%B

0

10

3

X = 10.7 (1st Fraction), 12.4% (2nd Fraction),

14.0% (3rd Fraction), 15.4% (4th Fraction),

16.7% (5th Fraction), 18.6% (6th Fraction),

20.4% (7th Fraction), 25.0% (8th Fraction),

30.0% (9th Fraction), 50.0% (10th Fraction)

ASM pump: The A side was held at 100 μL/min during both 2nd dimension analytical gradients and 1st dimension trapping gradients. The B-side was held at 5 μL/min (LockSpray).

MS conditions

MS system:

SYNAPT G2-S (with a Microscale ESI Probe (p/n 186007529)

Ionization mode:

ESI+

Analyzer mode:

Resolution (~20 K)

Capillary voltage:

3.0 kV

Cone voltage:

30 V

Source offset:

50 V

Source temp.:

100 °C

Desolvation temp.:

250 °C

Desolvation gas flow:

800 L/hr

Calibration:

NaI, 2 μg/μL from 100–2000 m/z

Lockspray (ASM B-side):

500 fmol/μL Human Glufibrinopeptide B in 0.1% (v/v) formic acid, 70:30 water/acetonitrile every 4 min

Acquisition:

50–1990 m/z, 0.3 sec scan rate

Precursor/Low Energy Scan

Trap collision energy:

5 V

Transfer collision energy:

4 V

High energy fragmentation scan

Trap collision energy:

20–45 V ramp

Transfer collision energy:

10 V

HDMSE conditions

IMS wave velocity: 600 m/s

Precursor/low energy scan

Trap collision energy:

4 V

Transfer collision energy:

2 V

High energy fragmentation scan

Trap collision energy:

4 V

Transfer collision energy:

20–45 V

Data management:

MassLynx Software (v4.1)

ProteinLynx Global SERVER/PLGS (v3.0.1)

PLGS database information

Target database: mAb light and heavy chain sequences + UniProt Mus musculus reference proteome [1185] + calibrant protein (rabbit glycogen phosphorylase) sequence [UniProt P00489] Decoy Database (searched along with target database): 1x randomized target database

PLGS processing parameters

Low energy threshold:

150 counts

Elevated energy threshold:

30 counts

Intensity threshold:

1500 counts

PLGS workflow parameters

Default settings except for the following

Peptide tolerance:

15 ppm

Fragment tolerance:

20 ppm

False discovery rate:

15% (Note that the protein match criteria listed below compensated for this low fidelity matching.)

Protein match acceptance criteria

Protein PLGS score >270

Supported by ≥3 unique peptide hits

Protein identified in at least 2 out of 3 replicate analyses

Results and Discussion

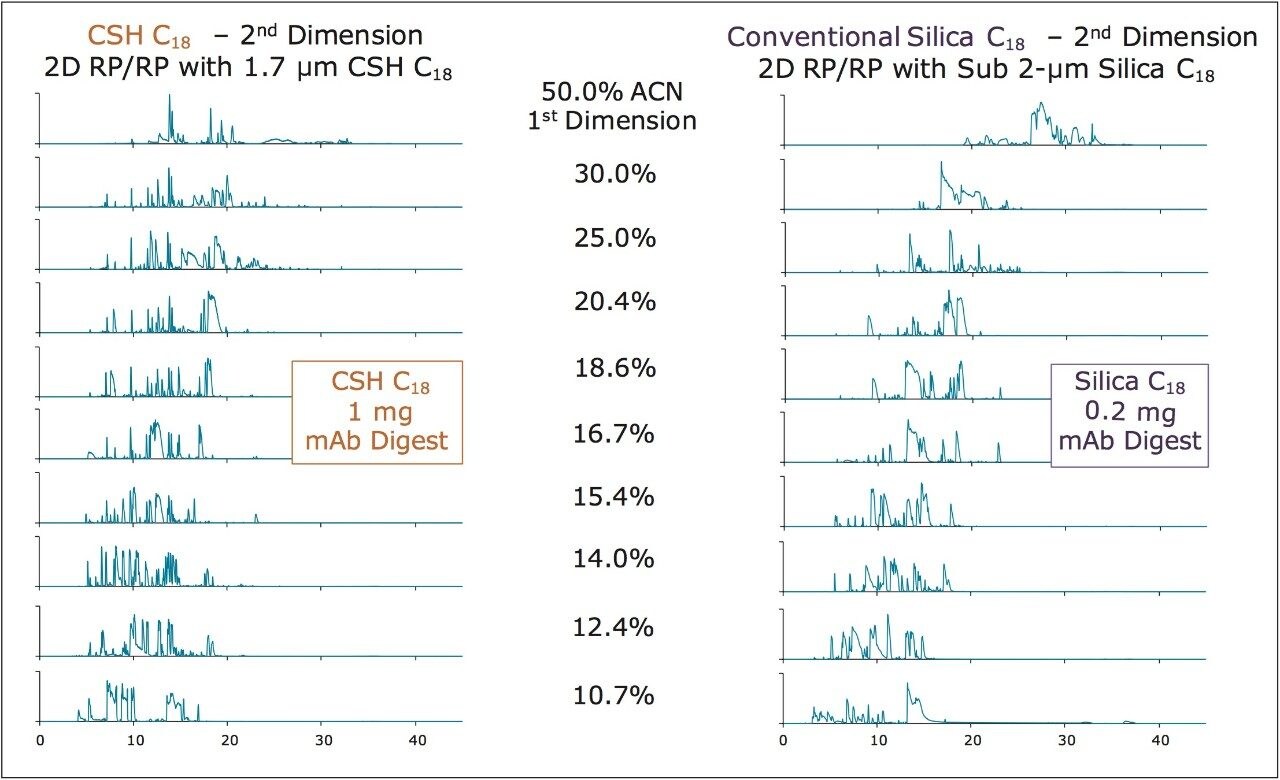
CSH C18, with its positive surface potential at an acidic pH, minimizes undesired secondary interactions, exhibits enhanced loadability, and thereby minimizes peak broadening at high mass loads.4 Such chromatographic performance is well suited to the analysis of HCPs, where there is a need to identify low-ppm impurities in the presence of highly abundant product-derived peptides that readily cause ion suppression and spectral crowding if co-elution occurs. It has previously been demonstrated that two-dimensional (high pH/low pH) RP/RP separations can be used to obtain high peak capacity peptide separations and to identify HCP impurities.1,5 Indeed, such chromatography operated at near 10K psi with an ACQUITY UPLC M-Class System and 300 μm I.D. sub-2-μm, silica-based C18 analytical column produces a theoretical peak capacity (half-height) of 2535 when a test mixture is analyzed at low mass loads.6 In practice, however, this peak capacity is substantially compromised when analyzing the mass loads required to characterize HCPs. Interestingly, the use of CSH C18 in the 2nd dimension of such a 2D-RP/RP system has been found to minimize the peak broadening observed during HCP analyses. CSH C18 thus enables even higher mass loads to be analyzed without significant losses in peak capacity, which assists in detection of impurities at increasingly lower abundances.

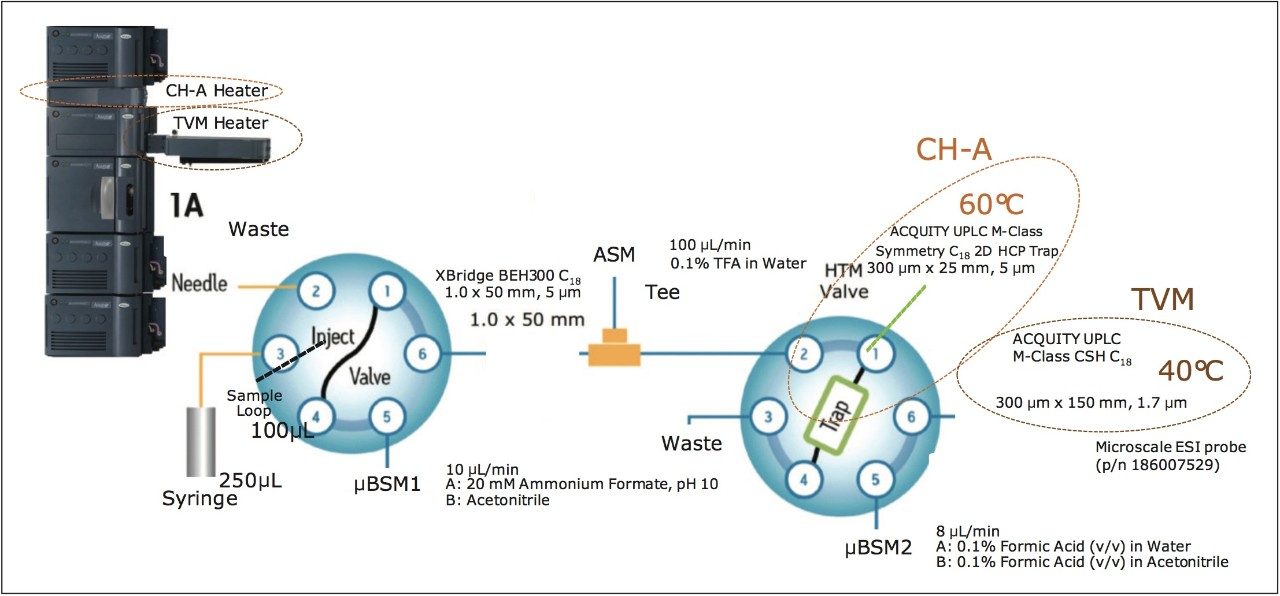
For this reason, the combination of UPLC 2D-RP/RP with a 300 μm I.D. CSH C18 column is presented for improved HCP analysis. Figure 1 shows a schematic of this apparatus, in which an ACQUITY UPLC M-Class System is outfitted with an ACQUITY UPLC CH-A Column Heater to allow for differential heating of trapping and analytical columns. Dual zone heating can be essential to optimizing trap-elute separations, such as the second dimension segment of this 2D-RP/RP system. Here, a Symmetry C18 trapping column is maintained at 60 °C to facilitate optimal refocusing on the CSH C18 2nd dimension analytical column (see Reference 7 for more information on differential column heating).7

Figure 1. Fluidics configuration for microscale 2D-RP/RP with an ACQUITY UPLC M-Class System and an ACQUITY UPLC M-Class CSH C18 Column.

The capabilities of this system are unprecedented in terms of both peak capacity and loadability. Figure 2 shows base peak intensity (BPI) chromatograms resulting from a 10-step 2D-RP/RP separation of an inordinately high, 1 mg mass load of a trypsin digested monoclonal antibody (mAb). In comparison to an analogous 2D separation using conventional (not charge surface modified) silica C18 for the 2nd dimension, CSH C18 yields 2nd dimension separations with distinctively sharper peaks for high abundance species, thereby allowing for improved detection of low abundance species. Moreover, these pronounced performance gains are obtainable even at mass loads higher than those typically explored with conventional silica C18. The comparison of Figure 2, in fact, shows results from using conventional silica C18 to study 0.2 mg of a mAb digest versus using CSH C18 to study that same sample at a 1 mg mass load. Figure 3 underscores the described separation capabilities of CSH C18, as it displays a single fraction from these two different 2D analyses, where again it is apparent that CSH C18 better minimizes the peak broadening inherent in high mass load/overloaded peptide chromatography.

Figure 2. Microscale 2D-RP/RP with an ACQUITY UPLC M-Class System and ACQUITY UPLC M-Class Columns. Second dimension base peak intensity chromatograms from MS analysis of 0.2 mg mAb digest with a silica C18 2nd dimension column versus 1.0 mg mAb digest with a CSH C18 2nd dimension column.
Figure 3. Comparison of base peak intensity chromatograms for 1st dimension fraction 3 obtained from MS analysis of 0.2 mg mAb digest with a silica C18 2nd dimension column versus 1.0 mg mAb digest with a CSH C18 2nd dimension column.

The improved resolution in the 2nd dimension afforded by CSH C18 is useful to HCP analysis, but perhaps more so is the fact that it is possible with CSH C18 to load at least 5 times more sample. This has the effect to shift the dynamic range of the analysis to encompass lower limits of detection. In addition, the analysis of increased mass loads pairs well with ion mobility enabled MS detection, since ion mobility operation (e.g. HDMSE) generally yields slightly lower ion counts versus MS detection without an ion mobility separation (e.g. MSE). Despite the decrease in ion intensity, ion mobility enabled MS detection is of significant value to HCP analysis itself, as it reduces spectral crowding of precursor and fragment ion spectra. In this way, ion mobility assisted data independent analyses, like HDMSE, are effective in extracting more information from an analysis, since spectral matching can be performed with greater confidence and precursor mass information can be better correlated to fragment ion spectra. (For a review of data independent analyses [MSE] and ion mobility enabled data independent analyses [HDMSE], please refer to Reference 8).8

Demonstration of recent advances in HCP LC-MS analysis

The value of these above mentioned technological advances was tested. Specifically, the results from 2D-RP/RP with conventional silica C18 combined with MSE to analyze 0.2 mg of an mAb digest were compared with those from 2D-RP/RP with CSH C18 combined with HDMSE to analyze 1.0 mg of an mAb digest. Mass spectral data obtained in either case were searched against the sequence of the mAb, trypsin, and the host cell proteome with ProteinLynx Global SERVER (PLGS), a database driven search algorithm for spectral matching and protein identification. The mAb sample analyzed in this study was an IgG1K expressed from a murine cell line; consequently, the Mus musculus reference proteome was downloaded from UniProt and used to identify peptides and thus protein impurities from the host cell line. Guidelines similar to those established previously were followed to ensure high confidence identifications were obtained from PLGS processing.2-3 Most notably, it was required that a host cell protein be identified in at least two out of the three replicate analyses that were performed. The resulting number of host cell proteins identified by the two methods being compared is shown in Figure 4A. The 2D-RP/RP with conventional silica C18 combined with MSE to analyze 0.2 mg of an mAb digest produced 5 HCP identifications while the 2D-RP/RP with CSH C18 combined with HDMSE to analyze 1.0 mg of an mAb digest yielded 14 HCP identifications. The noted advances in LC-MS technology therefore facilitated obtaining almost 3 times more information about the HCP profile of this mAb sample.

Figure 4. HCP Analysis Results. (A) A comparison of the number of HCPs identified from two different analytical strategies. (B) The number of HCPs identified at different estimated ppm concentrations using recent advances in microscale LC-MS technologies.

More interesting is the type of information provided by these recent advances. HCP analysis by these techniques can be qualitative in the sense that a list of protein impurities can be obtained. However, it can likewise be made quantitative through what is referred to as “Hi3” quantitation.9-10 In this analysis, the digest of a protein, for instance trypsin digest, rabbit glycogen phosphorylase, is spiked into the digested sample at a concentration that is predicted to be similar to the target analytes. For this analysis, that would be a 20–200 ppm concentration. Intensities observed for the top 3 most intense precursors (the so-called “Hi3”) can then be used to develop a single point calibration for determining on-column loads. Using the intensities of the target analyte’s top 3 most intense precursors, the analyst can thereby obtain an estimated concentration for an identified HCP. Previous microscale LC-based HCP analyses, typified by the results obtained with a conventional silica C18 2nd dimension and MSE detection, exhibit limits of detection of approximately 20 ppm.1 The combined use of CSH C18 for the 2nd dimension, 5x higher mass loads, and HDMSE has made a significant improvement to this capability where 7 of the 14 HCPs identified by Hi3 quantitation are estimated to be present in the sample at concentrations below 20 ppm (Figure 4B). The two lowest abundance HCPs identified are actually estimated to be present at 2 and 6 ppm concentrations, respectively. In summary, marked improvements in both the qualitative and quantitative results of an HCP analysis by LC-MS are achieved with these recent examples of method development.

Conclusion

Recent advances in microscale peptide chromatography have been applied to HCP analysis. The novel charge-surface-modified C18 material, known as CSH C18, has been used in the format of a 15K psi capable 300 μm I.D. column along with an ACQUITY UPLC M-Class based 2D-RP/RP system and SYNAPT HDMSE detection to provide a robust analysis workflow for the identification of low-ppm HCP impurities. The use of CSH C18 in the 2nd dimension of such a 2D-RP/RP system has been found to minimize the peak broadening of the abundant peptides observed during HCP analyses, enabling inordinately high mass loads to be analyzed and the dynamic range of an analysis to be shifted to encompass lower limits of detection. These high mass load analyses pair well with ion mobility enabled MS detection (e.g. HDMSE), which itself reduces spectral crowding of precursor and fragment ion spectra and enables improved correlation between precursor and fragment ion spectra. In combination, these recent advances facilitate HCP analysis, making it possible to profile protein impurities down to low ppm concentrations. That these recent advances have been developed around rugged, user-friendly 15K psi microscale LC make this a very promising strategy for investigating HCPs in biotherapeutics as well as low abundance protein species in proteomic-type samples.

References

  1. Doneanu, C. E.; Xenopoulos, A.; Fadgen, K.; Murphy, J.; Skilton, S. J.; Prentice, H.; Stapels, M.; Chen, W., Analysis of host-cell proteins in biotherapeutic proteins by comprehensive online two-dimensional liquid chromatography/ mass spectrometry. MAbs 2012, 4 (1), 24-44.
  2. Schenauer, M. R.; Flynn, G. C.; Goetze, A. M., Identification and quantification of host cell protein impurities in biotherapeutics using mass spectrometry. Anal Biochem 2012, 428 (2), 150-7.
  3. Schenauer, M. R.; Flynn, G. C.; Goetze, A. M., Profiling the effects of process changes on residual host cell proteins in biotherapeutics by mass spectrometry. Biotechnol Prog 2013, 29 (4), 951-957.
  4. Lauber, M. A.; Koza, S. M.; McCall, S. A.; Alden, B. A.; Iraneta, P. C.; Fountain, K. J., High-Resolution Peptide Mapping Separations with MS-Friendly Mobile Phases and Charge-Surface-Modified C18. Anal Chem 2013, 85 (14), 6936-44.
  5. Gilar, M.; Olivova, P.; Daly, A. E.; Gebler, J. C., Two-dimensional separation of peptides using RP-RP-HPLC system with different pH in first and second separation dimensions. J Sep Sci 2005, 28 (14), 1694-703.
  6. Lauber, M. A.; Koza, S. M.; Fountain, K. J., An Introduction to the Capabilities of Microscale 2D-RP/RP Peptide Chromatography with an ACQUITY UPLC M-Class System. Waters Application Note 720004934EN, 2014.
  7. Lauber, M. A.; Koza, S. M.; Fountain, K. J., Optimizing Peak Capacity in Nanoscale Trap-Elute Peptide Separations with Differential Column Heating. Waters Application Note 720005047EN, 2014.
  8. Thompson, W.; Stapels, M., Resolving the Complexity of Proteomic Samples with Ion Mobility-Mass Spectrometry. Bioanalysis Zone Webcast (Waters Library Number WEBC134723094) 2012.
  9. Silva, J. C.; Denny, R.; Dorschel, C.; Gorenstein, M. V.; Li, G. Z.; Richardson, K.; Wall, D.; Geromanos, S. J., Simultaneous qualitative and quantitative analysis of the Escherichia coli proteome: a sweet tale. Mol Cell Proteomics 2006, 5 (4), 589-607.
  10. Silva, J. C.; Gorenstein, M. V.; Li, G. Z.; Vissers, J. P.; Geromanos, S. J., Absolute quantification of proteins by LC-MSE: a virtue of parallel MS acquisition. Mol Cell Proteomics 2006, 5 (1), 144-56.

720005076, June 2014

Haut de la page Haut de la page