This application note demonstrates that the Waters ACQUITY UPLC H-Class combined with a PDA (Photodiode Array detector) and ACQUITY QDa Mass Detector, can be utilised for cleaning validation to provide confident confirmation, as well as a highly specific and high sensitivity quantitative analysis for poorly UV absorbing or non-chromaphoric compounds. When controlled by the industry leading CDS software, Empower, this provides a solution well suited for rigorously regulated environments especially areas which require a high degree of data integrity, SOP adherence and compliance management.
Cleaning validation is a required activity in many companies, including pharmaceutical, biological, nutritional supplement, and medical device industries. From both a regulatory and industry standpoint, cleaning validation is recognised as an important activity that ensures that product cross-contamination does not adversely affect patient safety and product quality.1
Cleaning validation is a vital part of Quality Control (QC) workflow in the pharmaceutical industry and is defined as the process of providing documented evidence that the cleaning methods employed within a facility consistently monitors and controls for the potential carryover of product (including intermediates and impurities), cleaning agents, and extraneous material into subsequent product batches to a level which is below established safety levels.2 It is critical that a reactor or vessels do not contain any materials which may introduce contamination into subsequent batches, this can both be a dangerous and costly mistake.
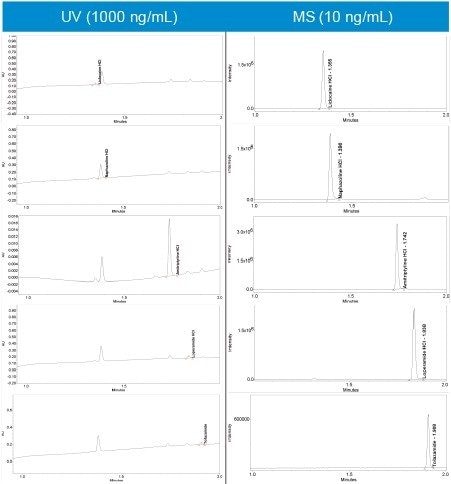
Depending on the process need, cleaning validation is performed using a number of analytical methods including HPLC-UV detection and/or total organic carbon analysis (TOC), each having unique pros and cons. HPLC-UV is restricted to chromophore containing compounds and tends to be a targeted method analysis specific only for compounds within the scope of the method and may miss other sources of contamination, or may be susceptible to baseline drift/interference. HPLC-UV also can lack the necessary sensitivity for low level analysis. TOC conversely is a non-specific technique that will detect any source of organic carbon.
While this is useful for detecting a wide range of contamination sources, TOC may not convey any qualitative data and will often require further testing (for example by LC-MS) for substance identification3 to establish the appropriate cleaning protocol. This need for an additional stage of testing results in further costly downtime for the production plant.
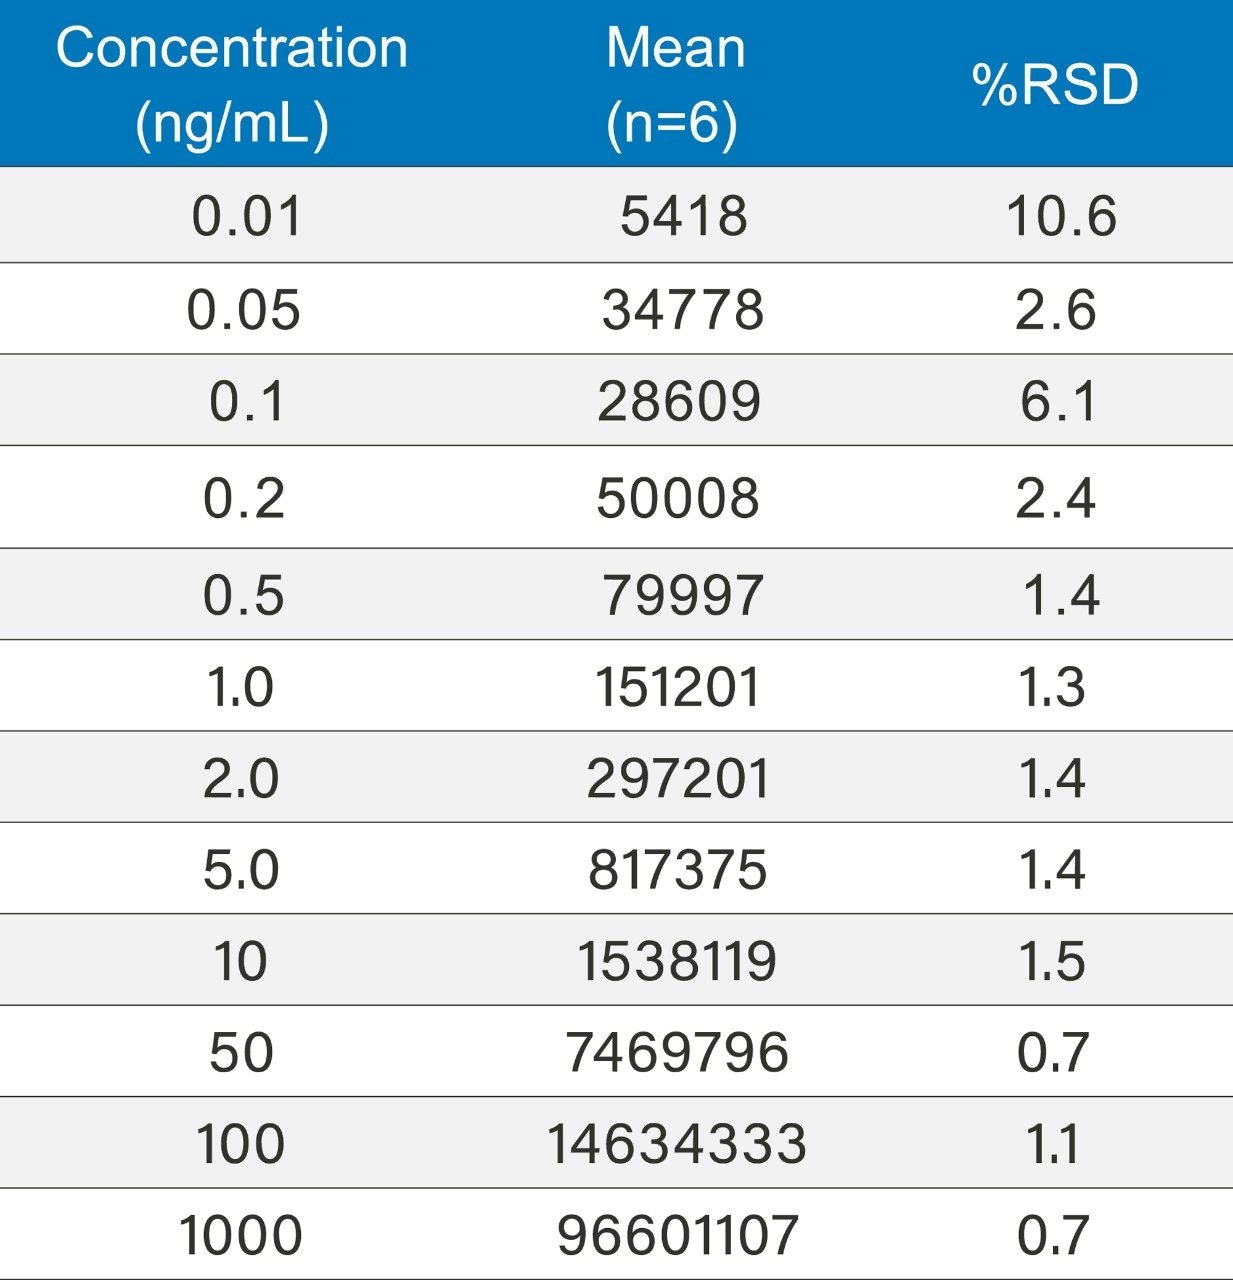
For determination of drug residues for cleaning verification purposes, it is often necessary to have the capability of detecting trace amounts of drug, down to nanogram or even picogram levels.4
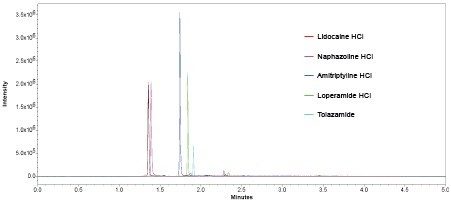
The combination of ACQUITY UPLC H-Class System and ACQUITY QDa Mass Detector (along with PDA) provides any analytical chemist with a powerful, synergistic tool for quantitative and qualitative separation. The Waters ACQUITY UPLC H-Class is complimented with a wide range of sub-2-µm column chemistries affording excellent peak shape, peak capacity and significantly faster runtimes for a wide range of compounds and mixtures.
The ACQUITY QDa Mass Detector can be integrated as a complimentary technique to UV detection. Mass detection brings trace level detection below the range of UV detection of at least 10-fold. This results in significantly lower limits of quantification and detection which are important parameters in all areas of analysis but especially in cleaning validation protocols for high toxicity drugs which have stringent limits for maximum allowable carryover (MACO). Additionally, rapid identification of components using mass allows the corrective action to be applied or the process be revisited and optimized more quickly if needed.
These technologies are all controlled by Empower 3 Chromatography Data Software, a compliance ready package providing secure data from acquisition to reporting/distribution.
In practice, a cleaning validation procedure would involve a swabbing stage e.g. reaction vessels followed by an extraction process. This application note relates to the methodology that occurs after the extraction procedure, i.e. once the extracted product has been transferred to a sample vial.
A rapid 5 minute method was developed for five generic compounds (naphazoline HCl, lidocaine HCl, amitriptyline HCl, loperamide HCl, and tolazamide) using an PDA detector coupled with the ACQUITY QDa Mass Detector with data acquisition and instrument control performed by Empower 3 CDS Software (Table 1).
The compounds were prepared (n=6) over twelve concentrations ranging between 0.01 and 1000.0 ng/mL. Diluent consisted of 50% deionized water and 50% methanol.
The lidocaine HCl data was chosen as an exemplar of the ACQUITY QDa’s crucial role in the analysis of poorly UV absorbing compounds. ACQUITY QDa data acquisition was initially run in full scan mode 200–1000 m/z to establish the protonated species. Once established, the ACQUITY QDa was run in SIR (Single Ion Recording) mode where the DC (Direct Current) and RF (Radio Frequency) of the quadrupole are set to allow ions of a specific m/z value through to the detector which greatly reduces noise and increases sensitivity. The analytical method demonstrated linearity over the range 0.01 to 1000.0 ng/mL achieving an R2 value of 0.997 (Figure 1). Limit of detection was achieved at approximately 0.005 ng/mL for lidocaine HCl using SIR based on ICH Q2, (R1) guidelines, ‘Validation of Analytical Procedures: Text and Methodology’ for signal to noise ratios, equating to 0.025 pg on column (Figure 2/Table 2).
The results of the other four compounds are summarized (Table 3).
The PDA acquiring data at 220 nm achieved limits of detection of <1000.0 ng/mL for lidocaine HCl based on guidelines laid out in ICH Q2, (R1) for signal to noise ratios, equating to <5000 pg on column. Linearity was therefore not calculated. The extended dynamic range of the ACQUITY QDa when compared to the PDA, maintains excellent precision at low concentration levels providing a powerful analytical tool for low level analysis enabling a linearity range for lidocaine HCl of at least five orders of magnitude (Figure 1/Table 4).
Lidocaine HCl was measured reliably down to approximately 0.02 ng/mL using ACQUITY QDa mass detection (Table 3), compared to the UV which provided an LOQ
of 1000 ng/mL. Lidocaine, a compound with poor UV absorbance, yielded a MS method which was 50,000 times more sensitive than UV at 220 nm and also provided a high degree of confidence that the correct peak was measured with the confirmation of mass (Figure 6).
Method precision was carried out for lidocaine HCl from 0.01ng/mL to 1000 ng/mL (n=6). The system exhibited excellent precision over the full range with %RSD’s ranging from 0.7 to 10.6 ng/mL (Table 4).
Signal-to-noise (s/n) values for the 0.01 ng/mL concentration is 5.28. Limit of detection is 3 x s/n according to ICH Q2, (R1) guidelines. The limit of detection based on this criterion can be said to be slightly greater than 0.005 ng/mL based on this data. The limit of quantitation (10 x s/n) can be estimated at around 0.02 ng/mL based on these results.
A blank was run at the end of the analytical sequence to assess potential carryover. Results show no significant levels of analyte in the blank (0.006% wrt 1000 ng/mL sample – approximately limit of detection).
For naphzoline HCl, loperamide HCl, and tolazamide linearity was demonstrated over 0.01 ng/mL and 1000 ng/mL yielding LOQ’s of between 0.02 and 0.03 ng/mL.
For amitriptyline HCl linearity over the range 0.1–1000 ng/mL with LOQ calculated at approximately 0.6 ng/mL using this method.
Analysing all the compounds using UV at the wavelengths specified in Table 1 achieved LOD’s greater than 20 ng/mL with amitriptyline HCl proving the most sensitive. Accurate linearity was not possible due to lack of sensitivity over the concentration range.
All five compounds were run in full scan mode to confirm the protonated species as (M+H).+ (Figure 4).
With the protonated species established for each compound an appropriate SIR acquisition method was set up in Empower.
Slight co-elution with lidocaine HCl and naphazoline HCl evident, however SIR capability of the ACQUITY QDa enables specific, accurate and precise quantitation of both analytes (acquired in separate data channels) over the full range of concentrations (Table 3).
The compounds were analysed using six replicates of each to establish precision (Figure 5).
The ability to combine PDA data with mass detection equips the analyst with a powerful orthogonal solution to peak identification and a broader scope for peak detection. The ACQUITY QDa Mass Detector provides a significant increase in sensitivity beyond that of UV detection to enable confident and consistent quantification of analytes.
The integration of mass detection into UV workflow not only brings enhanced sensitivity but also offers convenient access to a more confident peak identification capability.
Empower 3 provides UV spectral data and MS data in one convenient screen giving easy access to increased peak ID confidence through mass confirmation (Figure 6). The loperamide HCl mass analysis (light blue) exhibits two isotopes (477.06/499.09) separated by two mass units, typical of single chlorine containing compounds.
The ability to bring ACQUITY QDa mass detection to cleaning validation enables the pharmaceutical industry to access unprecedented sensitivity and selectivity to an increasingly scrutinised area of drug production, providing improved throughput, accuracy and data confidence.
In addition to ACQUITY UPLC H-Class, ACQUITY QDa, and Empower CDS, Waters also provides a large number of products and consumables to support cleaning validation through Waters, ERA catalog. Follow link:
720005871, December 2016