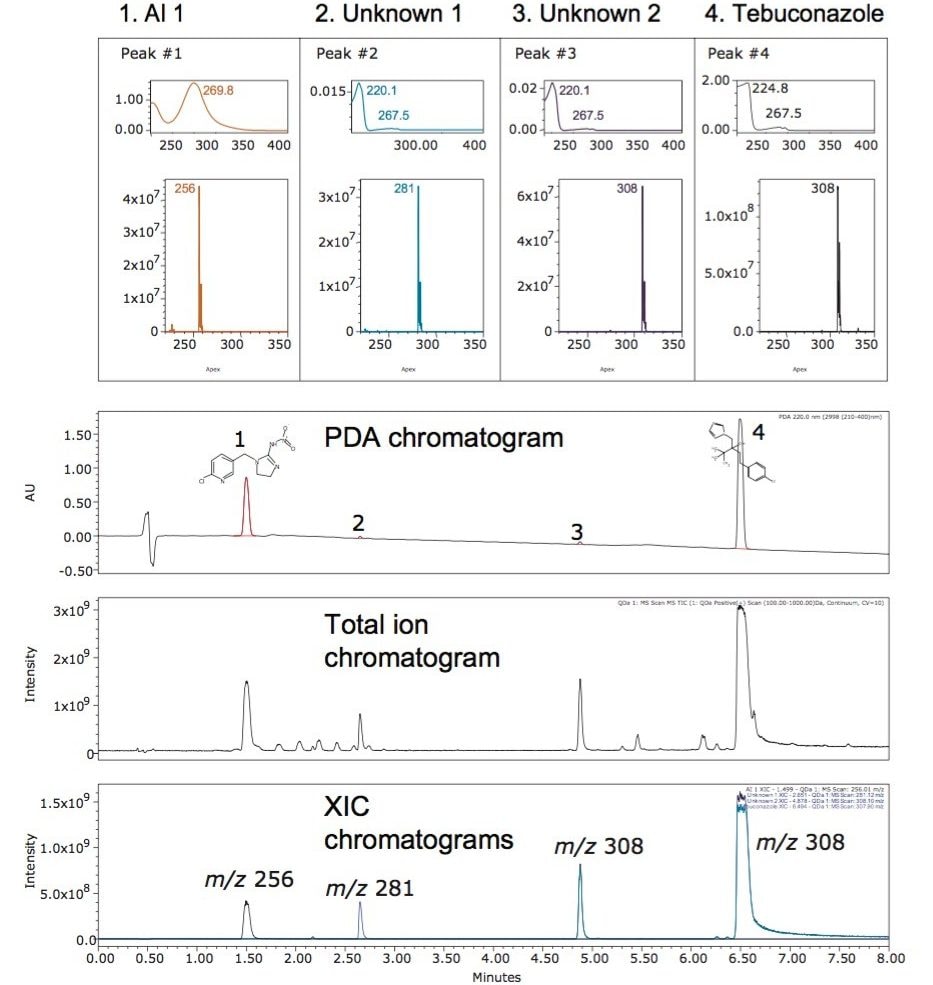
Detection, characterization, and quantitation of the active ingredient/s and all other components in agrochemical formulations including impurities and degradation products are necessary to support product development, quality control, and product registration. Liquid chromatography (LC) techniques with photo diode array (PDA) detection have been used for the routine analysis of formulation samples. The addition of a mass detector in conjunction with UV detection can increase the specificity and selectivity of methods used during analytical testing to provide additional information about a sample in a single analysis.
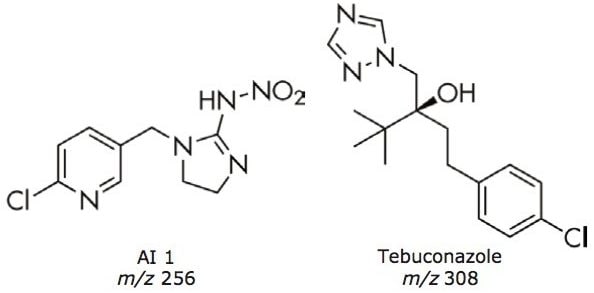
In this application note, we present the analysis of a commercially available pesticide formulation which contained two active ingredients (AI): an insecticide AI 1, and tebuconazole, a triazole fungicide, AI 2. The triazole fungicides are a commonly used group of pesticides due to their potent activity against a broad spectrum of crop diseases.
The analysis of the formulation employed UV and mass detection and a dual-flow path liquid chromatography system capable of emulating HPLC or UHPLC separations. The ACQUITY Arc System enables existing HPLC methods to be performed, while also allowing the choice of transitioning to a UHPLC method that employs sub-3 μm particles for higher efficiency chromatographic separations.
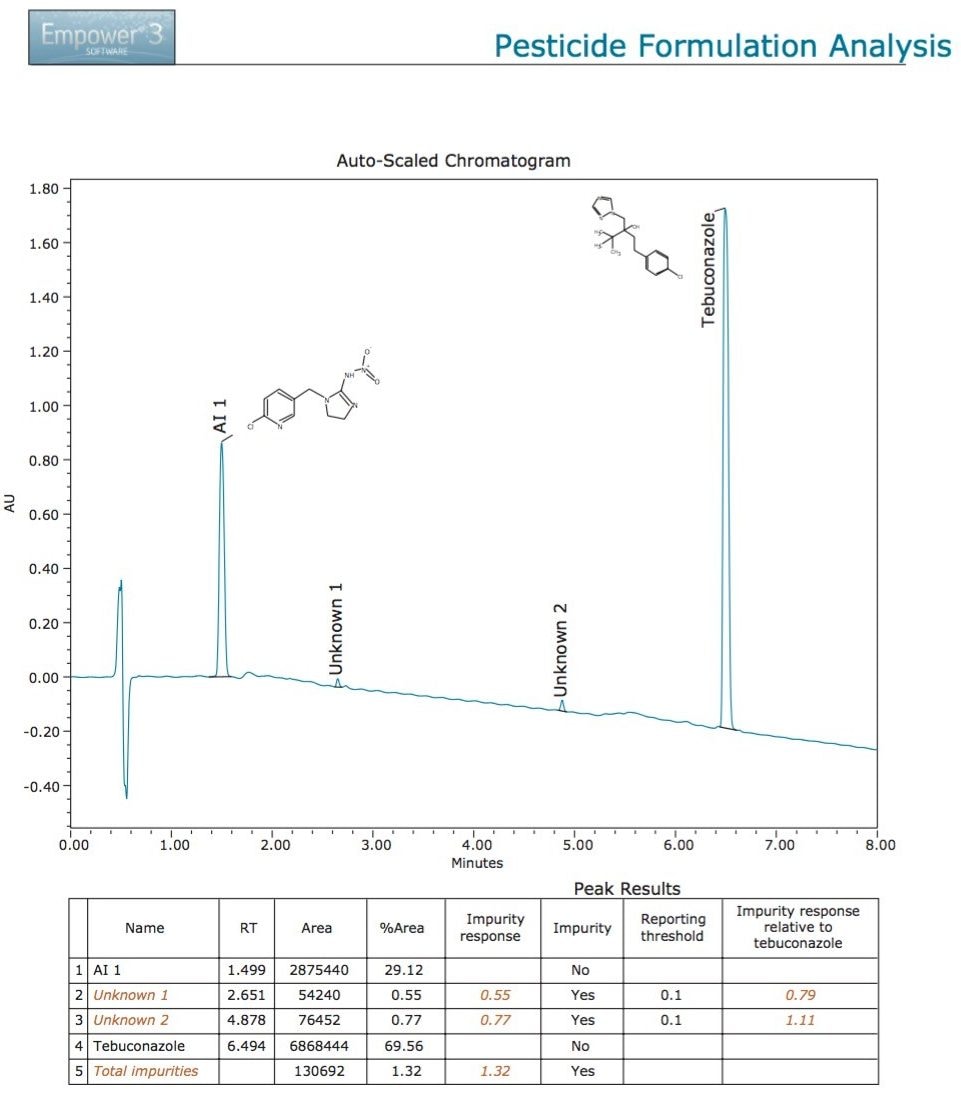
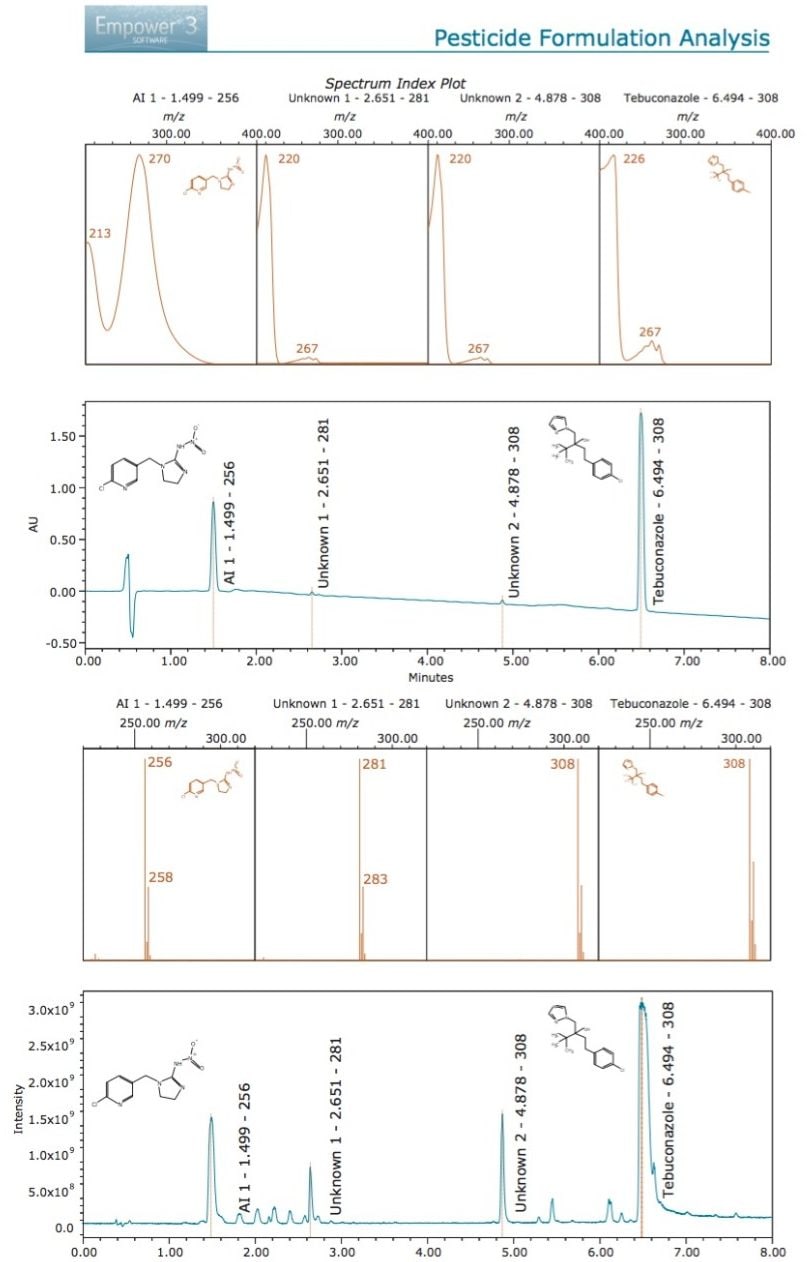
Empower 3 Software was used for data acquisition and analysis, generating results which were used to flag impurities greater than specified %Area levels. The combined detection capabilities and data analysis provided the initial structural characterization of the unknown components.