• Note d'application

Identification of Non-Intentionally Added Substances (NIAS) in Food Contact Materials Using APGC-Xevo G2-XS QTof and UNIFI Software

Identification of Non-Intentionally Added Substances (NIAS) in Food Contact Materials Using APGC-Xevo G2-XS QTof and UNIFI Software

  • Nicola Dreolin
  • Peter Hancock
  • Waters Corporation

Abstract

Identifying unknown compounds in food contact materials is usually a challenging process. The UNIFI Scientific Information System simplifies the process by providing customizable workflows and achieving data containing accurate mass precursor and fragment ions information acquired by the MSE functionality.

EI-MS and APGC-QTof MS systems have been proven to be complementary when the compounds of interest are described in commercially available libraries, whereas APGC-QTof MS is particularly advantageous when the elucidation is required for volatile and semi-volatile components not listed in the libraries, or for those at trace or ultra-trace levels. APGC-Xevo G2-XS QTof with UNIFI can determine possible erroneous identifications and also facilitate component identification for peaks that are not detected using an EI quadrupole MS system.

Finally, UNIFI componentization eases the burden of data interpretation for the analyst, reducing potential false-positive assignments, and allowing results to be presented clearly and concisely.

Benefits

  • Reliable GC-MS method for screening and structural elucidation of nonintentionally added substances (NIAS) in food packaging materials
  • Atmospheric Pressure Gas Chromatography (APGC) is a soft ionization technique that produces lower levels of fragmentation than EI, enabling improved detection of challenging molecular ions and the avoidance of possible erroneous identification
  • UNIFI Software provides customized workflows to streamline and simplify elucidation of unknown compounds from food packaging

Introduction

Food comes into contact with many materials and articles during its production, processing, storage, preparation, and serving before its eventual consumption. Such materials and articles are called food contact materials (FCMs). Recently, concern about the wholesomeness and safety of food products has increased dramatically. Most of the concern usually focuses on food additives, monomers, oligomers, and non-intentionally added substances (NIAS). A non-intentionally added substance is defined in the European Union (EU) Regulation No 10/2011 as “an impurity in the substances used or a reaction intermediate formed during the production process or a decomposition or reaction product.”1,2 FCMs can, therefore, be considered materials containing a complex mixture of substances of known or unknown identity/origin. Depending on their physico-chemical properties and chemical composition, FCMs may transfer some constituents, both Intentionally Added Substances (IAS) and NIAS to foodstuffs. This mass transfer phenomenon is called migration, and may lead to high exposure to certain chemicals, which might cause a risk for human health.3 Therefore, migration must be evaluated and controlled. Furthermore, where migration brings about an unacceptable change in the composition of food or brings about deterioration in the organoleptic properties of the food, it must be avoided.4

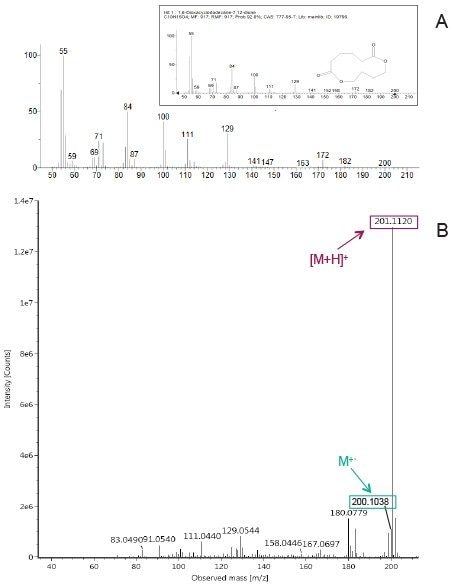
Before performing a migration study, a screening analysis of the packaging material is required to identify the chemicals that are present in the material and those that are more likely to migrate. This initial step usually involves a strong extraction of the material with an organic solvent or a mixture of solvents. The extract is then injected via LC-MS and/or GC-MS for non-targeted screening analysis of non-volatiles, and volatiles/semi-volatiles, respectively. With respect to semi-volatiles and volatiles analyses, a GC coupled to a quadrupole mass spectrometer equipped with electron ionization using 70 eV in the ion source is typically employed, since it allows the analyst to use scientific libraries, such as NIST, for comparing acquired spectra with those in the library. However, the identification process becomes almost impossible when the compound of interest is not listed in the library, or when the sensitivity of the quadrupole MS is not sufficient for reliable mass confirmation. Waters Atmospheric Pressure Gas Chromatography (APGC) and Xevo G2-XS quadrupole time-of-flight (QTof) mass spectrometer, along with the UNIFI Scientific Information System provides an advantageous solution to overcome this hurdle. 

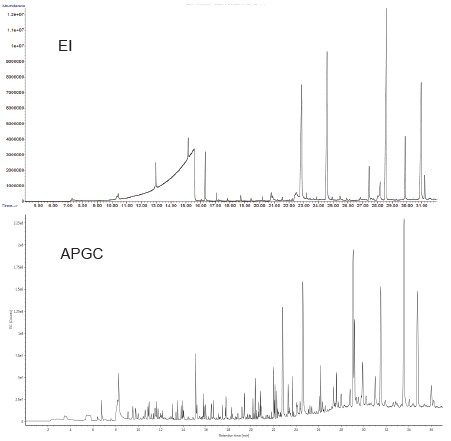
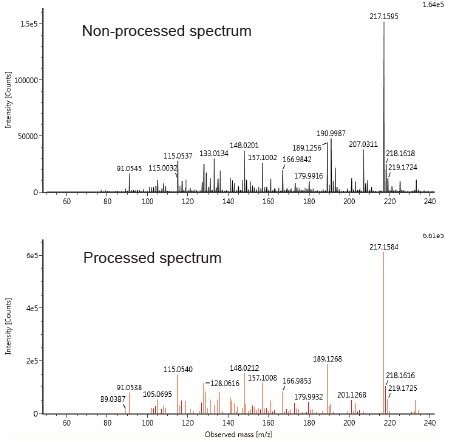
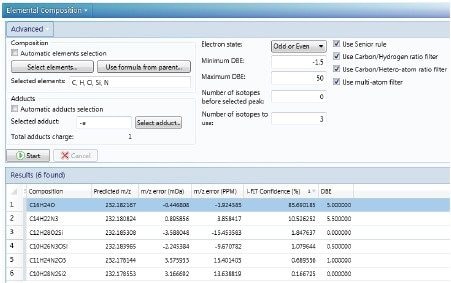
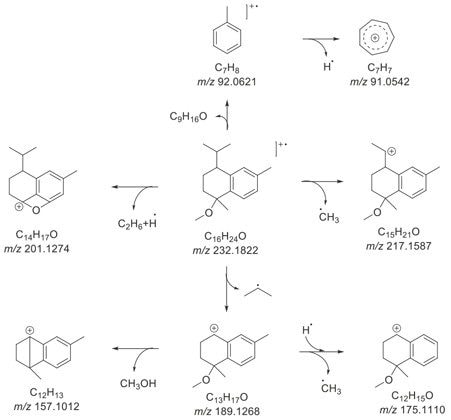
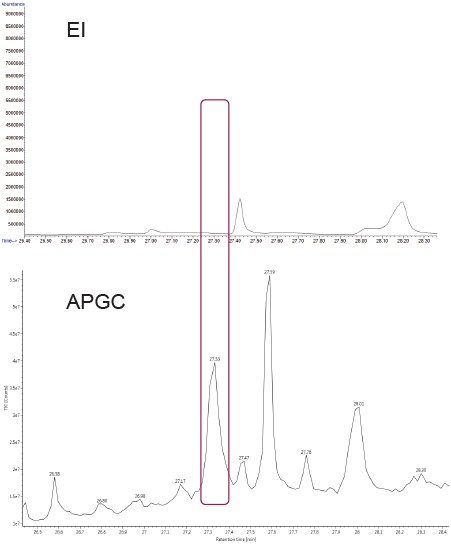
APGC is a soft ionization technique which enables molecular ions to be observed.5 Furthermore, the use of high resolution mass spectrometry (HRMS) and its proprietary MSE mode6 allows analysts to simultaneously acquire data containing the accurate mass of precursor and fragment ions. Finally, UNIFI’s Discovery tool utilizes accurate mass and fragment information to facilitate the decision-making process towards the eventual identification of unknown compounds. To illustrate the benefits of APGC-QTof against electron ionization (EI)-single quadrupole MS, a polymer extracted sample was injected into both systems using the same chromatographic conditions in order to perform a comparative study of the chromatographic traces.

Experimental

Sample preparation

The sample, consisting of novel starch-based biopolymer pellets (0.5 g), was extracted three times with 2.5 mL of methanol  in an ultrasonic bath for 1 hour at 40 °C. The total extraction solution (7.5 mL) was concentrated to 1 mL under a gentle nitrogen flow at room temperature before injection.  

GC conditions

GC system:

Agilent 7890A

Autosampler:

7683B

Column:

DB-5MS, 30 m x 0.25 mm I.D. x 0.25 μm film thickness

Injection type:

1 μL pulsed splitless

Pulse time:

1.2 min

Pulsed pressure:

32 psi

Inlet temp.:

250 °C

Carrier gas:

He at 1 mL/min

Oven temp. program:

50 °C held for 2 min, ramp 50 to 300 °C 10 °C/min, 300 °C held for 10 min

MS conditions

MS system:

Xevo G2-XS QTof, sensitivity mode

Scan range:

50 to 650 m/z

Corona current:

2.2 μA

Sample cone:

30 V

Source temp.:

150 °C

Cone gas flow:

140 L/h

Auxiliary gas flow:

225 L/h

Make-up gas:

N2 300 mL/min at 300 °C

Collision ramp for MSE:

20 to 30 eV

Lock mass:

Persistent column bleed peak, 207.0324 m/z

EI solvent delay:

4 min

Data management:

UNIFI Scientific Information System

Results and Discussion

Data were acquired using dry conditions, where nitrogen charge transfer occurs and gives rise to the (radical cation) molecular ion M information. 

First, Total Ion Current (TIC) chromatograms acquired with EI (using an Agilent 6890N gas chromatograph with a MS 5975B detector) and APGC were compared. It is notable that APGC showed a higher number of peaks (Figure 1). This is due to the higher sensitivity of the QTof versus the single quadrupole, and to the intrinsic characteristics of the two different types of ionization techniques.

Binary comparison

It is important to determine whether a peak comes from the tested material or from external contamination. Therefore, the analysis of a sample must always be accompanied by the analysis of its blank extract. UNIFI Software’s Binary Compare feature allows direct comparison  of the analysis results of an unknown sample  with those of a reference (blank) sample, and to display the results in a mirror-image plot (Figure 2).

Figure 1. TIC chromatograms of the polymer extract acquired with EI (top), and with APGC at low collision energy (bottom).
Figure 2. UNIFI’s Binary Compare window shows the unknown sample and blank chromatographic profiles.

In addition, after specifying the mass tolerance, retention time tolerance, and intensity threshold of the unknown and reference samples in the comparison settings, UNIFI returns a Component Summary, where it is easy to identify the ions that are present  in the unknown sample only, sorted by the intensity of response (Figure 3).

Figure 3. Excerpt of Component Summary table. 

UNIFI’s Binary Compare function is particularly useful when the blank samples present a high level of contamination, as well as when some of the peaks are not perfectly resolved. Furthermore, some components were not visible in the TIC chromatogram due to the trace-level nature of some NIAS from the packaging materials. In these circumstances, UNIFI Software helps the user to determine the unique compounds in the sample extract despite their low intensity, which would be labelled as “unknown unique”.

Confirming indetification

The first step is testing the applicability of APGC for the confirmation of compounds that are associated to a candidate in the NIST library with a high match value. By way of example, the peak at retention time 16.3 min was identified by EI as 1,6-Dioxacyclododecane-7,12-dione (molecular formula C10H16O4, monoisotopic molecular  mass 200.1049 amu, CAS number 777-95-7)  with a match of 917 (Figure 4A).

The same peak was processed via APGC, and its spectrum showed a base peak at  m/z 201.1120, which is attributed to the [M+H]+ ion (Figure 4B).

Figure 4. Comparison between the unknown and the reference for peak Rt = 16.2 min, showing (a) EI spectra, and (b) APGC low collision energy spectrum of the same chromatographic peak. 

Using UNIFI’s Mass Calculator feature, it is possible to obtain the exact mass of the adduct candidate molecular formula proposed by the EI library [C10H16O4+H]+. Hence, the mDa and ppm errors can be calculated. In the current example, the candidate molecular formula presents -0.14 mDa error and -0.7 ppm error. In APGC, the molecular ion M+· at m/z 200.1038 is also present; in this case, the errors are -0.48 mDa and -2.4 ppm. Even though the presented APGC spectrum was obtained under dry conditions, protonation prevails over charge transfer because the structure of the investigated molecule favors accepting a proton, since even under dry conditions, the complete elimination of moisture in the ion source cannot be reached. The results demonstrate that the molecular formula of the candidate could be confirmed by the accurate mass of the molecular ion and the protonated adduct. 

While linear adipates are usually employed as plasticizers in many plastic materials, 1,6-Dioxacyclododecane-7,12-dione is a cyclic adipate that was previously also found as a NIAS in biodegradable polyesters,7 printing inks,8 and polyurethane plastics.9 

This example highlights the usefulness of APGC coupled with high resolution mass spectrometry when confirmation of the molecular formula is needed.

Correcting an incorrect identification

At the retention time 17.2 min in EI there was a very low intensity and broad peak that NIST attributed to 3,4-altrosan or beta-D-glucopyranose, 1,6-anhydro-, with a match value of 787. Both compounds have a molecular weight of 162 amu. However, by analyzing the same peak in APGC, a base ion peak at m/z 232.1817 appeared.

UNIFI Software allows users to create a customized workflow through the introduction of filters in order to get better visualization of data, and to save time by focusing on the most relevant components. For example, it is possible to select a specific Rt window to be analyzed and an ion intensity threshold. Applying this filter (Rt window 17.16–17.27 min and response >5000 counts) for peak Rt 17.2 min in APGC, UNIFI returns the component list that fits those settings. In this example, we displayed the processed and non-processed high collision energy spectra of the same component, shown in Figure 5. The processed spectrum appears “cleaner” because it focuses only on the component under investigation, without ions coming from other compounds that could partially coelute with the compound of interest.

Figure 5. APGC high collision energy spectra of peak Rt 17.2 min. Non-processed spectrum (top) and processed spectrum based on component m/z 232.1817 (bottom). 

UNIFI’s filters, views, and workflow steps allow users to review data in a more timely, consistent, and accurate way. The componentization feature in UNIFI allows interrogation of entire datasets without having to interact with the raw data. Componentization also facilitates the selection of candidate components, which may represent unexpected substances within a sample; this is possible with UNIFI’s 3D peak detection algorithm.10

When screening complex samples, the UNIFI Elucidation toolset can be used to investigate and potentially identify candidate components. The Elucidation toolset includes an elemental composition calculator that determines a number of possible formulas for an accurate mass peak. Elemental Composition uses an algorithm, i-FIT, to score each formula by the likelihood that the theoretical isotope pattern of the formula matches a cluster of peaks in the spectrum. To restrict the number of possible formulas, the i-FIT model can take into account fragment ion mass spectral peaks, the number of atoms of elements specified, valence state, the number of double bonds in a formula, the type of isotope pattern, and a series of chemical rules.

By applying the Elemental Composition tool to mass 232.1817 UNIFI proposed the molecular formula C16H24O (M) with the lowest mDa error and the highest i-FIT confidence (%), as shown in Figure 6.

After searching ChemSpider, PubChem, and SciFinder, the suggested molecular formula was attributed to 1,2,3,4-tetrahydro-1-methoxy-1,6-dimethyl-4-(1-methylethyl) naphthalene (CAS number 60698-94-4). The Elemental Composition tool was also used to check the molecular formula of the most abundant fragments in the processed high collision energy spectrum, and to deduce their structures. In Figure 7 the proposed fragmentation pathway  is shown, which confirmed the candidate structure of the molecular ion.

Figure 6. Results from UNIFI Software’s Elemental Composition tool for the ion m/z 232.1817.
Figure 7. Proposed fragmentation pathway of the molecular ion M+·. Fragment ions are defined by their molecular formula and exact mass-to-charge ratio.

1,2,3,4-tetrahydro-1-methoxy-1,6-dimethyl-4-(1-methylethyl) naphthalene was also found in essential oil extracts of several plants, such as hops, pine and Japanese spicebush,11-13 as well as in propoli extracts14 as a component of the volatile profile. 

Here, we were able to correct the EI identifications of components that presented a low match value or that were not listed in the libraries using APGC and UNIFI. 

Identifying previously non-detectable peaks

Since the APGC-QTof MS system delivers enhanced sensitivity compared to EI-MS, APGC spectra lead to a significantly higher number of detected peaks. Consequently, it  is possible to extend the identification process to a wider range of compounds. By way of example, the compound represented by the  peak at Rt 27.3 min in the APGC spectrum  was not present in the EI spectrum (Figure 8). 

In this step, the Discovery tool in UNIFI was employed on the base ion peak m/z 410.3169.

In Figure 9 it can be noted that UNIFI attributed the component of interest to a predicted list of chemicals, recognized to be likely by an automatic search in ChemSpider. The table shows a list of possible compounds sorted by Predicted Intensity, i-FIT Confidence, Fragment Match, or number of citations. 

Figure 8. Comparison between the EI and APGC chromatograms within the range  26.4–28.4 min, highlighting the peak at 27.3 min in APGC, not detected with EI.
Figure 9. Results from UNIFI’s Discovery tool for component m/z 410.3169 at Rt 27.33 min.

The candidates highlighted in yellow present a Predicted Intensity >50%. After analyzing the most important fragment ions, applying the common organic chemistry rules, and checking their molecular formula and mDa errors, the unknown compound was identified as e-tokoferol, more commonly called beta-tocotrienol, IUPAC name: [R-(E,E)]-3,4-dihydro-2,5,8-trimethyl-2-(4,8,12-trimethyl-3,7,11-tridecatrienyl)-2H-1-benzopyran-6-ol (CAS number 490-23-3). In Figure 10, the Discovery information output is illustrated. On the left side of the figure there is a list of synonyms for the candidate, while on the right side, the software shows the chemical structure and the high collision energy mass spectrum, where the most important fragments are pointed out.  

It is possible to check out the molecule’s cleavage points by clicking the fragment marker on the ion peak; the fragment m/z 191.1062 was chosen as an example.

Figure 10. UNIFI’s Discovery tool information output of beta-tocotrienol. Highlighted is one of the major fragments (m/z 191.1062).

Tocotrienols are members of the Vitamin E family, characterized by an unsaturated isoprenoid side chain (farnesyl isoprenoid tail) with three double bonds; their presence in the polymer could be due to their employment as antioxidant additives. In addition, tocotrienols are bioactive compounds normally present in many fatty foodstuff (such as vegetable oils), that have been used in many nutritional and pharmaceutical applications.15

UNIFI’s Discovery tool saves analyst’s time in the elucidation process and provides comprehensive high-quality information by sorting the possible candidates, based on several parameters set by the user. However, it should be noted that to reach a confidence level closer to 100% in the identification of an unknown compound, the candidate compound must be confirmed with a standard by verifying retention time, accurate mass, and common fragments.

Conclusion

Identifying unknown compounds in food contact materials is usually a challenging process. The UNIFI Scientific Information System simplifies the process by providing customizable workflows and achieving data containing accurate mass precursor and fragment ions information  acquired by the MSE functionality. 

EI-MS and APGC-QTof MS systems have been proven to be complementary when the compounds of interest are described in commercially available libraries, whereas APGC-QTof MS is particularly advantageous when the elucidation is required for volatile and semi-volatile components not listed in the libraries, or for those at trace or ultra-trace levels. APGC-Xevo G2-XS QTof with UNIFI can determine possible erroneous identifications and also facilitate component identification for peaks that are not detected using an EI quadrupole MS system. 

Finally, UNIFI componentization eases the burden of data interpretation for the analyst, reducing potential false-positive assignments, and allowing results to be presented clearly and concisely.

References

  1. The European Commission. Regulation EU No 10/2011 of 14 January 2011 on plastic materials and articles intended to come into contact with food. Official Journal of the European Union, 2011.
  2. S Koster, M H Bani-Estivals, M Bonuomo, E Bradley, M C Chagnon, M L Garcia, F Godts, T Gude, R Helling, P Paseiro-Losaba, G Pieper, M Rennen, T Simat, L Spack. Guidance on Best Practices on the risk assessment of non intentionally added substances (NIAS) in food contact materials and articles. International Life Sciences Institute, 2015.
  3. O W Lau, S K Wong. Contamination in food from packaging material. Journal of Chromatography A, 2000.
  4. The European Commission. Regulation EU No 1935/2004 of the European Parliament and of the Council of 27 October 2004 on materials and articles intended to come into contact with food and repealing Directives 80/590/EEC and 89/109/EEC. Official Journal of the European Union, 2004.
  5. APGC. Waters White Paper, no 720004771en. August, 2013.
  6. An overview of the principles of MSE, the engine that drives MS performance. Waters White Paper, no. 720004036en. October, 2011. 
  7. E Canellas, P Vera, C Nerin. UPLC-ESI-Q-TOF-MSE and GC-MS identification and quantification of non-intentionally added substances coming from biodegradable food packaging. Analytical and Bioanalytical Chemistry, 2015.
  8. I Clemente, M Aznar, C Nerin, O Bosetti. Migration from printing inks in multilayer food packaging materials by GC-MS analysis and pattern recognition with chemometrics. Food Additives and Contaminants, 2016.
  9. J S Felix, F Isella, O Bosetti, C Nerin. Analytical tools for identification of non-intentionally added substances (NIAS) coming from polyurethane adhesives in multilayer packaging materials and their migration into food stimulants. Analytical and Bioanalytical Chemistry, 2012.
  10. Componentization following 3D-peak detection in the UNIFI Scientific Information System. Waters White Paper no. 720005480en. September, 2015.
  11. D D Yan, Y F Wong, L Tedone, R A Shellie, P J Marriott, S P Whittock, A Koutoulis. Chemotyping of new hop (Humulus lupulus L.) genotypes using comprehensive two-dimensional gas chromatography with quadrupole accurate mass time-of-flight mass spectrometry. Journal of Chromatography A, 2017.
  12. J J Kim, I Chung, E H Kim, K S Song, A Ahmad. Chemical composition of the essential oil and petroleum ether extract of Korean Pinus densiflora leaves. Asian Journal of Chemistry, 2012.
  13. Z Liu, H Chen. GC-MS analysis of essential oils from leaves of Lindera obtusiloba. Chinese Journal of Experimental Traditional Medical Formulae. 2011.
  14. W Bei, M Haile, Z Jiewen, L Lin. GC-MS fingerprints and clustering analysis of supercritical CO2 extracts of propolis from China. Journal of Chinese Institute of Food Science and Technology. 2011.
  15.  P Y Tan, T B Tan, H W Chang, B T Tey, E S Chan, O M Lai, B S Baharin, I A Nehdi, C P Tan. Effects of environmental stresses and in vitro digestion on the release of tocotrienols encapsulated within chitosan-alginate microcapsules. Journal of Agricultural and Food Chemistry, 2017.

720006198, January 2018

Haut de la page Haut de la page