For forensic toxicology use only.
This application note highlights the development of a rapid, simple dilute and shoot method for the definitive identification and quantitation of ethylglucuronide (EtG) and ethylsulfate (EtS) in human urine using UPLC-MS/MS, for forensic toxicology.
Simple dilute and shoot sample preparation method.
Ethanol consumption has been linked to significant socio-economic burdens worldwide.1 As a result, there is a growing need for the detection and identification of ethanol use. Over the years, ethylglucuronide (EtG) and ethylsulfate (EtS) have emerged as reliable biomarkers of recent ethanol use.2,3 EtG and EtS are minor water soluble phase II metabolites of ethanol and are detectable in urine up to 80 hours following ethanol consumption.2,4 Definitive confirmation of EtG and EtS as a biomarker of ethanol use is performed for a wide range of testing purposes. The authors report the development of a rapid and simple dilute and shoot method for definitive identification and quantitation of EtG and EtS in human urine using UPLC-MS/MS.
Human urine samples for the preparation of calibrators and quality controls (QC) were obtained from volunteer donors with no recent (at least a week) use of ethanol. Prior to use, samples were confirmed negative for EtG by immunoassay analysis. Authentic samples were collected as part of routine casework. All samples were stored at -20˚C without addition of preservatives.
Drug reference material for EtG (Ethyl-β-D glucuronide, 1.0 mg/mL), and EtS (Ethylsulfate, 1.0 mg/mL) and deuterated analogues, EtG-D5 (Ethyl-β-D glucuronide D5, 1.0 mg/mL), and EtS-D5 (Ethyl-D5 sulfate, 1.0 mg/mL) were obtained from Cerilliant Corporation, TX, USA. Deuterated analogues were used for the purpose of internal standardization. Stock solutions containing a mixture of non-deuterated reference material (EtG: 0.1 mg/mL and EtS: 0.05 mg/mL) or a mixture of internal standard (EtG-D5: 0.1 mg/mL and EtS-D5: 0.05 mg/mL) were prepared in methanol and stored at -20 °C. A daily working internal standard solution was prepared by a 400-fold dilution of the stock in distilled water.
Urine samples were initially clarified by centrifugation for three minutes at 7200 rpm (~4227 x g). Following centrifugation, 50 µL aliquots of urine were loaded into a 96-well plate (Waters 96-well Sample Collection Plate, 2 mL square well). Aliquots were diluted by adding 500 µL of the daily working internal standard solution. Following dilution, samples were mixed on a vortex for one minute.
LC system: |
ACQUITY UPLC I-Class |
Column: |
ACQUITY UPLC CSH Phenyl-Hexyl 2.1 x 150 mm, 1.7 μm (P/N: 186005408) |
Column temp.: |
50 °C |
Mobile phase A: |
Water containing 0.1% formic acid |
Mobile phase B: |
Acetonitrile |
Wash solvent: |
Acetonitrile/isopropanol / dH2O (1:1:1) (800 μL) |
Purge solvent: |
2% methanol in dH2O (2400 μL) |
Injection volume: |
10 μL |
Time (min) |
Flow rate (mL/min) |
%A |
%B |
Slope |
---|---|---|---|---|
0 |
0.5 |
98 |
2 |
Initial |
0.1 |
0.5 |
98 |
2 |
6 |
5 |
0.5 |
40 |
60 |
6 |
6.5 |
0.5 |
5 |
95 |
1 |
7 |
0.5 |
98 |
2 |
1 |
Table 1. Gradient conditions, total run time: 7.5 min.
MS system: |
Xevo TQD Mass Spectrometer |
Data acquisition and processing: |
MassLynx v4.1 with TargetLynx |
Ionization mode: |
ESI |
Capillary voltage: |
2.5 kV |
Acquisition mode: |
Multiple reaction monitoring (MRM – Table 2) |
Compound |
Precursor ion (m/z) |
Product ion (m/z) |
Trace type |
---|---|---|---|
EtG |
221.1 |
75.0 |
Quantifier |
EtG |
221.1 |
85.0 |
Qualifier |
EtS |
125.0 |
97.0 |
Quantifier |
EtG-D5 |
226.1 |
75.0 |
Quantifier |
EtG-D5 |
226.1 |
85.0 |
Qualifier |
EtS-D5 |
130.0 |
98.0 |
Quantifier |
Table 2. MRM conditions for EtG, EtS, and corresponding internal standards.
A series of calibrators and quality control (QC) samples were prepared by diluting the stock solution of non-deuterated EtG/EtS in negative human urine (Table 3). Following the simple sample preparation, multiple reaction monitoring (MRM) was performed using two transitions for EtG and EtG-D5, and one transition for EtS and EtS-D5 (Figure 1). For EtG a target quantifier/qualifier ion ratio was determined, using the threshold calibrator (EtG/EtS: 500/250 ng/mL), and subsequently used to monitor QC’s and unknown samples. Acceptability criteria included +/- 20% of target ion ratio.
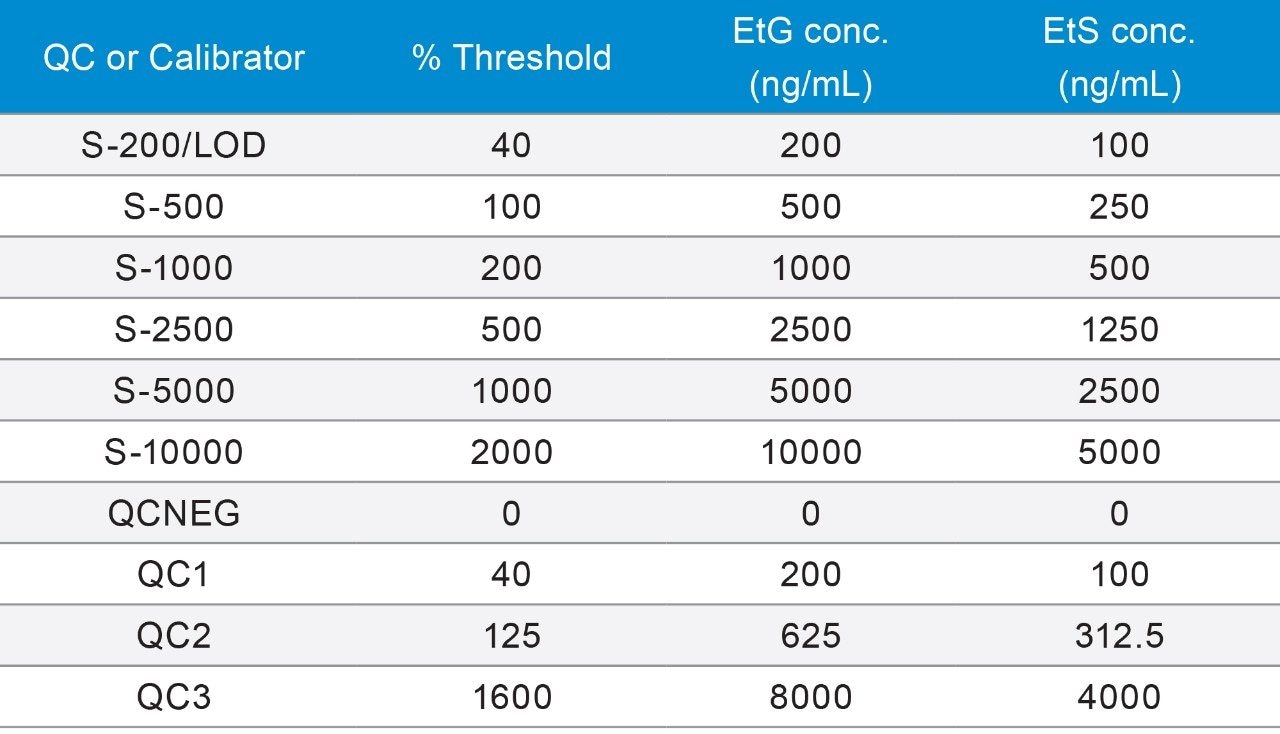
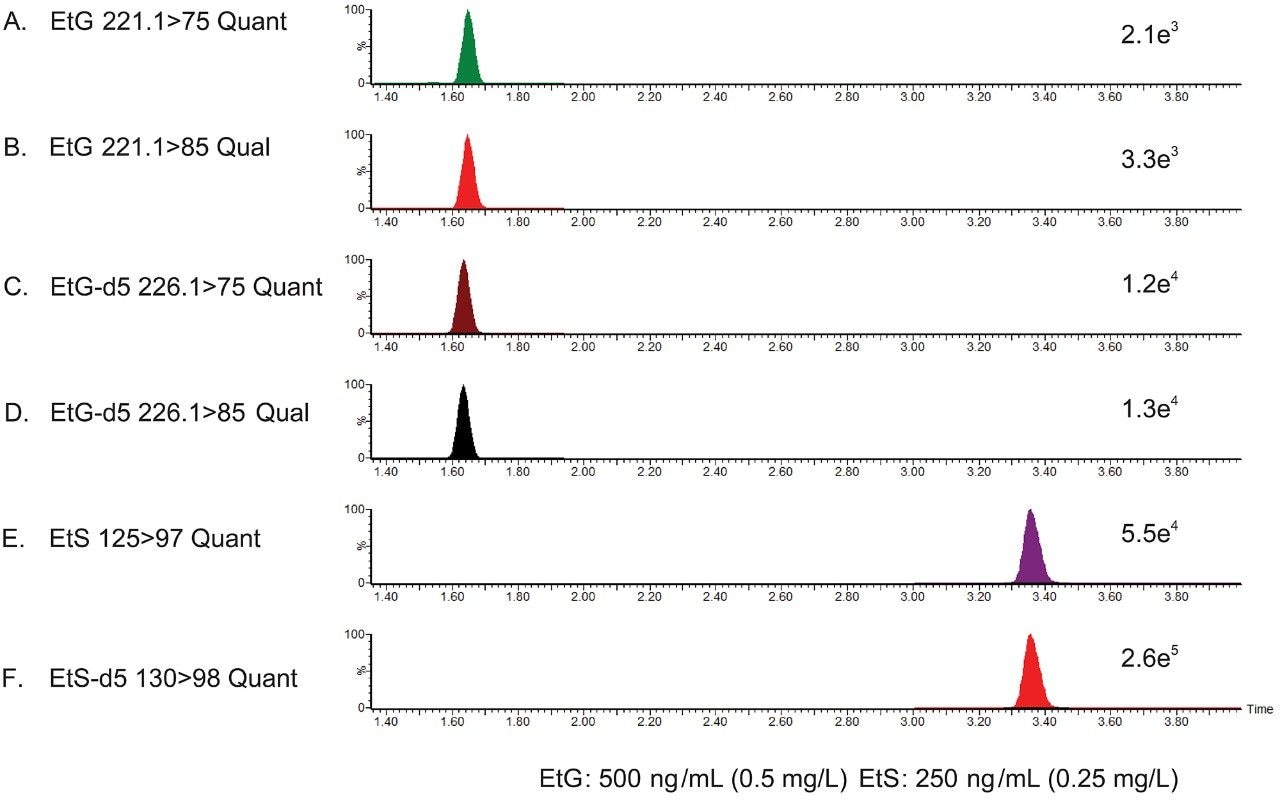
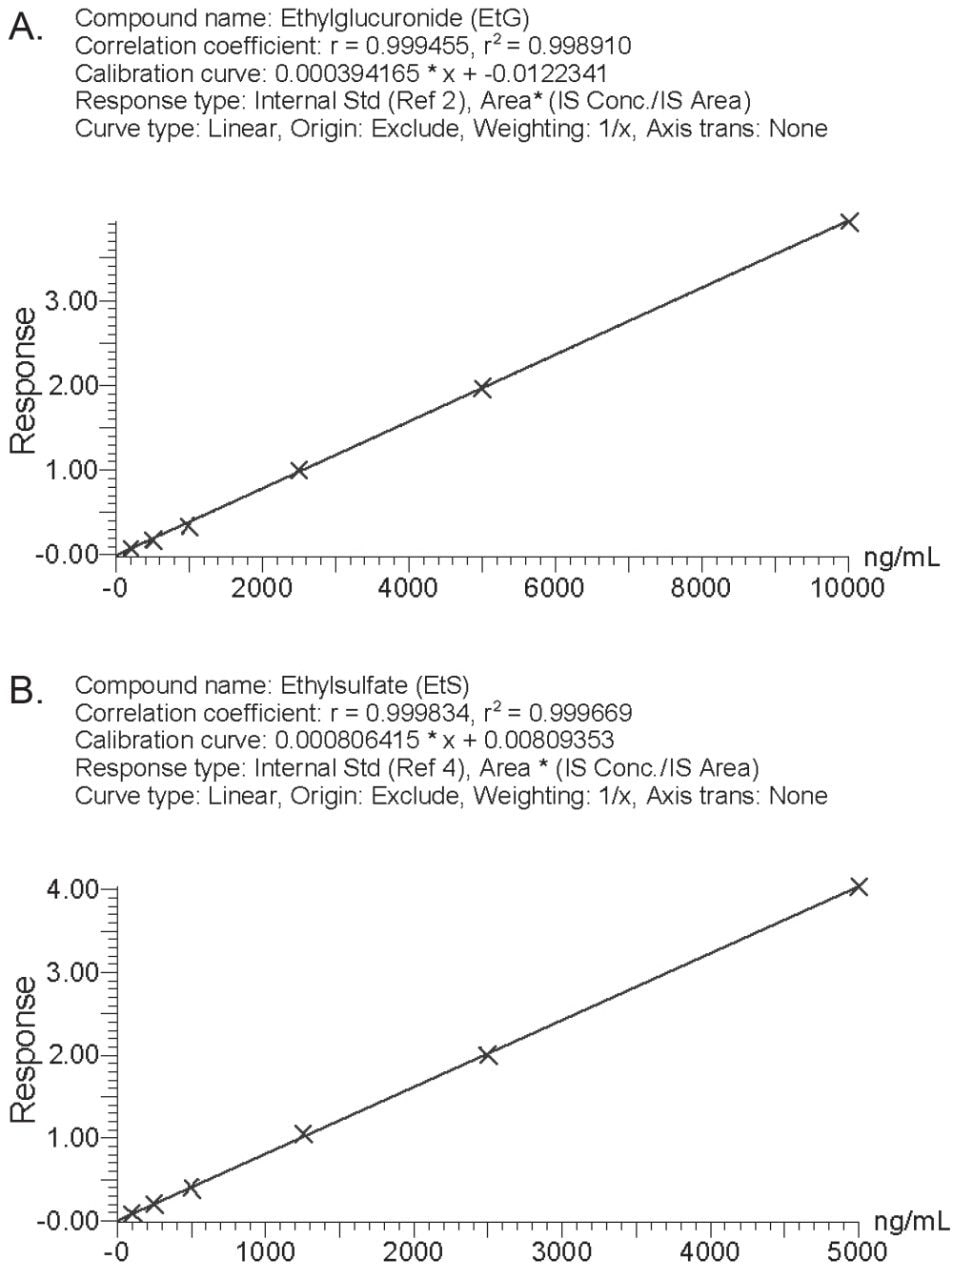
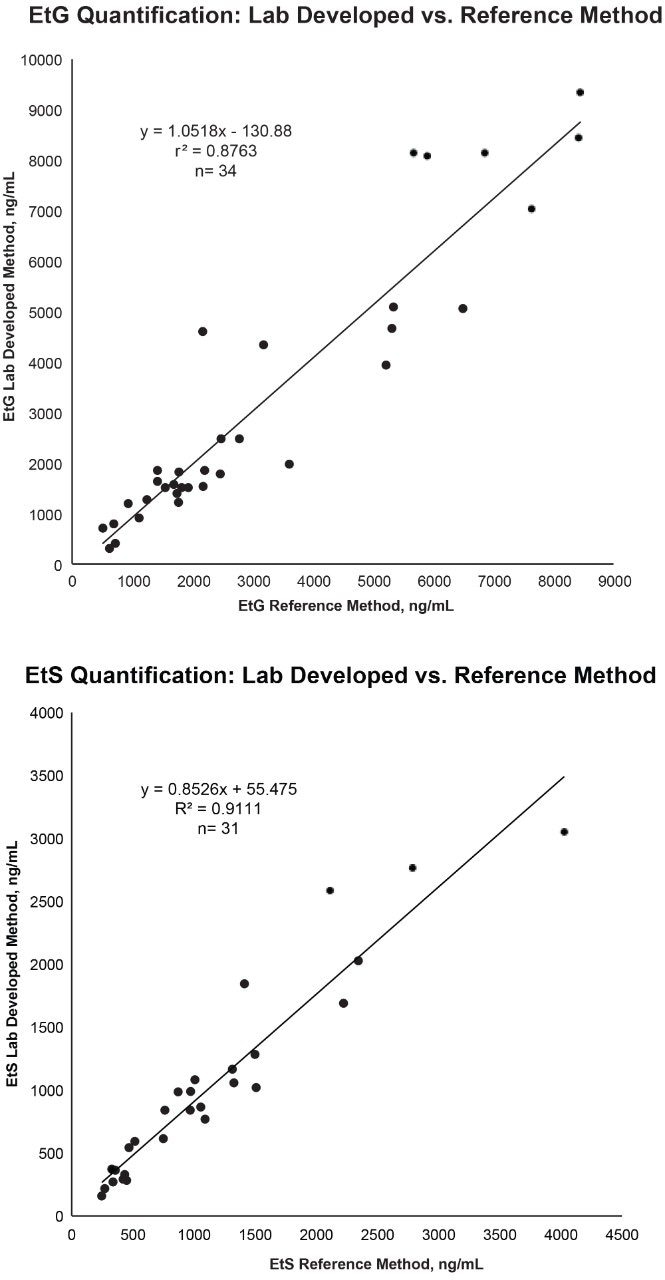
Calibration curves were generated based on the ratio of the response of the analyte’s quantifier ion relative to the response of the quantifier ion for the respective deuterated internal standard. Regression lines were plotted using a 1/x weighting. Calibration curves for EtG (r2 range: 0.991–0.999) and EtS (r2 range: 0.997–0.999) were linear over the analytical ranges investigated, and extended from 200 to 10,000 ng/mL and 100 to 5,000 ng/mL for EtG and EtS, respectively (Figure 2). The cut-off for the assay was set at 500 ng/mL for EtG and 250 ng/mL for EtS. The limits of detection (LOD) were determined using the lowest non-zero calibrator approach. LOD’s for EtG and EtS were set at 200 ng/mL and EtS 100 ng/mL, respectively.
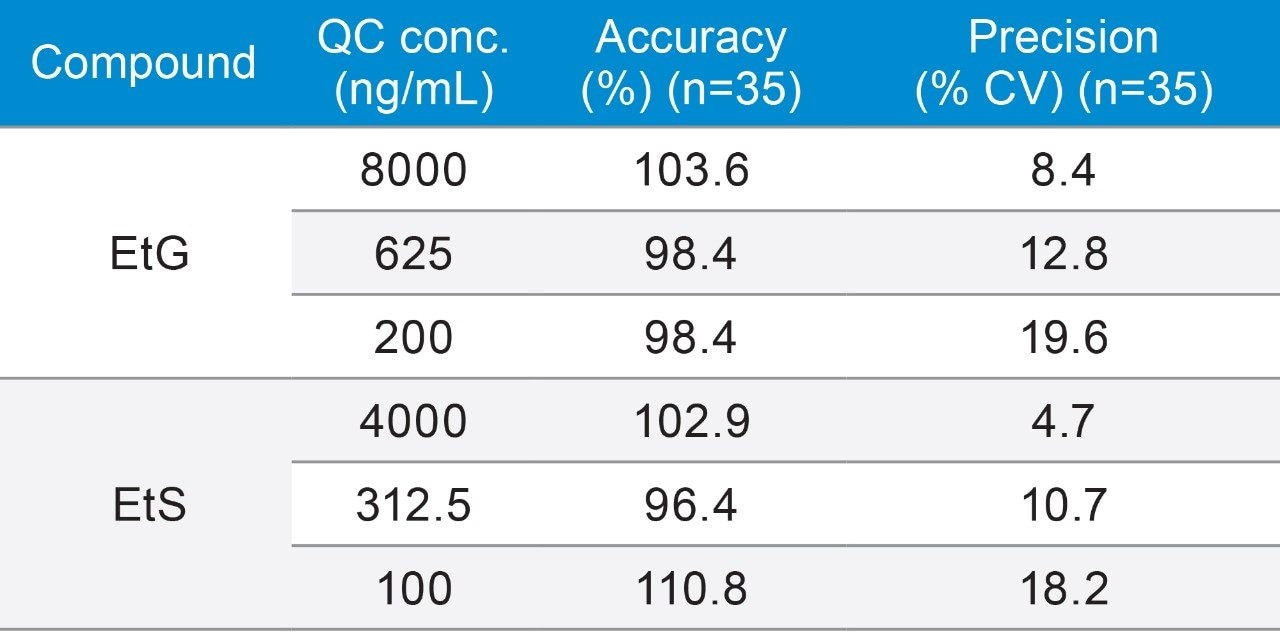
The precision and accuracy of the method were assessed at three QC concentrations for EtG (200, 625, 8000 ng/mL) and EtS (100, 312.5, 4000 ng/mL). Based on 11 analytical runs, consisting of three or four replicates, the assay precision (%CV) and accuracy for EtG ranged from 8.4 to 19.6, and 98.4% to 103.6%, respectively. The assay precision and accuracy for EtS ranged from 4.7 to 18.2, and 96.4 to 110.8%, respectively. In all, the method showed good precision and accuracy as summarized in Table 4.
Matrix effects were evaluated using aqueous versus urine based control samples through the analysis of 10 negative urine specimens and aqueous mobile phase spiked with EtG and EtS at 1000 and 500 ng/mL, respectively. Percent matrix effect was calculated using the following formula: [(A/B – 1) × 100%] where A represents the ion response in urine matrix and B represents the ion response without urine matrix present. Ion effects varied from 1% to -58% for EtG and -54% to 94.6% for EtS. Based on dilute and shoot sample injections, ion suppression of greater than 20% was anticipated, however for this reason analyte-matched deuterated internal standards were incorporated into the method to compensate for matrix effects. Normalization of the data using this approach resulted in a robust assay and satisfied the criteria for precision and accuracy. The stability of EtG and EtS were assessed in both primary specimens and prepared samples following a five day storage period at -10 °C and 4 °C, respectively. Results from reanalysis of primary specimens (n=6), calibrator, and QC samples were within 20% of the results obtained on initial analysis.
Method correlation studies were performed using de-identified casework specimens (n=34) with positive presumptive and confirmatory results for EtG and/or EtS. Initial presumptive results were obtained using a qualitative Microgenics DRI® EtG Enzyme immunoassay analysis with a 500 ng/mL cutoff. Quantitative EtG and EtS results were obtained from MedTox Laboratories, Inc. (Minnesota, USA) using a currently validated confirmatory LC-MS/MS method (reference method). Following initial analyses, the specimens were stored at -10 °C for a period of six months. Table 5 shows the results from the reference and developed methods. Analysis of the concentrations obtained by both methods shows dispersion in the data as expected between laboratories (Figure 3). However, statistical analysis did not show method bias based upon linear regression analysis using 95% confidence limit for the slope and y-intercept (Table 6).
Definitive confirmation of ethanol metabolites is performed as a biomarker of ethanol use for a wide range of testing purposes. The developed method is accurate, precise, and demonstrates the analytical sensitivity necessary for reliable identification of ethanol use based on urine specimen analysis. The simple sample preparation and short chromatography of the developed method can significantly improve the efficiency of EtG and EtS identification and quantitation in a high-throughput setting.
Michelle Wood, Waters Corporation (Wilmslow, UK), Robert Lee, Waters Corporation (Wilmslow, UK), Jonathan Danaceau, Waters Corporation (Milford, MA, USA) and Scott Freeto, Waters Corporation (Beverly, MA, USA) for technical assistance and advice during development of the analytical method.
720006273, May 2018