Simultaneous Separation and Quantification of Aminoglycosides Using Liquid Chromatography and Mass Spectrometry
Abstract
Chromatographic analysis and detection of aminoglycosides can be challenging and time consuming. This is due to the fact that these analytes are highly polar, non-volatile, and they lack chromophores. Here we show the development of a rapid, simple, and straightforward liquid chromatography/mass spectrometry method for the analysis of aminoglycosides. The final method uses an Atlantis™ Premier BEH™ Z-HILIC Column on an ACQUITY™ UPLC™ System that is equipped with the ACQUITY QDa™ Mass Detector. The developed method showed excellent linearity for the quantification of aminoglycosides of over 0.99 linear regression over a wide range of concentrations for all analytes. The method provided very sensitive detection limits of aminoglycosides as low as 0.5 µg/mL in some instances.
Benefits
- This single HILIC assay using the Atlantis Premier BEH Z-HILIC Column in combination with the ACQUITY QDa Mass Detector can replace several traditional assays for analyzing a wide variety of aminoglycosides, substantially reducing time and cost
- The method does not require any derivatization or the use of fluorinated ion pairing agents
- Simple and rapid separation and quantification of aminoglycosides using the ACQUITY QDa Detector
- Selected Ion Recording (SIR) function of QDa was implemented to quantify aminoglycosides
Introduction
Aminoglycosides are a group of antibiotics that are used to treat Gram-negative bacterial infections.1–3 These compounds are highly polar, non-volatile, and they don’t have strongly absorbing chromophores. As such, quantitative analysis of such compounds is challenging and normally requires derivatization, specialized detectors, and/or the use of fluorinated ion pairing agents.4,5 Reversed-phase liquid chromatography has been successfully used for the analysis of aminoglycosides. However, this approach hasn’t been widely used because it calls for using ion pairing agents that could have negative impacts on the separations such as the long equilibration times. To combat that, Hydrophilic Interaction Chromatography (HILIC) has also been used for the analysis of aminoglycosides using Aminopropyl HILIC stationary phases.6 While these stationary phases have shown to be successful at separating some aminoglycosides, the selectivity was limited. Recently, Waters™ reported the use of a new zwitterion sulfoalkylbetaine stationary phase (Atlantis Premier BEH Z-HILIC Column) for the analysis of aminoglycosides by Electrospray Tandem Mass Spectrometry (ESI-MS/MS).7 While this approach is very useful and provides very accurate and sensitive measurements for a wide variety of aminoglycosides, MS is not widely used in quality control (QC) pharmaceutical laboratories due to high-maintenance equipment, complicated operation, and data analysis. Further, the high-end mass spectrometers are expensive and pose difficulty in global QC application. As such, it will not only be interesting but also important to examine if we can employ a small, robust, and simple-to-use mass detector for the analysis of non-chromophoric compounds such as aminoglycosides.
In this application note, we report the use of the ACQUITY QDa for analyzing and quantifying aminoglycosides in a standard mixture. The ACQUITY QDa is a single-quadrupole mass detector with an electrospray ionization source. Compared to traditional high-end mass spectrometers, QDa is cost effective and very easy to operate and maintain. A UPLC method using the newly launched Atlantis Premier BEH Z-HILIC Column in combination with the ACQUITY QDa Mass Detector was employed in this study to demonstrate the system suitability and the dynamic range for routine analyses of aminoglycoside assays. The chemical structures of the aminoglycosides that were examined in this study are shown in Figure 1.
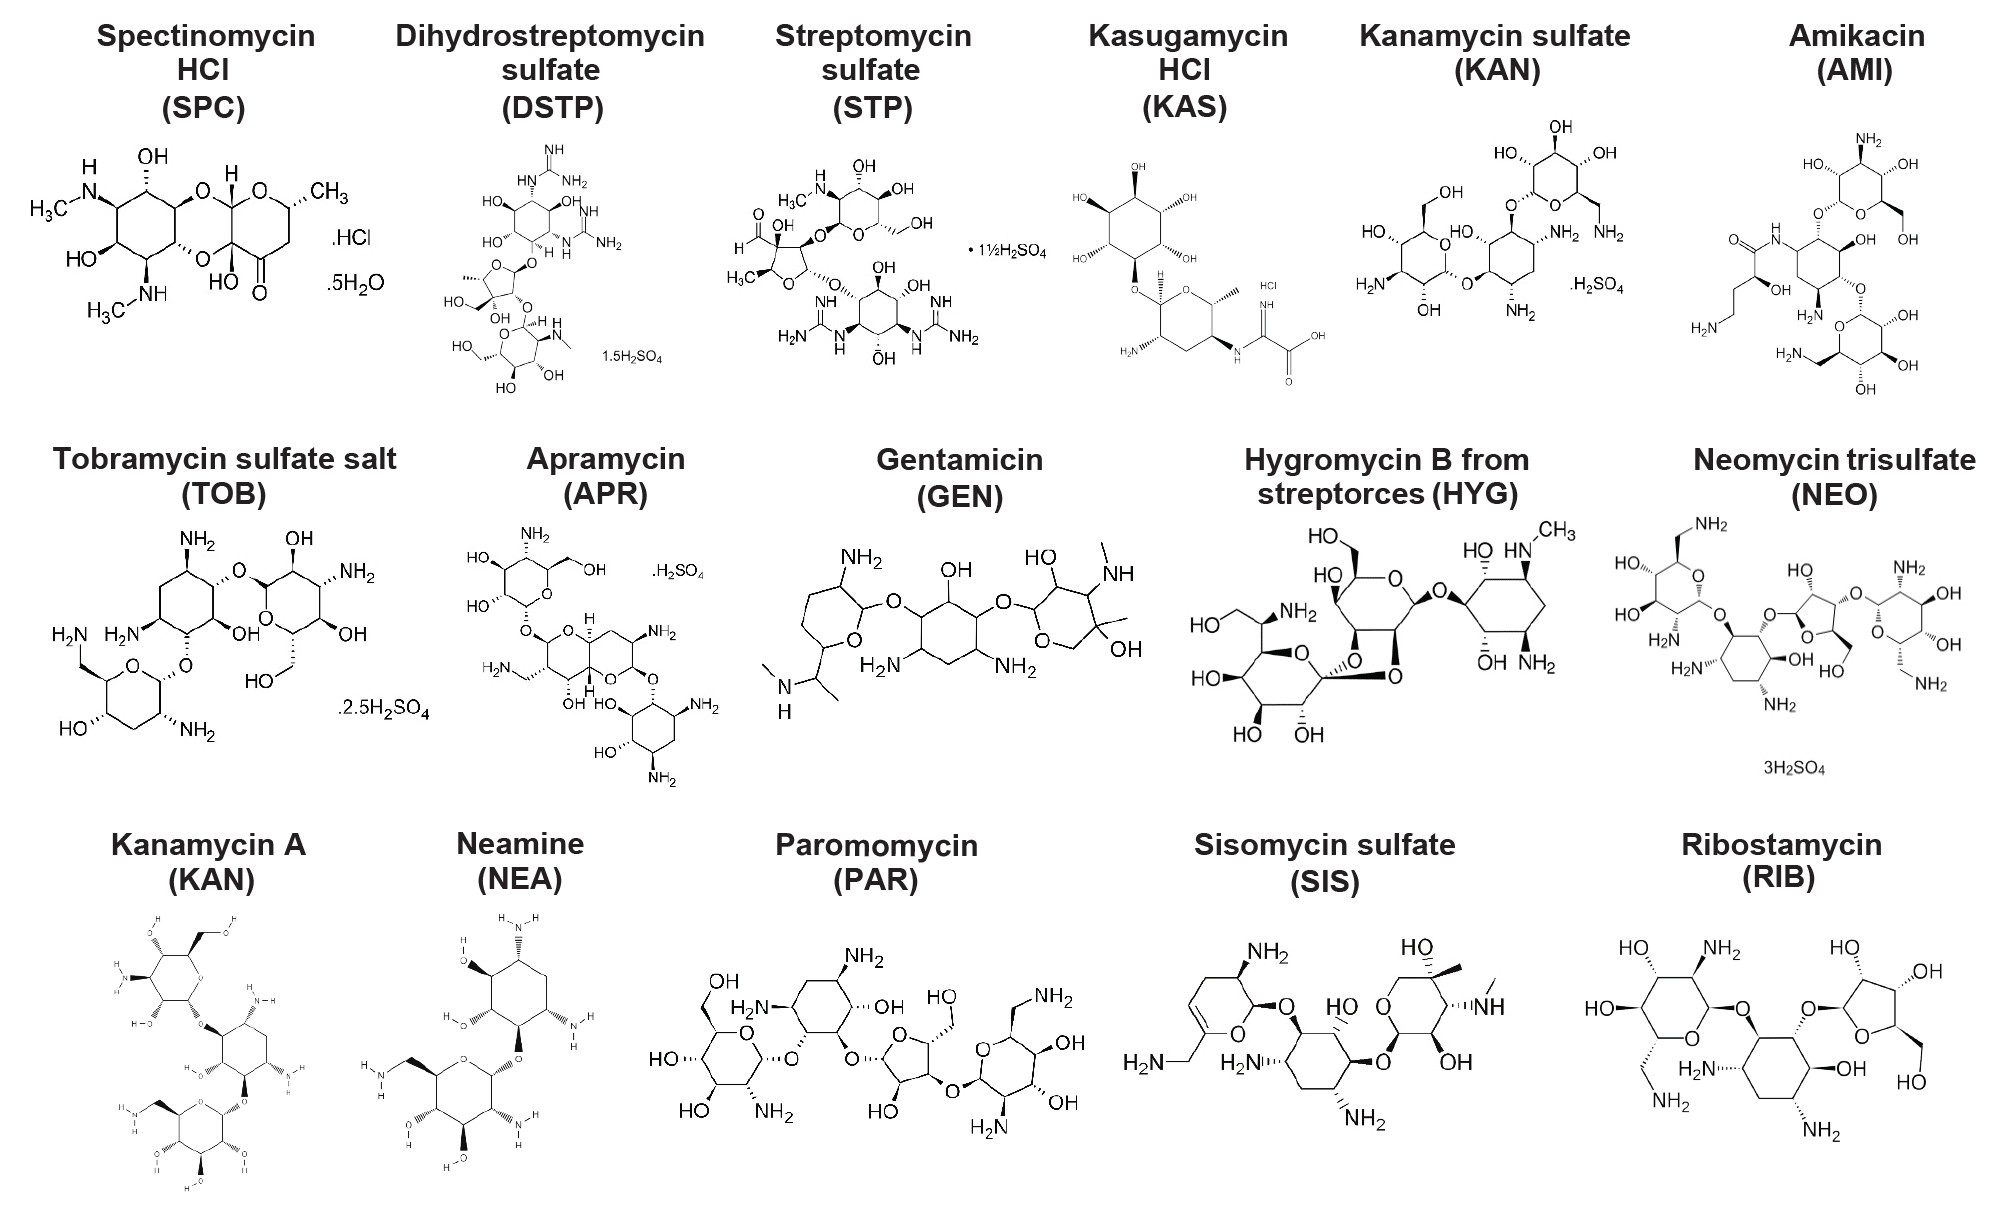 Figure 1. Chemical structures of 16 aminoglycosides that have been tested in this study.
Experimental
Materials and Standard Preparations
Amikacin, hygromycin B, ribostamycin sulfate, sisomicin sulfate, gentamicin sulfate, neomycin trisulfate salt hydrate, tobramycin sulfate, and kanamycin sulfate were purchased from Sigma–Aldrich (Allentown, PA). Neamine (or neomycin A) hydrochloride, apramycin sulfate, kasugamycin hydrochloride, streptomycin sulfate, paromomycin sulfate, dihydrostreptomycin sulfate, and spectinomycin dihydrochloride hydrate were purchased from Cayman Chemical (Ann Arbor, MI). Stock solutions of these compounds were prepared by accurately weighing the desired amounts of each standard and dissolving them in deionized water. The stock solutions were then used to make a test mixture that contains all the aminoglycosides. This mixture was prepared by diluting the stock solutions of each one of the standards in deionized water (>18.2 Mohm∙cm) as sample solvent. The final concentration of each analyte in the test mixture was approximately 0.01 mg mL-1. Standard working solution mixtures were prepared by mixing and diluting the stock standards with deionized water. All solutions were stored in PP containers in a freezer (-20 °C).
LC Conditions
|
LC system: |
ACQUITY UPLC H-Class System with Quaternary Solvent Manager (rQSM), Sample Manager (rFTN), Column Manager, and a CM Aux, PDA Detector, QDa Mass Detector |
|
Detection: |
PDA and QDa |
|
Column: |
1.7 µm, 2.1 x 100 mm Atlantis Premier BEH Z-HILIC Column pH range: 2–10 |
|
Column temp.: |
50 °C |
|
Sample temp.: |
5 °C |
|
Injection volume: |
3 µL |
|
Flow rate: |
0.5 |
|
Mobile phase A: |
0.1% (v/v) Ammonium formate in water (non pH adjusted, pH: ~7.3 |
|
Mobile phase B: |
0.1% (v/v) Formic acid in acetonitrile |
MS Conditions
|
MS system: |
ACQUITY QDa Mass Detector |
|
Ionization mode: |
ESI+ |
|
Acquisition range: |
300–630 Da |
|
Capillary voltage: |
0.8 kV |
|
Source temp.: |
400 °C |
|
Cone voltage: |
15 V |
Data Management
|
Chromatography software: |
Empower™ 3 Chromatographic Data System |
Results and Discussion
QDa Based Method Development
At this part of the study, the goal was to optimize the chromatographic conditions and the QDa MS settings to get good separations and detections of aminoglycosides. As mentioned earlier, the separation of these aminoglycosides has previously been reported.7 The method used an Atlantis Premier BEH Z-HILIC Column (2.1 x 2.5 µm x 15 cm) applying a pH of 3.0, 20 mM buffer concentration (ammonium formate), a temperature of 50 °C, a flow rate of 0.7 mL min-1, and a gradient time of ten minutes. These conditions were examined as starting point conditions after adjusting the gradient profile according to our instrument and column dimensions using the Column Calculator tool in Empower. The initial conditions and the adjusted conditions are detailed in Table 1.
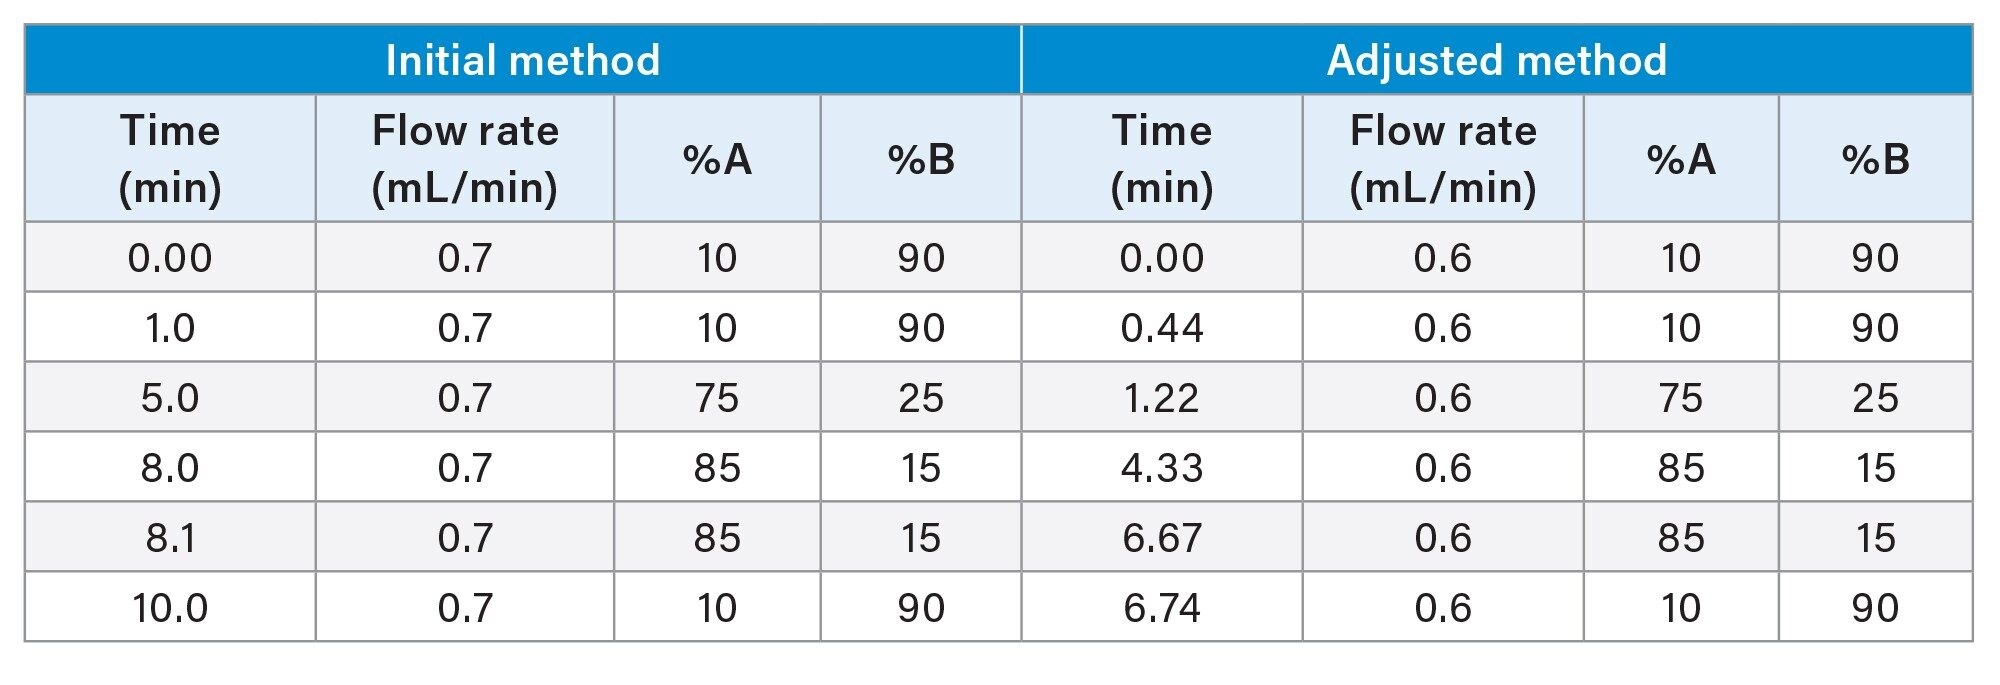 Table 1. The reported method (reference 7) and the adjusted method based on instrument and column dimensions and geometries.
The AQUITY QDa Mass Detector settings were also optimized for better sensitivity. For instance, various ESI probe temperatures and cone voltages were screened for their effects on the signal and on the intensity of the peaks. Optimal signals were obtained at a probe temperature of 400 °C and a cone voltage of 15 V. Results of this experiment showed that all the sixteen aminoglycosides in the mixture can be separated and detected under these conditions as can be seen in Figure 2. However, since the signal of some of these analytes haven’t been very strong, the decision was made that further experiments will only be pursued for the analytes that show strong response on the ACQUITY QDa detector. These analytes included, spectinomycin HCl, streptomycin sulfate, amikacin, kanamycin sulfate, neamine, and sisomycin sulfate.
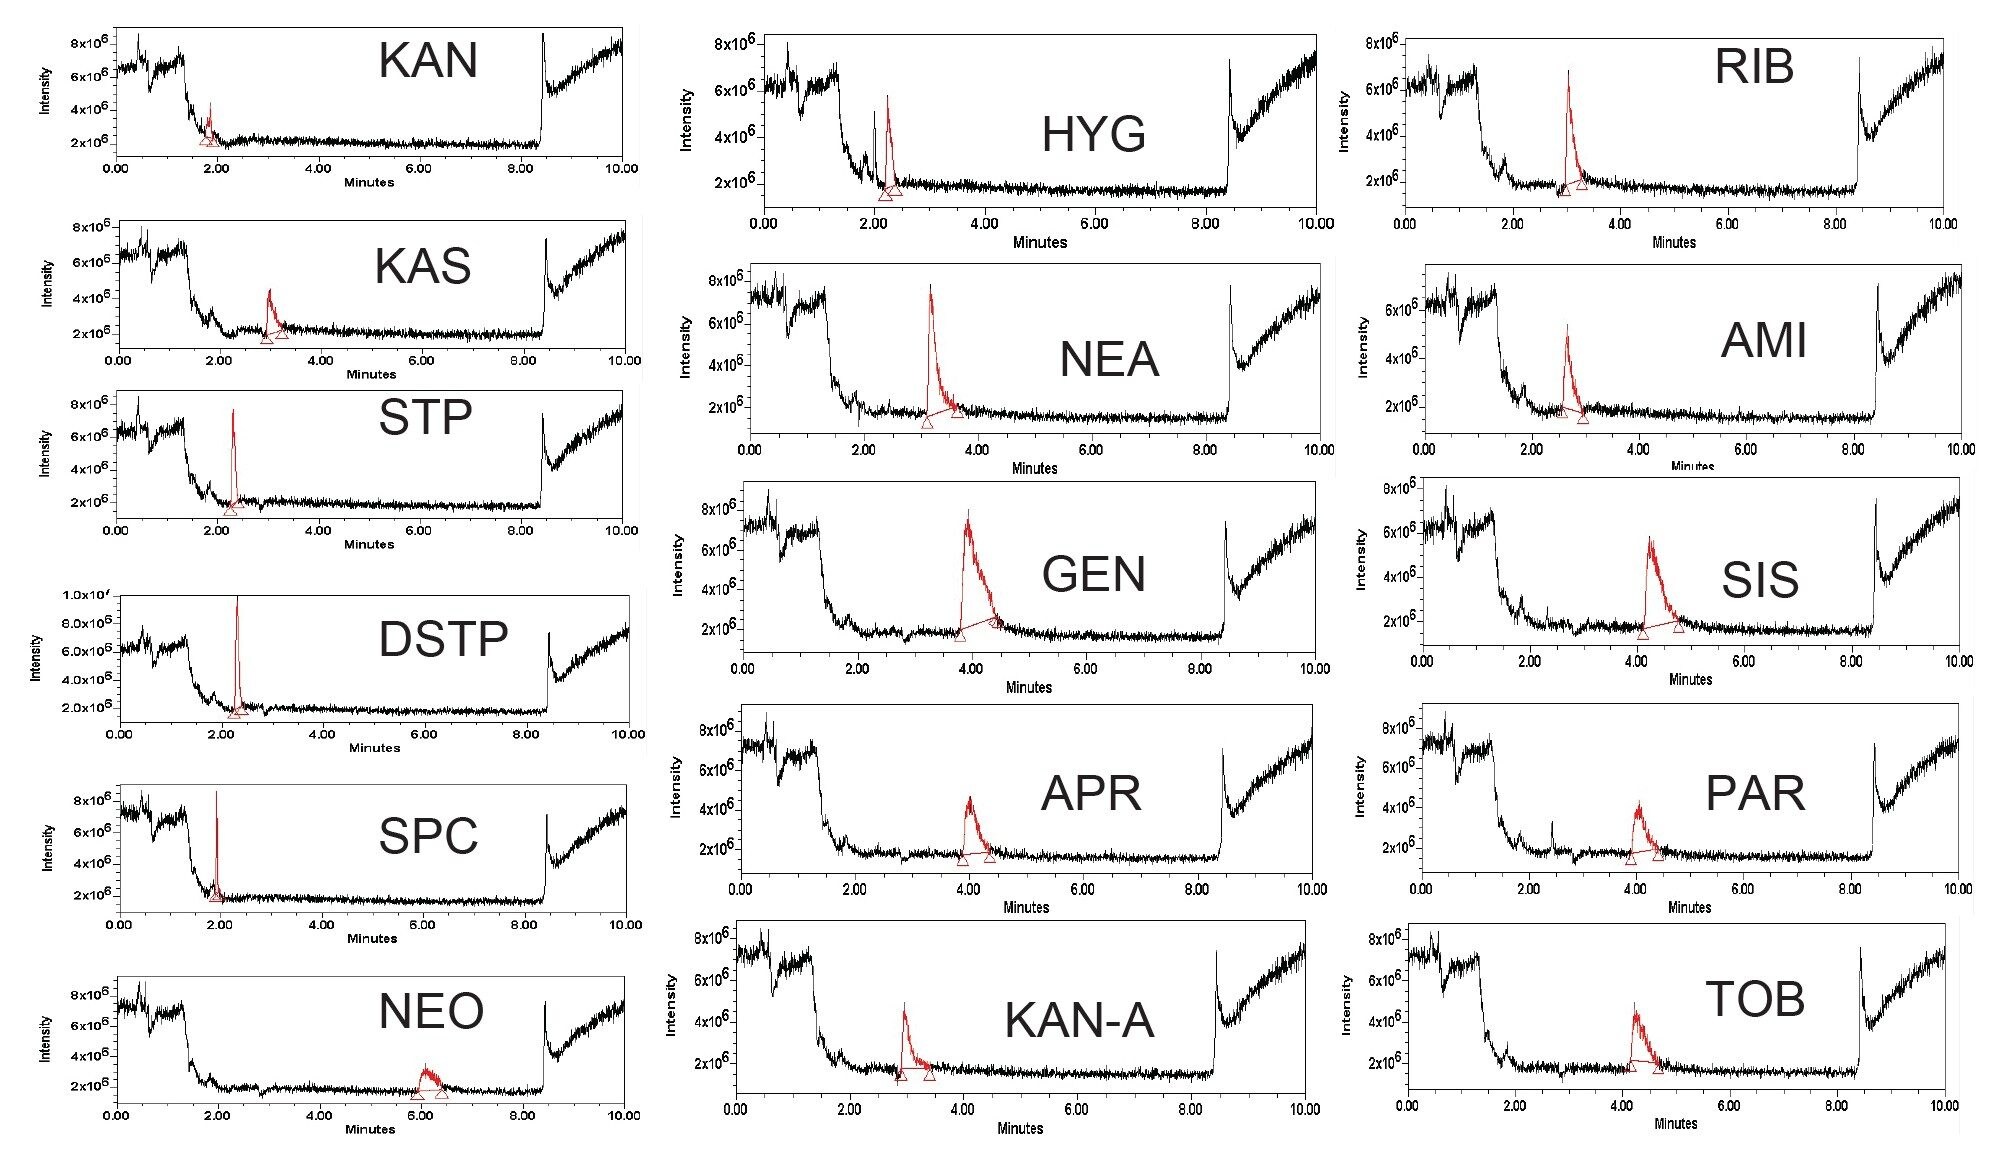 Figure 2. Total Ion Chromatograms (TIC) of individual standards of the 16 aminoglycosides shown in Figure 1. Chromatographic conditions are: a pH of 7.3, a 20 mM buffer concentration (ammonium formate), a temperature of 50 °C, a flow rate of 0.5 mL min-1 and a gradient time of ten minutes, and an Atlantis Premier BEH Z-HILIC Column (2.1 x 2.5 µm x 10 cm).
Selected Ion Recording (SIR)
To increase sensitivity and generate straightforward result output, the SIR function of QDa was used to monitor and quantify specific peaks. This mode of detection records a single user-defined mass-to-charge ratio (m/z) value at each time point in the chromatogram, with all other ions being rejected. Using this function is very useful as it brings sensitivity and higher specificity into the analysis. Figure 3A shows an overlay of the SIR plots of the six aminoglycosides that have been selected from the previous experiment and Figure 3B shows the Total Ion Chromatogram (TIC) of these six compounds. While the TIC chromatogram shows excellent and clean separations of these six aminoglycosides, the SIR provided much cleaner peak profiles. SIR is also significantly more sensitive due to the much lower background signal which contributes to better signal/noise ratio. It should be mentioned here that buffer concentration was adjusted from 20 mM ammonium formate to 8 mM to get better sensitivity for all analytes and the pH of the aqueous mobile phase was also lowered to 3.0 using formic acid.
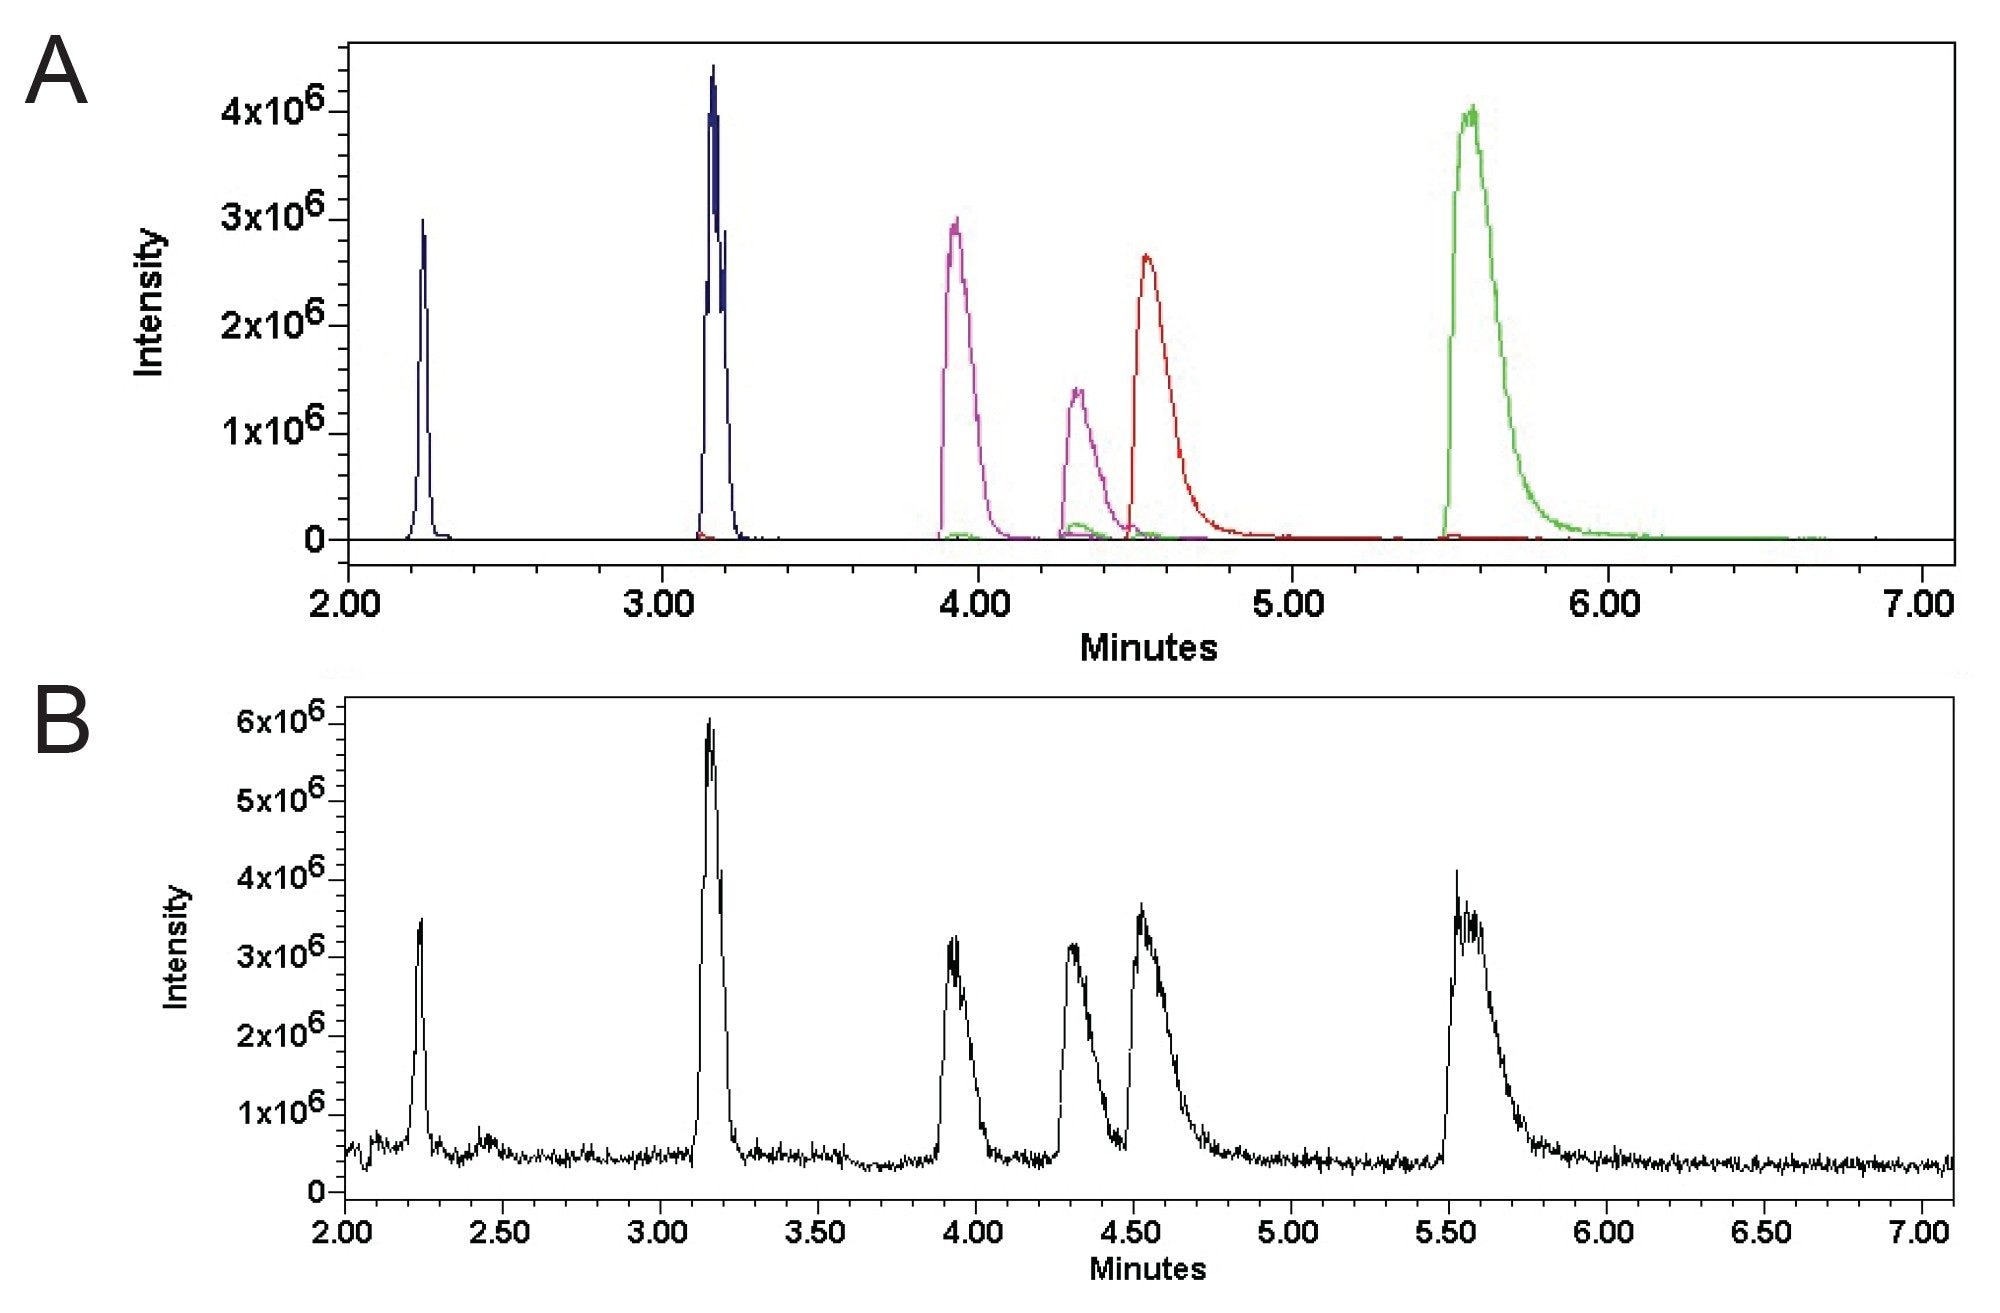 Figure 3A. The QDa based analysis of aminoglycosides: A represents an overlay of six individual SIR plots of a mixture of six aminoglycosides and,
Figure 3B. Represents the TIC chromatogram of the same mixture of these 6 aminoglycosides. The peaks in the chromatogram according to elution order are: Spectinomycin, Streptomycin, Amikacin, Kanamycin, and Sisomycin.
To further facilitate the application of QDa based LC methods in QC environments, it was important to evaluate the ability of the method to quantify aminoglycosides. To do this, the linearity, the Limit of Detection (LOD), and the Limit of Quantification (LOQ) were all assessed for the developed method. The linearity of the method for the quantification of the six aminoglycosides was evaluated over eight concentrations ranging from 0.5–250 µg/mL. The R2 of the calibration curves for all analytes were above 0.99, demonstrating a good fit of the linear regression. The LOQ and LOD were calculated based on signal/noise ratios of three and ten respectively. Table 2 summarizes the figures of merit for the developed method.
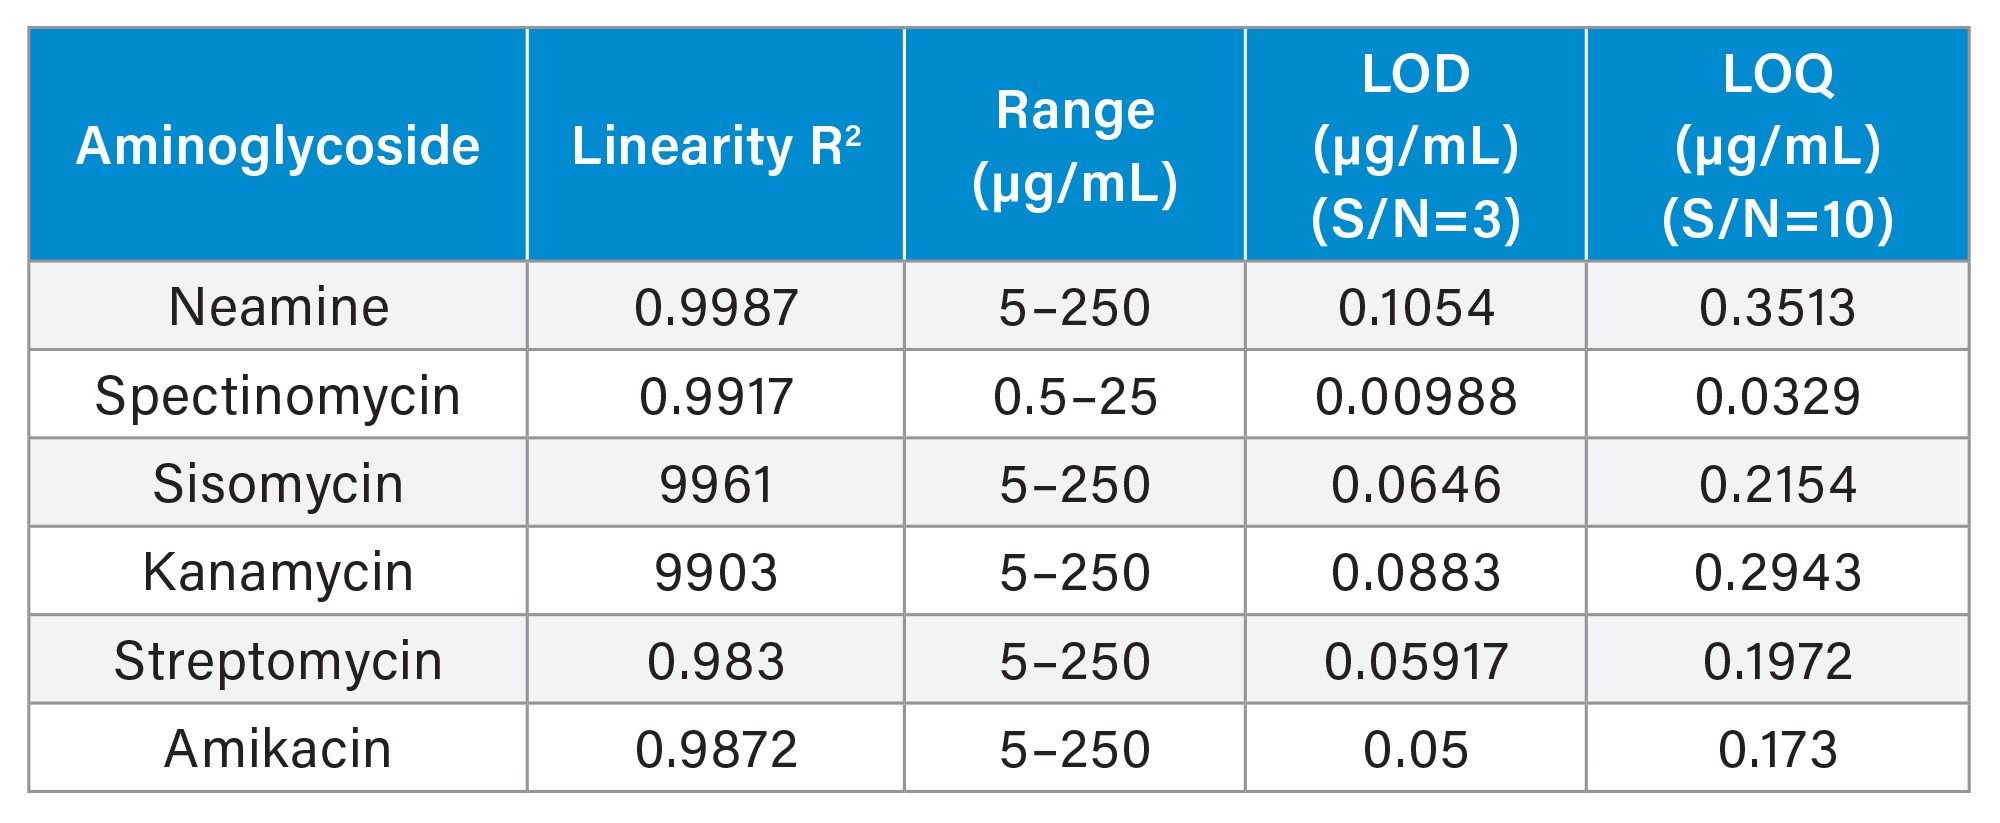 Table 2. Summary of results for Linearity, range, Limit of Detection (LOD), and Limit of Quantification (LOQ) instrument.
Conclusion
- Simple and rapid QDa based method for the analysis of aminoglycosides.3
- Atlantis Premier BEH Z-HILIC Column showed excellent separations and retention of highly polar aminoglycosides.
- Simultaneous analysis of various aminoglycosides using a single LC-MS method.2
- The SIR function of the QDa allowed for accurate and sensitive quantification of aminoglycosides.
References
- T. Hermann, Aminoglycoside antibiotics: Old Drugs and New Therapeutic Approaches, Cellular and Molecular Life Sciences 64(14) (2007) 1841–1852.
- J.E. Davies, Aminoglycosides: Ancient and Modern, J. Antibiot. 59(9) (2006) 529–532.
- R.R. Bailey, The Aminoglycosides, Drugs 22(4) (1981) 321–7.
- L. Šoltés, Aminoglycoside Antibiotics—Two Decades of Their Hplc Bioanalysis, Biomed. Chromatogr. 13(1) (1999) 3–10.
- S. Joshi, HPLC Separation of Antibiotics Present in Formulated and Unformulated Samples, J. Pharm. Biomed. Anal. 28(5) (2002) 795–809.
- C. Díez, D. Guillarme, A.S. Spörri, E. Cognard, D. Ortelli, P. Edder, S. Rudaz, Aminoglycoside Analysis in Food of Animal Origin With a Zwitterionic Stationary Phase and Liquid Chromatography–Tandem Mass Spectrometry, Anal. Chim. Acta 882 (2015) 127–139.
- J. Yang.P.D. Rainville, Analysis of Aminoglycosides in Foods Using a Zwitterionic Stationary Phase and Liquid Chromatography-Tandem Mass Spectrometry, 2021. Waters Application Note, 720007442.
720007558, March 2022