Sensitivity and Linear Dynamic Range of the Xevo™ G3 QTof
This is an Application Brief and does not contain a detailed Experimental section.
Abstract
Demonstrating a high dynamic range for the rapid, accurate screening of compounds utilizing the Waters Xevo™ G3 QTof. Here we show that the Xevo G3 QTof Mass Spectrometer can deliver a wide dynamic range of up to 5 orders of magnitude. This analysis was performed with a set of standards, compiled of the natural active ingredients found within Camelia Sinensis (Green Tea) products, these are caffeine and various catechin compounds. This compact, benchtop quadrupole time-of-flight mass spectrometer not only provides an excellent dynamic range but is also coupled with 30,000 FWHM mass resolution and a high mass accuracy typically within 2 ppm for small molecule applications.
Benefits
Introduction
When characterizing a complex matrix or analyzing a cohort of samples containing an unknown or varying level of concentration for the analyte of interest, it is imperative that the mass spectrometer is able to deliver a wide dynamic range for those analytes. A wide dynamic range will reduce the possibility that selected samples will require preparation alteration and re-injection due to the compound of interest falling outside of the calibration curve or limits of the detector.
With increased sensitivity on any mass spectrometer the ability to detect compounds at lower levels is achieved, whilst this is a positive for low level analytes, it can be problematic for more abundant compounds. When sensitivity is increased, the upper limit of quantification may be impacted as the detector can saturate and no longer generate a linear response. By increasing the dynamic range of the instrument the lower limit of detection is improved, allowing for the detection of lower-level analytes, and the upper limit of detection is maintained, allowing for the accurate quantification of higher-level analytes. A wide dynamic range means an individual sample with compounds of greatly varied concentration can be analyzed with a single injection and a high percentage of those analytes will fall within the dynamic range of the instrument.
Results and Discussion
The system linear dynamic range was tested to ensure data confidence at typical analysis levels and to demonstrate a linear response for quantification purposes. This assay was performed using a commercially available 100 µg/mL Green Tea catechin mix standard (cat# G-016) purchased from Sigma (Dorset, UK). The standard curve was prepared diluting this standard with a 25:75 (v:v) methanol:water solvent prior to injection onto the system. For the linearity and sensitivity assessment, a dilution series with five orders of magnitude was prepared ranging from 0.001 µg/mL to 100 µg/mL. Injecting 1 µL of each point resulted in a range of 1 pg to 100 ng loading of each analyte on-column. For experimental details please see application note: 720008031.
Using an ACQUITY™ Premier UPLC™ Chromatography System and a Xevo G3 QTof Mass Spectrometer, a 1 µL injection of each catechin standard dilution was analysedanalyzed in positive ionisation mode and data collected using an MSE continuum acquisition method.
The linear dynamic range achieved for the green tea active compounds over the concentrations prepared varied between 5 and 3 orders of magnitude Figure 1. The variation seen is a result of the lower limit of detection (LLOD) for each analyte, this variance did not appear to be due to intensity of each individual analyte but rather due to the slope of the linear regression. The signal for some of the compounds appears to deplete at a much more rapid rate than others (Figure 2). These dynamic ranges are also achieved without system saturation, therefore there is potentially scope for additional linear range from those quoted here (Figure 3).
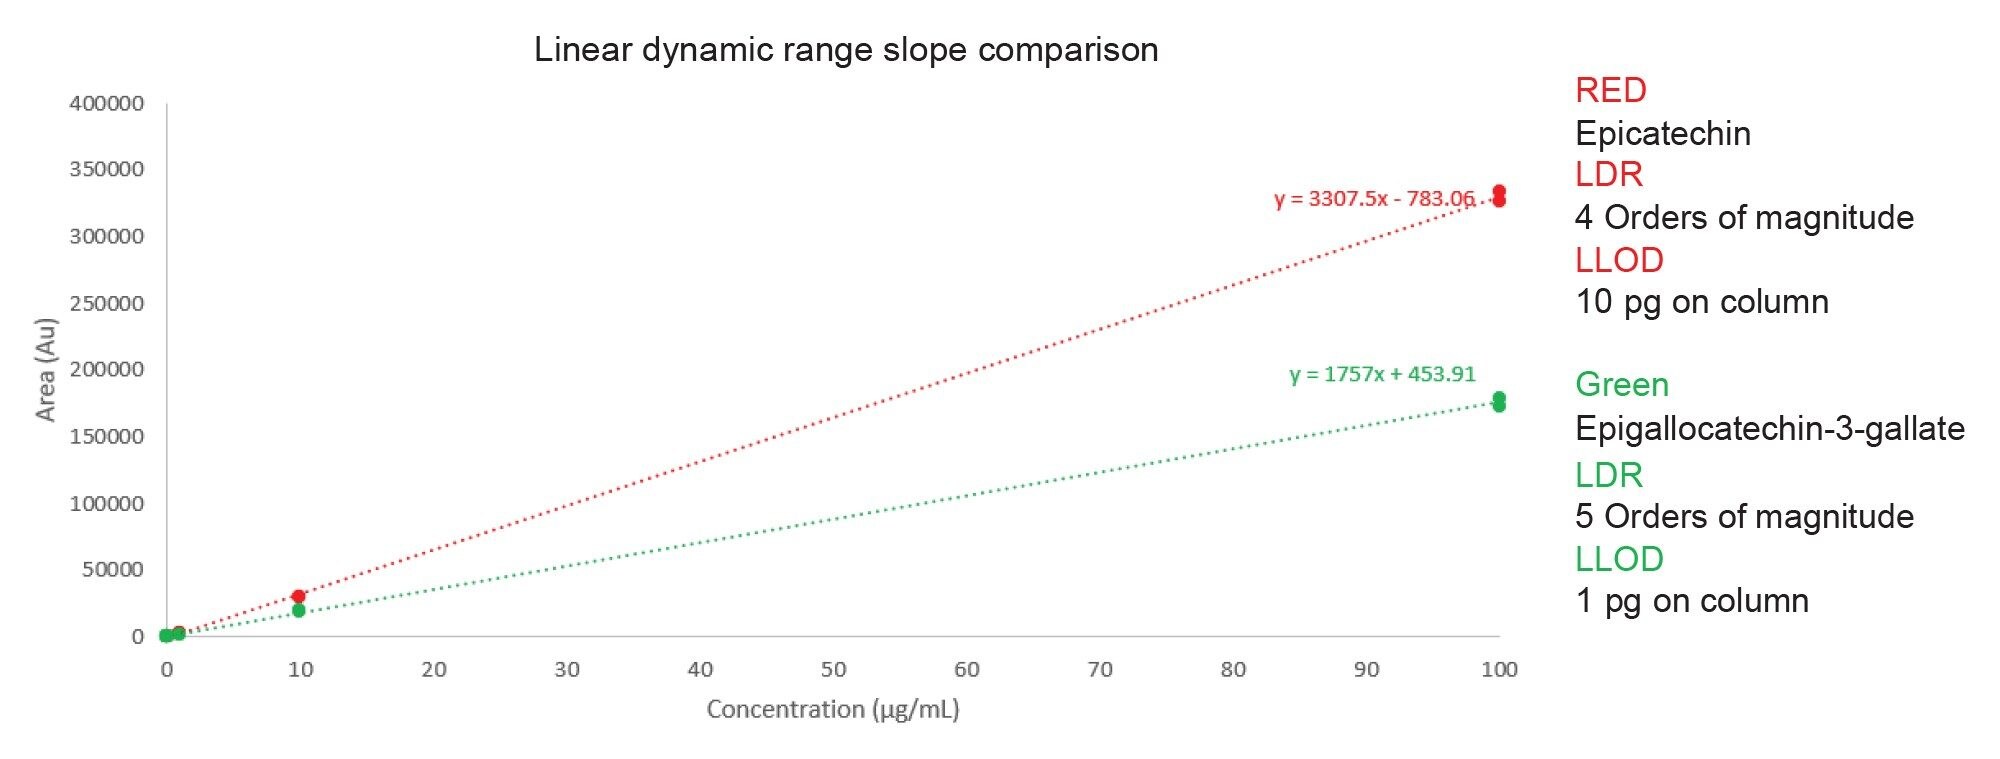 Figure 1. Graph of linear dynamic range (LDR) demonstrating the varying slope equations for two standards (epicatechin and epigallocatechin-3-gallate).
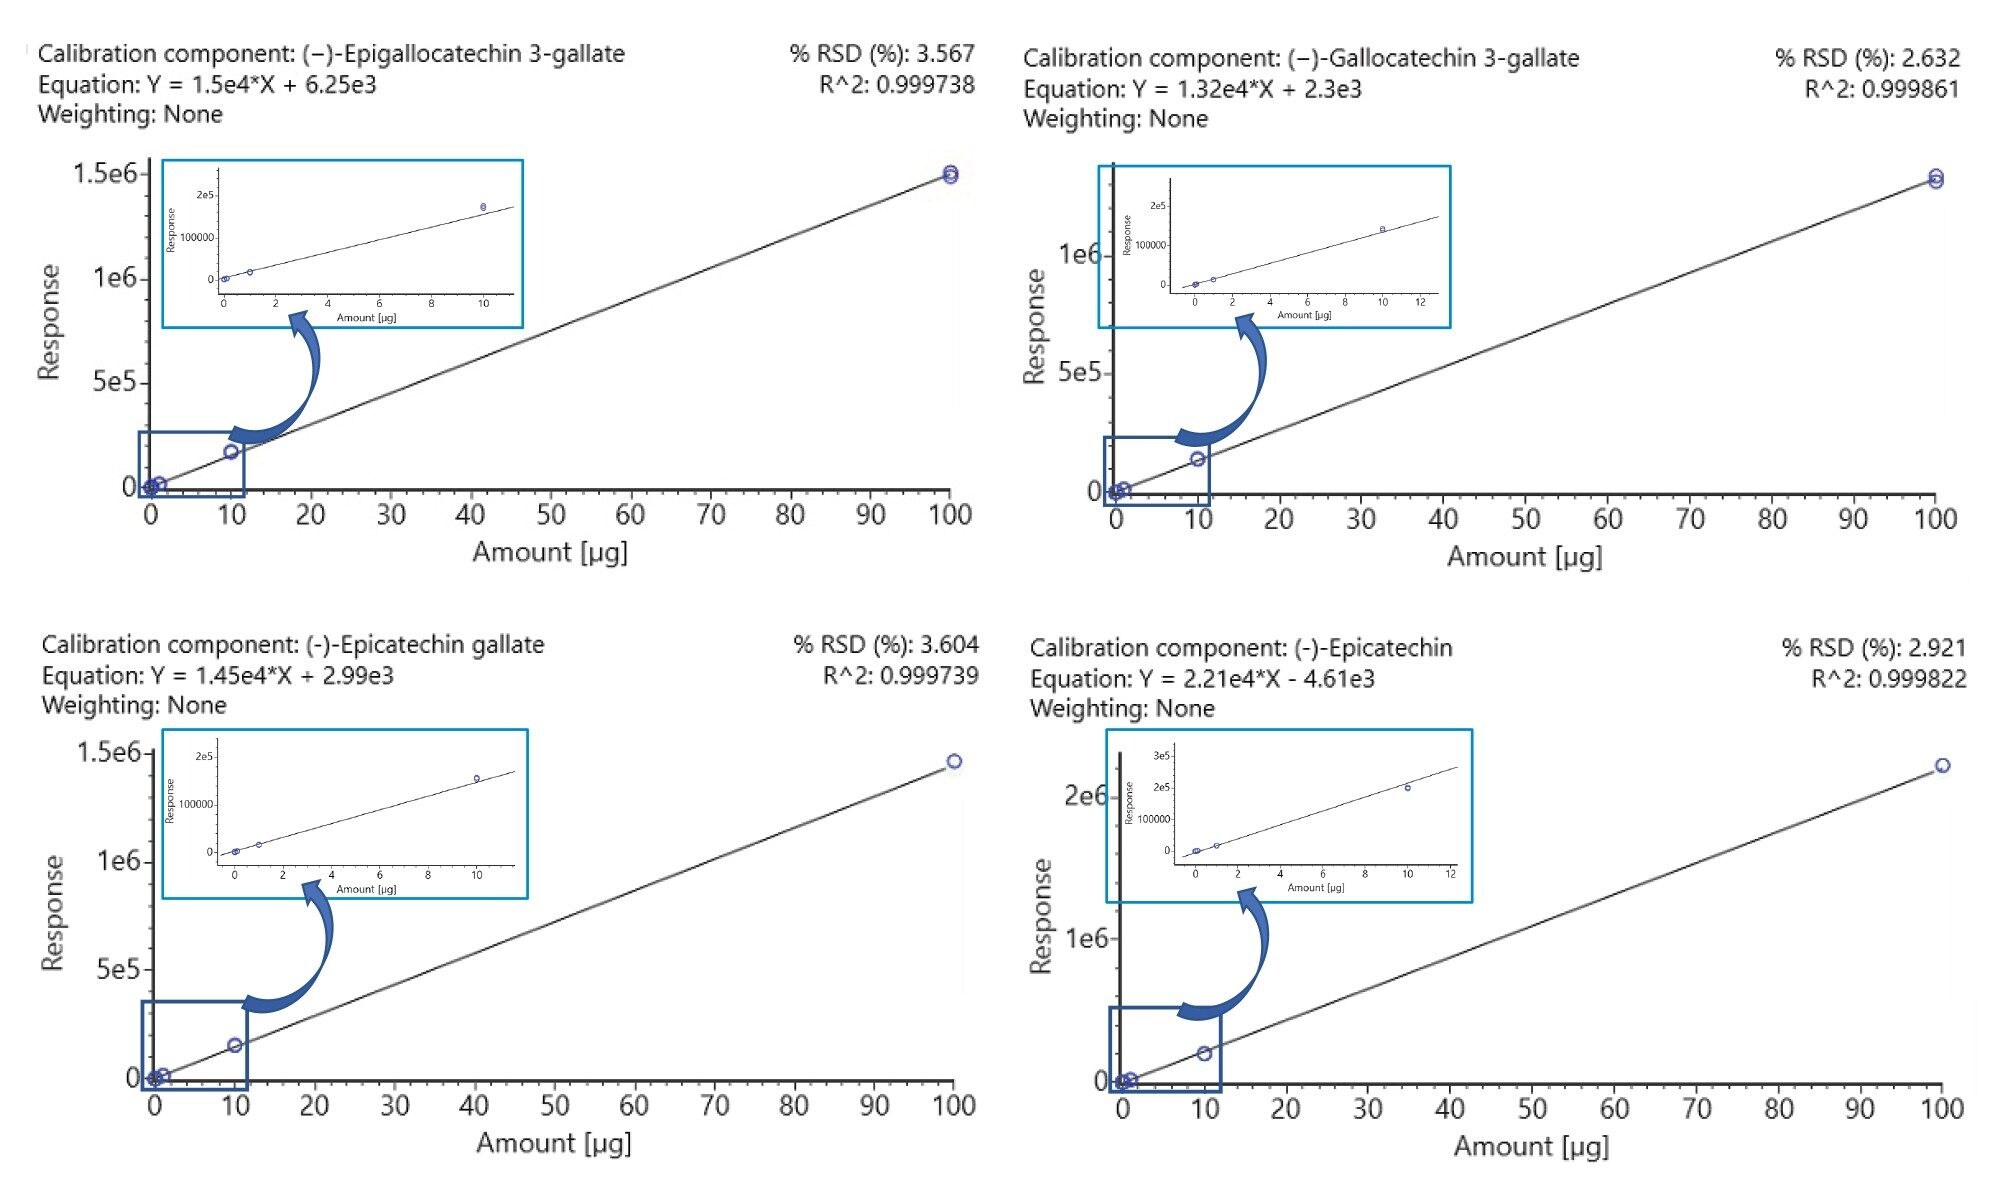 Figure 2. Concentration curves of four Green Tea active ingredients, demonstrating the linear dynamic range of the Xevo G3 QTof. A) Epigallocatechin-3-gallate, B) Gallocatechin-3-gallate, C) Epicatechin gallate, D) Epichatechin.
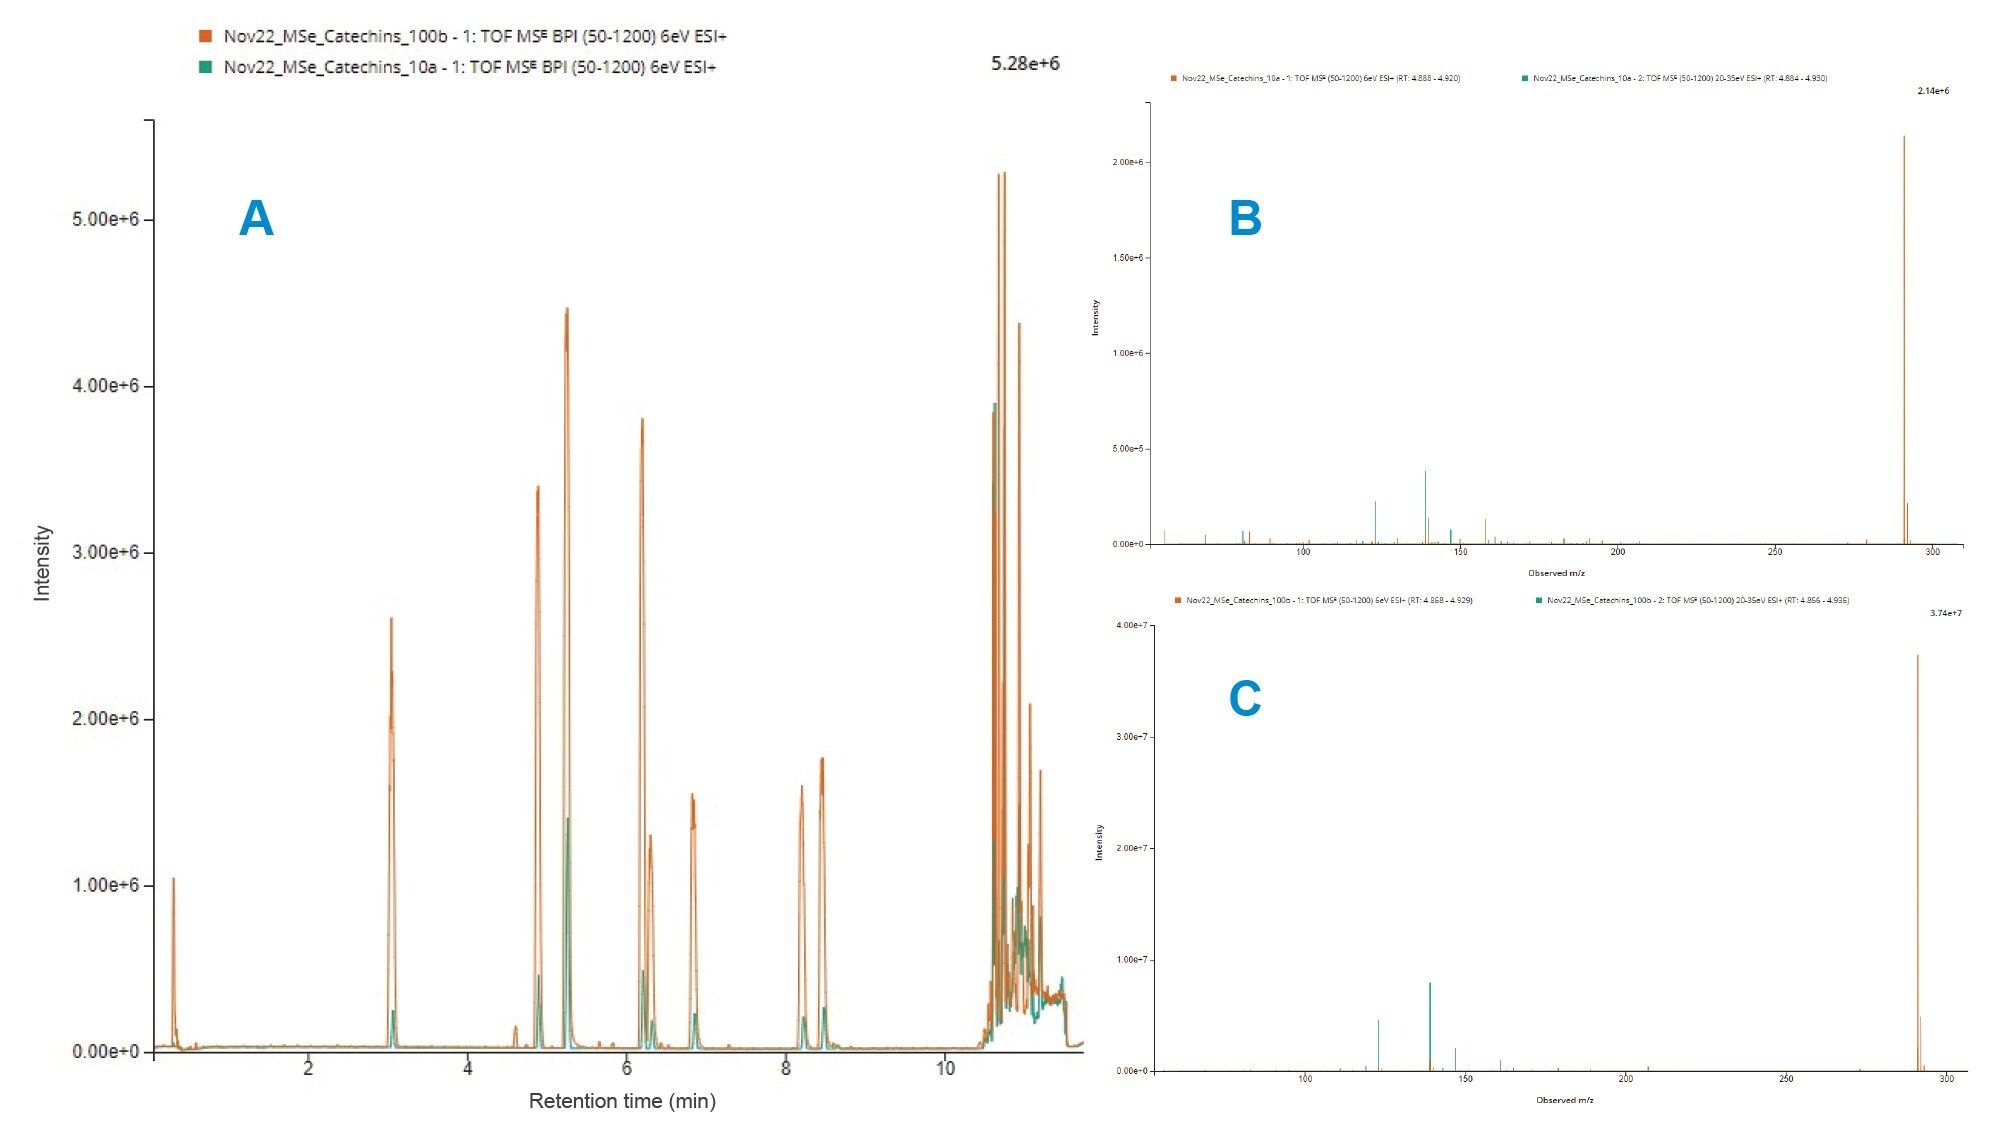 Figure 3. Chromatographic and spectral quality for both the 50 ng and 100 ng column loadings. Demonstrating overlaid BPI (A) and extracted low energy spectra and high energy spectra (B+C), for catechin (B) 50 ng column loading, (C) 100 ng column loading).
The top point for the calibration curve is the typical standard acquisition level (100 ng on-column) the instrument produced narrow gaussian chromatographic peaks and spectra at this concentration within the linear range, with none of the compounds overloading the system (chromatography or detector). All the linearity curves produced, showed a linear response up to this upper calibration point. Using the pure standard with a 1 µL injection volume, this was maintained as the upper point for the curve, as analyses on historic systems suggest that >250 ng on column (for these particular standards) is known to saturate the chromatography with peak shape and therefore separation becomes poor.
The LLOD was determined as the concentration for which there was a visible peak on the chromatogram with a signal to noise ratio (S/N) >3. An example is provided in Figure 4 using Skyline (MacCoss Lab, University of Washington), which shows the LLOD extracted chromatogram (XIC) for epigallocatechin-3-gallate. The lowest S/N value included within the dataset is 7.0, which is observed for the 5 pg on-column loading of caffeine.
 Figure 4. Skyline view of epigallocatechin-3-gallate showing XIC of LLOD (A), overview of peak areas (B), and retention time (C) seen for both precursor and product ions and a response curve for the compound (D).
Conclusion
This application demonstrates that the Xevo G3 QTof Mass Spectrometer can deliver 5 orders of linear dynamic range. For the green tea active compounds, the measured LLOD for the Xevo G3 QTof was between 1 pg–10 pg on-column (i.e., 1 µL injection of a 1–10 ng/mL concentration standard), determined by a visible peak with a calculated S/N >3. Both the ACQUITY Premier Chromatography System and Xevo G3 QTof Mass Spectrometer comfortably produced excellent data quality at the 100 ng on-column calibration point (i.e., a 1 µL injection of a 100 µg/mL concentration standard).
720008043, September 2023