• Applikationsbericht

Peptide Mapping and Small Protein Separations with Charged Surface Hybrid (CSH) C18 and TFA-Free Mobile Phases

Peptide Mapping and Small Protein Separations with Charged Surface Hybrid (CSH) C18 and TFA-Free Mobile Phases

  • Matthew A. Lauber
  • Stephan M. Koza
  • Kenneth J. Fountain
  • Waters Corporation

Abstract

This Application note demonstrates the use of CSH130 C18 with FA mobile phases to study peptide mapping and small protein separations.

Benefits

  • Greater peak capacity and unique selectivity compared to other C18 columns
  • Compatibility with formic acid and ESI-MS
  • High resolution separations of species up to approximately 10 kDa
  • CSH130 C18 is QC tested with a tryptic digest of cytochrome c

Introduction

Peptide mapping of a biopharmaceutical, when employed for quality control, has traditionally involved detection by UV absorbance. However, to characterize the species in a peptide map, LC separations often must be coupled with ESI-MS. Mobile phases containing trifluoroacetic acid (TFA) have been almost exclusively used for peptide mapping, likely because the performance of many C18 columns is highly dependent on strong ion pairing agents to improve peak shape. For LC-MS applications, it is desirable to avoid strong ion pairing agents such as TFA due to ion suppression, which can be more than an order of magnitude in MS intensity.1-3 Weaker acid modifiers with reduced ion pairing properties, such as formic acid (FA), are preferred for LC-MS as they permit more sensitive detection.4-5

In a separate application note,6 the performance of columns packed with a novel C18 stationary phase containing a low level positive charge was compared to existing state-of-the-art peptide analysis columns. Using a nine-peptide mixture, it was demonstrated that the charged surface hybrid (CSH) C18 stationary phase offers greater peak capacity and, unlike most column chemistries, minimal dependence on strong ion pairing agents to obtain optimal peak capacity. This attribute suggests it is ideal for LC applications that require characterization using mass spectrometry.

In this study, the use of CSH130 C18 with FA mobile phases is further investigated with the analysis of more demanding separations. LC-MS of an enolase tryptic digest is compared among a CSH130 C18, BEH130 C18, and a superficially porous C18 column. In addition, the applicability of these columns for separations of polypeptides up to 12 kDa is evaluated.

Experimental

LC conditions

System:

Waters ACQUITY UPLC H-Class Bio System with a 20 cm Column Heater

Detection:

ACQUITY UPLC TUV Detector with 500 nL Analytical Flow Cell

Xevo G2 Q-Tof Mass Spectrometer

(Only MS detection employed for peptide mapping. Both UV and MS detection used for analyses of the large peptides/small proteins.)

Wavelength:

214 nm

Scan rate:

10 Hz

Columns:

C18, 2.1 x 150 mm, 1.7 μm, superficially porous (1.25 μm core, 0.22 μm shell) 100Å (competitor product)

ACQUITY UPLC BEH130 C18 2.1 x 150 mm, 1.7 μm, porous, 130Å (p/n 186003556)

ACQUITY UPLC BEH300 C18 2.1 x 150 mm, 1.7 μm, porous, 300Å (p/n 186003687)

ACQUITY UPLC CSH130 C18 2.1 x 150 mm, 1.7 μm, porous, 130Å (p/n 186006938)

Column temp.:

40 °C

Sample temp.:

10 °C

Injection volume:

10 μL for enolase digest 1 μL for large peptide/ small protein mixture

Flow rate:

0.3 mL/min

Mobile phases:

A: 0.1% FA (v/v) in water

B: 0.1% FA (v/v) in acetonitrile

C: 0.1% TFA (v/v) in water

D: 0.1% TFA (v/v) in acetonitrile

Vials:

LCGC Certified Clear Glass 12 x 32 mm Screw Neck Qsert Vial (p/n 186001126C)

Gradient for 0.1% FA:

Time(min)

%A

%B

%C

%D

0

98.0

2.0

0.0

0.0

1

98.0

2.0

0.0

0.0

61

50.0

50.0

0.0

0.0

Gradient for 0.1% TFA (only used for comparison in Figure 1):

Time(min)

%A

%B

%C

%D

0

0.0

0.0

98.0

2.0

1

0.0

0.0

98.0

2.0

61

0.0

0.0

50.0

50.0

MS conditions

Mass spectrometer:

Xevo G2 Q-Tof

Ionization mode:

ESI+

Analyzer mode:

Resolution

Scan rate:

10 Hz

Capillary voltage:

3.00 kV

Cone voltage:

25 V

Source temp.:

120 °C

Desolvation temp.:

350 °C

Cone gas flow:

0.0 L/h

Desolvation gas flow:

800 L/h

Calibration:

NaI 2 μg/μL from 50 to 2000 m/z

Acquisition:

50 to 1990 m/z, 10 Hz scan rate

Data management:

MassLynx Software

Sample description

Waters MassPREP Enolase Digestion Standard (p/n 186002325) was reconstituted with 0.1% FA in water to a total peptide concentration of ca. 0.05 mM. Large peptides and small proteins obtained from Sigma were reconstituted with 0.1% FA in water, and combined into a mixture containing 1 mg/mL of each component.

Calculations:

The following tryptic peptides from enolase were used to evaluate separation performance: T6, T10, T14, T23, T27, T35, T37, T38, T40, T42, T45, and T51. Their peak widths at half-height (wh) were measured from extracted ion chromatograms (XICs), averaged, then used to calculate peak capacity according to the following equation:

Results and Discussion

Peptide mapping

Reversed phase peptide separations are routinely employed in analyses of proteolyzed proteins, as in peptide mapping experiments. The utility of a C18 column for peptide separations is best evaluated through the analysis of a digestion standard, such as a tryptic digest of enolase. Using such a sample, the performance of an ACQUITY UPLC CSH130 C18, 1.7 µm column was assessed for LC-MS-based peptide mapping. Figure 1 shows total ion chromatograms of enolase tryptic peptides obtained with mobile phases containing either FA (blue trace) or TFA (orange trace). The deleterious effect of TFA on MS sensitivity is readily apparent. The use of TFA rather than FA as the modifier in this LC-MS analysis resulted in an order of magnitude drop in MS sensitivity. 

Previous work with a nine-peptide mixture demonstrated that the performance of CSH130 C18 for peptide separations exhibits little to no dependence on strong ion pairing agents, such as TFA. Peptide peak shapes were found to be excellent with either FA- or TFA-containing mobile phases.6 The most profound consequence of this is that CSH130 C18 is capable of producing high peak capacity peptide mapping separations even under MS-friendly conditions. To illustrate this point, we measured the peak capacity for the enolase peptide map that was obtained with the FA mobile phase (see experimental for calculation). The 12 peptides labeled in Figure 1, with their wide ranging retention times, were selected to calculate the peak capacity of the separation. 

Figure 1. LC-MS of an enolase tryptic digest using a CSH130 C18 , 1.7 µm column. Total ion chromatograms obtained with mobile phases containing either 0.1% FA or 0.1% TFA are shown in blue and orange, respectively. Both chromatograms are displayed on the same scale. Peptides used in the calculation of peak capacity are labeled.

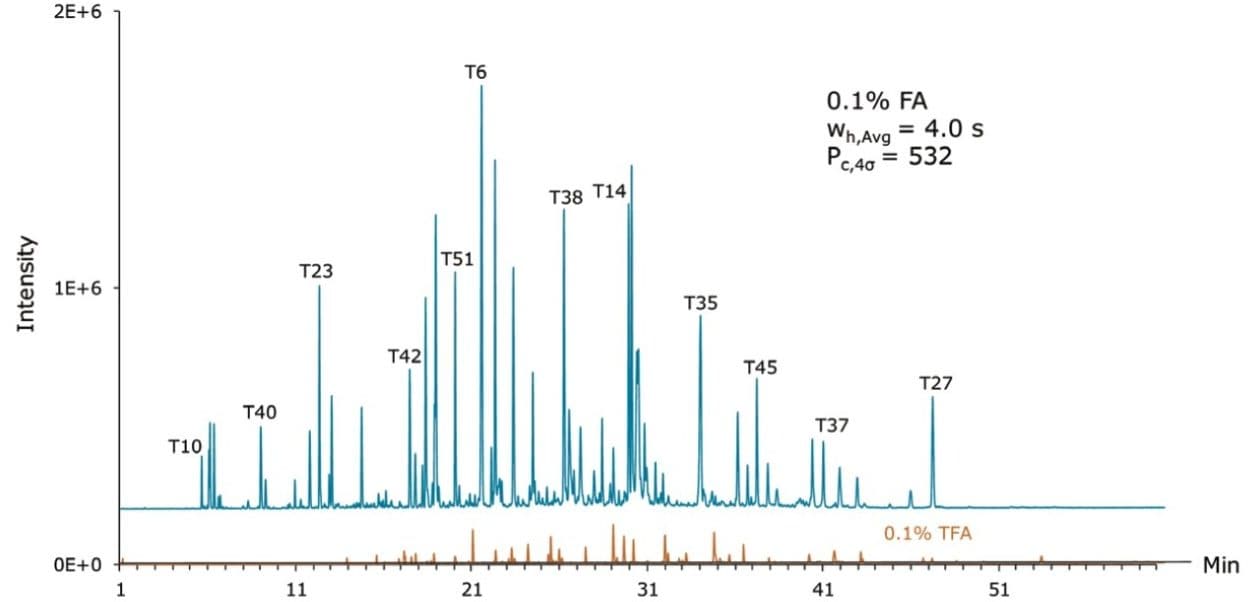
Based on these measurements, the CSH130 C18, 1.7 µm column produced a peak capacity of 532, which is remarkably high for an LC-MS platform amenable to routine work. To provide perspective, the enolase digest was likewise analyzed by LC-MS using two 1.7 µm C18 columns that do not have a low level positive charge applied to the particle surface, as shown in Figure 2. The fully porous BEH130 C18, 1.7 µm column produced a peak capacity of 399, and the superficially porous C18, 1.7 µm column produced a similar peak capacity of 405. The novel CSH130 C18 stationary phase, thus, yielded a significant performance advantage for this application with 30% greater peak capacity.

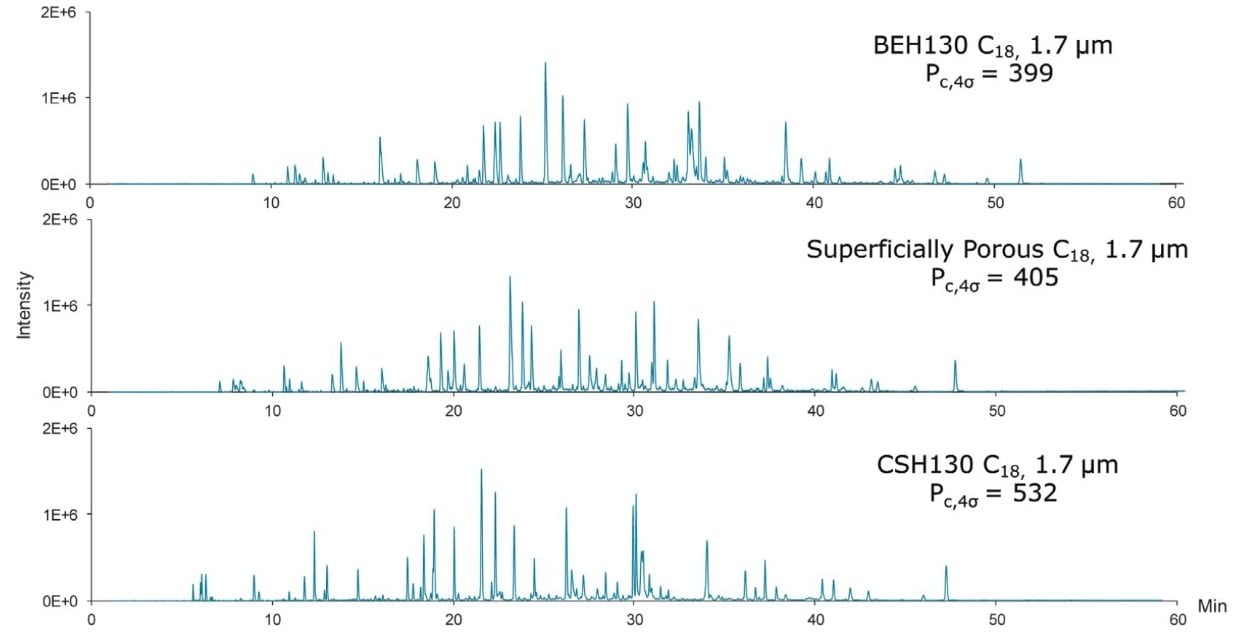
The retentivity and selectivity of peptides also varied between the three columns shown in Figure 2. An early time segment of the enolase peptide maps capturing this observation is shown in Figure 3. Peaks corresponding to six different peptides are labeled. The most immediate observations resulting from this comparison include: 1) CSH130 C18 provides better peak shape; and 2) CSH130 C18 is slightly less retentive than the other stationary phases. Elution of the labeled peptides from the CSH130 C18 column occurred approximately 5 min earlier compared to the BEH130 C18 column and approximately 2 min earlier compared to the superficially porous C18 column. In terms of elution strength, these are differences estimated at 4% and 2% acetonitrile, respectively. A more detailed analysis of these chromatograms shows the unique selectivity of the CSH130 C18 column. Elution order of the peptides changes quite dramatically when changing from the BEH130 C18 to CSH130 C18 column. Peptides with the largest selectivity differences in this chromatographic window appear to be peptides T10 and T19. Most tryptic peptides, such as T3, T5, T12, and T40, contain only two basic moieties, one N-terminus and one C-terminal lysine or arginine residue. Peptides T10 and T19, in contrast, also contain basic histidine residues, causing them to have an additional positive charge. This is most likely the reason for their relatively larger shift in retention time. The retention of peptides on CSH130 C18, therefore, seems to be influenced by their charge (or possibly their charge density), which in turn has an effect on selectivity. This suggests it is advantageous to screen both BEH130 C18 and CSH130 C18 columns when developing challenging peptide maps, particularly when aiming to separate critical pairs of peptides.

Figure 2. Total ion chromatograms of an enolase tryptic digest obtained with 0.1% FA mobile phases and three different columns.
Figure 3. Expanded view of an early retention window from the enolase peptide maps shown in Figure 2 highlighting differences in retentivity and selectivity. Six different peptides were tracked across chromatograms obtained with three different columns. The sequences of these peptides are provided in the table on the top panel.

Analysis of large peptides and small proteins

There are many variables encountered when choosing an optimal column chemistry for a given peptide separation. The aforementioned work has shown a pronounced effect for surface charge. Another variable is pore size. Based on these results, CSH130 C18 is very effective at separating tryptic peptides. It was of interest, nevertheless, to evaluate the use of CSH130 C18, even with its 130Å pores, for separations of larger peptides and small proteins. 

Six polypeptides ranging in mass from 1 to 12 kDa were separated on four columns containing stationary phases with pores varying from 100 to 300Å in diameter, as shown in Figure 4. By comparing these chromatograms, it is clear that the CSH130 C18 column produced the best peak shapes for most of the peptide species, including insulin (5.8 kDa). As a result, CSH130 C18 has already become a stationary phase of choice for the bioanalysis of therapeutic insulin analogs.7

Figure 4. Chromatograms of large peptides/small proteins obtained with 0.1% FA mobile phases and four different columns. Peaks were identified by ESI-MS. 

Analysis of the largest polypeptides, ubiquitin (8.6 kDa) and cytochrome c (12.4 kDa), better defined the effect of using 300Å versus 130Å pore size sorbents. Ubiquitin was found to exhibit only slightly better peak shape on the BEH300 C18 (300Å) column versus both the CSH130 C18 (130Å) and BEH130 C18 (130Å) columns. In contrast, the largest polypeptide, cytochrome c, was separated with markedly better peak shape using BEH300 C18. The BEH300 C18 column was actually capable of resolving cytochrome c into multiple peaks, indicating protein heterogeneity. Most peptide separations, such as those derived from proteolytic digests, will contain few, if any, species this large. For this reason, the use of a 130Å pore size particle, like CSH130 C18, may impact the separation of a protein digest more positively than the use of a larger pore size particle, since it will offer more surface area and likely greater retention of small, hydrophilic peptides. A larger pore size particle, like 300Å pore size C18, may be preferred when primarily analyzing large peptides, for example, those weighing more than 6 kDa. Such an analysis might involve the study of disulfide-linked peptides from a Lys-C digest of an IgG when it may not be crucial to retain or separate efficiently smaller non-linked peptides. It is also worth noting that different pore sizes can sometimes be used to alter the selectivity in a peptide map.8 

The 100Å pore size superficially porous column was capable of separating the smallest peptides with peak widths and shapes comparable to the BEH C18 columns. However, peak shapes for the largest peptides (3 to 12 kDa) were noticeably worse. In addition, this column did not resolve the three largest polypeptides. These data suggest that the superficially porous C18 column is limited to the analysis of smaller peptides, whereas the CSH130 and BEH130/300 C18 can separate a wider range of peptides and small proteins.

Conclusion

Peptide mapping with FA instead of TFA facilitates more sensitive detection using ESI-MS. As a result, CSH130 C18 is ideal for LC-MS-based peptide mapping because its performance is  excellent with either acid modifier. For an LC-MS analysis of  tryptic peptides from enolase with FA mobile phases, a CSH130 C18, 1.7 µm column provided 30% greater peak capacity than fully porous or superficially porous conventional C18 columns with equivalent particle size. Moreover, the analysis of enolase tryptic peptides demonstrated that CSH130 C18 provides unique selectivity in separating peptides. Consequently, CSH130 C18 should be screened along with conventional C18 when developing a peptide map. In addition to offering greater peak capacity, this may give the desired selectivity for critical pairs of peptides. Finally, through analysis of both large peptides and small proteins, it was established that a CSH130 C18 column, even with its 130Å pore size sorbent, is well suited to separating polypeptides up to at least 10 kDa.

References

  1. Kuhlmann FE, Apffel A, Fischer S, Goldberg G, Goodley PC. Enhanced sensitivity for peptide mapping with electrospray liquid chromatography-mass spectrometry in the presence of signal suppression due to trifluoroacetic acid-containing mobile phases. J Am Soc Mass Spectrom. 1995; 6 (12): 1221-1225.
  2. Apffel A, Fischer S, Goldberg G, Goodley PC, Kuhlmann FE. Enhanced sensitivity for peptide mapping with electrospray liquid chromatography-mass spectrometry in the presence of signal suppression due to trifluoroacetic acid-containing mobile phases. J Chromatogr A. 1995; 712 (1): 177-90.
  3. Chakraborty AB, Berger SJ. Optimization of reversed-phase peptide liquid chromatography ultraviolet mass spectrometry analyses using an automated blending methodology. J Biomol Tech. 2005; 16(4): 327-35.
  4. Annesley TM. Ion suppression in mass spectrometry. Clin Chem. 2003; 49(7): 1041-4.
  5. Temesi D, Law B. LC-GC Int. 1999; 17: 626-32.
  6. Lauber MA, Koza S, Fountain KJ. Increasing Peak Capacity in Reversed-phase Peptide Separations with Charged Surface Hybrid (CSH) C18 Columns. Waters Application Note 720004568EN. 2013 Jan.
  7. Chambers EE, Legido-Quigley C, Smith N, Fountain KJ. Development of a fast method for direct analysis of intact synthetic insulins in human plasma: the large peptide challenge. Bioanalysis. 2013; 5 (1).
  8. Gillece-Castro BL, Wheat TE, Mazzeo JR. Waters Application Note 720001792EN. 2011 July.

720004571, January 2013

Zurück zum Seitenanfang Zurück zum Seitenanfang