• Applikationsbericht

Automated Analytical Cation-Exchange Chromatography Fraction Collection and Structural Characterization of Monoclonal Antibody Charge Variants

Automated Analytical Cation-Exchange Chromatography Fraction Collection and Structural Characterization of Monoclonal Antibody Charge Variants

  • Hua Yang
  • Stephan M. Koza
  • Waters Corporation

Abstract

In this application note, infliximab and trastuzumab were separated on a BioResolve SCX mAb Column, and their charge variant fractions were collected using a Waters Fraction Manager-Analytical (WFM-A). The fractions were further analyzed by LC-MS, including intact mass analysis, subunit analysis, and peptide mapping analysis.

Benefits

  • Cation-exchange separation on BioResolve SCX mAb Columns
  • Cation-exchange fractions collected by Waters Fraction Manager-Analytical (WFM-A)
  • Cation-exchange fractions analyzed by LC-MS (intact mass, subunit, and peptide mapping)

Introduction

Charge variant levels in therapeutic proteins, including monoclonal antibodies (mAbs), are often considered to be critical quality attributes (CQAs), since they can potentially affect biological activity and safety of the biotherapeutics.1 One of the commonly used techniques for the purification, characterization, and routine monitoring of protein charge variants is ion-exchange chromatography (IEX). Being a non-denaturing technique, IEX has advantages over electrophoretic techniques, such as CE and cIEF, in that not only can charge variants be collected by IEX separations in order to determine identity, but also that structure-function information can be obtained using additional technologies.

In this application note, infliximab and trastuzumab were separated on a BioResolve SCX mAb Column, and their charge variant fractions were collected using a Waters Fraction Manager-Analytical (WFM-A). The fractions were further analyzed by LC-MS, including intact mass analysis, subunit analysis, and peptide mapping analysis.

Experimental

Cation-exchange separation and fraction collection

Sample description

Trastuzumab (21 mg/mL) and infliximab (10 mg/mL) were injected directly onto the IEX column without dilution. Drug products were analyzed post expiry.

LC conditions

System:

ACQUITY UPLC H-Class Bio

Additional

component:

Waters Fraction Manager-Analytical

(WFM-A)

Sample temp.:

10 °C

Analytical

column temp.:

30 °C

Flow rate:

0.8 mL/min

Injection volume:

1–50 μL

Column:

BioResolve SCX mAb, 3 μm,

4.6 × 50 mm

BioResolve SCX mAb, 3 μm,

4.6 × 100 mm

Detection:

ACQUITY UPLC TUV Detector

with 5 mm titanium flow cell, 280 nm

Sample vials:

LCGC Certified Clear Glass 12 × 32 mm

Screw Neck Total Recovery, with Cap

and Pre-slit PTFE/Silicone Septa, 1 mL

Volume, 100/pk

Auto•Blend Plus method

Mobile phase A:

100 mM MES monohydrate

Mobile phase B:

100 mM MES sodium salt

Mobile phase C:

1 M NaCl

Mobile phase D:

Water

For infliximab:

20 mM MES, 10–45 mM NaCl, pH 7.0

for 10 min (for 100 mm length column),

or 5 min (for 50 mm length column)

For trastuzumab:

20 mM MES, 50–85 mM NaCl, pH 6.7

for 10 min (for 100 mm length column),

or 5 min (for 50 mm length column)

Intact mass analysis of IEX fractions

Sample description

The fractions were directly injected onto the column.

LC conditions

System:

ACQUITY UPLC H-Class Bio

Sample temp.:

10 °C

Analytical

column temp.:

80 °C

Flow rate:

0.4 mL/min

Injection volume:

10 μL

Column:

BioResolve RP mAb Polyphenyl,

450 Å, 2.7 μm, 2.1 × 150 mm

Detection:

ACQUITY UPLC TUV Detector with

5 mm titanium flow cell, 214 nm

Xevo G2–XS Mass Spectrometer

Sample vials:

LCGC Certified Clear Glass 12 × 32 mm

Screw Neck Total Recovery Vial, with

Cap and Pre-slit PTFE/Silicone Septa,

1 mL volume, 100/pk

Mobile phase A:

0.1% (v/v) formic acid in water

Mobile phase B:

0.1% (v/v) formic acid in acetonitrile

Time

Flow rate (mL/min)

%A

%B

Curve

0.0

0.4

95

5

0.5

0.4

70

30

6

1.0

0.4

70

30

11

3.5

0.4

60

40

6

4.5

0.4

5

95

6

5.0

0.4

5

95

11

5.1

0.4

95

5

11

10.0

0.0

95

5

11

Subunit analysis of IEX fractions

Sample description

Infliximab fractions were pre-concentrated using 10 kDa molecular weight cutoff (MWCO) regenerated cellulose centrifugal filters. The concentrations of the fractions were in the range of 1.4–2.5 mg/mL. Ten-microgram samples of concentrated infliximab fractions were digested by IdeS enzyme (protein:enzyme ratio = 1:1) for 30 min at 37 °C and 5 μg of the digested fractions was further reduced by DTT for 30 min at 37 °C. All samples were quenched with a final concentration of 3% ACN/0.1% formic acid.

Sample temp.:

10 °C

Analytical

column temp.:

80 °C

Flow rate:

0.8 mL/min

Injection volume:

2 μL for non-reduced samples,

4 μL for reduced samples

Column:

BioResolve RP mAb Polyphenyl,

450 Å, 2.7 μm, 2.1 × 150 mm

Detection:

ACQUITY UPLC TUV Detector

with 5 mm titanium flow cell, 214 nm

Xevo G2–XS Mass Spectrometer

Sample vials:

LCGC Certified Clear Glass 12 x 32 mm

Screw Neck Total Recovery Vial, with

Cap and Pre-slit PTFE/Silicone Septa,

1 mL Volume, 100/pk

Mobile phase A:

0.1% (v/v) formic acid in water

Mobile phase B:

0.1% (v/v) formic acid in acetonitrile

Time

Flow rate

(mL/min)

%A

%B

Curve

0.00

0.4

95

5

0.50

0.4

88

12

6

1.00

0.4

88

12

11

11.00

0.4

58

42

6

12.00

0.4

5

95

6

13.00

0.4

5

95

11

13.10

0.4

95

5

11

20.00

0.0

95

5

11

Peptide mapping analysis of IEX fractions

Sample description

Trastuzumab fractions were pre-concentrated using 10 kDa molecular weight cutoff (MWCO) regenerated cellulose centrifugal filters. The concentrations of the factions were in the range of 3.1–4.2 mg/mL. Fifty-microgram samples of concentrated trastuzumab fractions were digested by trypsin (protein:enzyme ratio = 25:1) and Lys-C (protein:enzyme ratio = 25:1) at pH 6.0 overnight at 37 °C.
The samples were quenched with formic acid.

Sample temp.:

10 °C

Analytical

column temp.:

60 °C

Flow rate:

0.2 mL/min

Injection volume:

10 μL

Column:

ACQUITY UPLC Peptide BEH C18,

300 Å, 1.7 μm, 2.1 × 150 mm

Detection:

ACQUITY UPLC TUV Detector

with 5 mm titanium flow cell, 214 nm

Xevo G2-XS Mass Spectrometer

Sample vials:

LCGC Certified Clear Glass 12 × 32 mm

Screw Neck Total Recovery Vial, with

Cap and Preslit PTFE/Silicone Septa,

1 mL volume, 100/pk

Mobile phase A:

0.1% (v/v) formic acid in water

Mobile phase B:

0.1% (v/v) formic acid in acetonitrile

Time

Flow rate (mL/min)

%A

%B

Curve

0.0

0.2

98

2

10.0

0.2

98

2

11

70.0

0.2

50

50

6

72.0

0.2

5

95

6

72.1

0.2

98

2

11

90.0

0.0

98

2

11

Data management:

Empower 3
MassLynx v4.1
UNIFI v1.9

Results and Discussion

mAb-Charge Variant Fraction Collection by WFM-A

The Waters Fraction Manager-Analytical (WFM-A) is an analytical fraction collector specifically designed to collect low-volume peaks produced by UPLC (i.e., dispersion volumes <20 μL), UHPLC (i.e., dispersion volumes >20 but <40 μL), and HPLC (i.e., dispersion volumes >40 μL) separations (Figure 1). The low-volume, rapid-switching valve reduces dispersion and allows the precise collection of narrow UPLC peaks.2 The WFM-A has a biocompatible flow path that allows easy integration into the UPLC or HPLC system, accommodating all biomolecule applications. Therefore, it is ideal for mAb-charge variant fraction collection.

Figure 1. Waters Fraction Manager-Analytical (WFM-A) can be easily integrated with LC systems.

Before the fractions are collected, it is recommended that a loading study be conducted to determine an optimal sample load on the column. Unlike an optimal load for an analytical method, the goal here is to determine a maximum load amount that still provides acceptable resolution. This assessment may also take into account whether the collected fractions will be re-chromatographed. Figure 2A shows separations of trastuzumab charge variants on a BioResolve SCX mAb, 4.6 × 50 mm Column. As predicted, the resolution decreased as the sample load increased. It is also noted that as load increases, the retention time decreases. This is due to increased saturation of the available ligands on the particle surface. Additionally, the retention time shift is greater for the earlier eluting peaks, which is indicative that under these conditions the more strongly binding charge variants are displacing the weaker bound forms at the head of the column. This shift in retention times demonstrates the importance of reproducibly loading a column when automated fraction collection is employed.

Increasing column length helps to alleviate resolution loss, as demonstrated in Figure 2B. While the gradient time is doubled, a 2.5-fold increase in sample load produced a comparable separation to that of the 50 mm column, resulting in a 25% increase in purification efficiency. Overall, the results indicate that the loading capacity of the BioResolve SCX mAb, 4.6 × 100 mm Column is in the range of 1–2 mg of mAb.3 Depending on the protein sample being separated, the loading capacity may significantly vary.

Figure 3A shows the infliximab charge variant fractions collected by the WFM-A. The fractions were then pooled, diluted, and re-injected onto the BioResolve SCX mAb Column. When the fraction chromatograms were overlaid, it was observed that alternate fractions (for example, Fractions 2, 4, 6, 8, and 10) were reasonably baseline separated (Figure 3B). Therefore, it is possible to re-chromatograph several alternate fractions all at once, which will save a great amount of time. Figure 3C shows the chromatograms where several fractions were re-injected onto the BioResolve SCX mAb Column at a low salt loading condition, and then eluted during a salt gradient. All fractions were diluted with a loading buffer (1:1 ratio) to reduce the salt concentration. In addition, the alternate fractions were injected in reverse order of elution. For example, Fraction 10 was injected first, followed by the injection of Fractions 8, 6, and so on. This prevents weaker-retained fractions from potentially eluting from the column, while higher ionic strength fractions are loaded. As can be seen, the alternate fractions are well-separated in a single run.

Further Analysis of mAb-Charge Variant Fractions

Once the fractions are collected, the proteincharge variants can be characterized in a variety of structural and functional assays. The intact and subunit LC-MS analyses of selected infliximab fractions and the peptide mapping analysis of selected trastuzumab fractions are presented as examples.

Intact mass analysis of infliximab

Infliximab Fractions 5–10 were analyzed on a BioResolve RP mAb Polyphenyl Column and detected using a Xevo G2-XS Mass Spectrometer. The MassLynx data were imported into and analyzed by UNIFI Software. Figure 4 shows the spectra of infliximab fractions. As predicted, Fractions 5, 6, and 10 differ in the number of lysine at COOH-terminus (Figure 4A).4 For Fractions 7, 8, and 9, the data are consistent with differences in sialic acid and core fucose content of the N-glycans (Figure 4B). While differences in sialic acid content can result in charge variants, differences in core fucose content has been shown to change the conformation of the Fc domain of the mAb,5 potentially resulting in a separate peak for the IEX separation. Released N-glycan analysis on these fractions would provide additional information.

Subunit analysis of infliximab

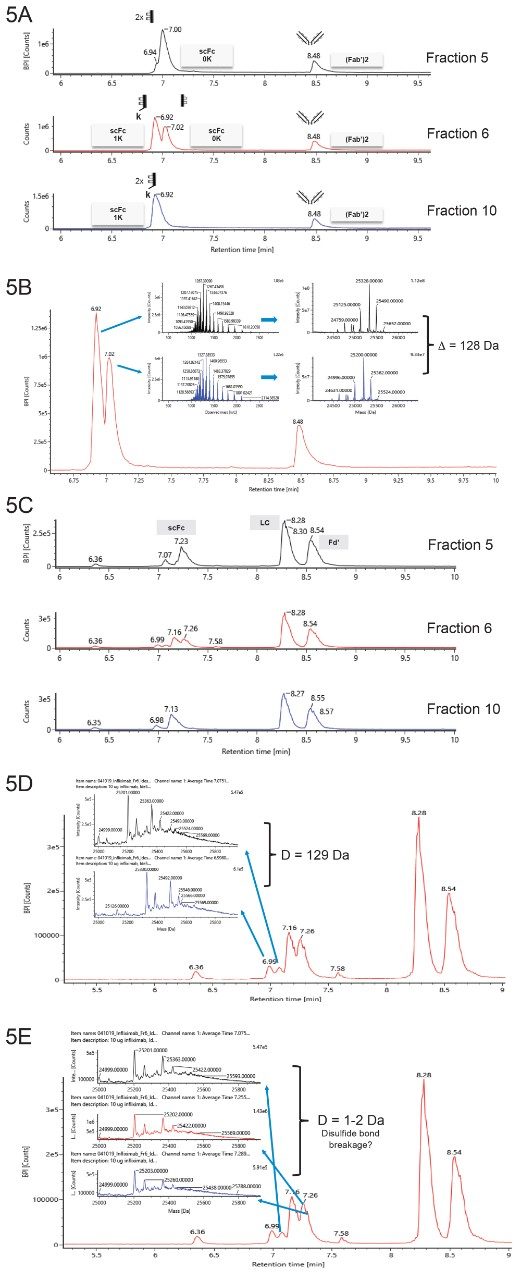
Infliximab Fractions 5, 6, and 10 were digested by IdeS for subunit analysis. Afterwards, an aliquot of each sample was also subjected to disulfide-bond reduction by DTT addition. Both the non-reduced and reduced samples were separated on the BioResolve RP mAb Polyphenyl Column and detected by a Xevo G2-XS Mass Spectrometer.

When the disulfide bonds are not reduced, two major fragments are expected for an IdeS-digested mAb: half Fc fragments referred to as scFc, and the disulfide linked Fab domains, referred to as the F(ab’)2 fragment. Figures 5A and 5B show that Fraction 5 has a major RP subunit peak at 7.00 minutes that has a mass consistent with the scFc fragment without a predicted COOH-terminal lysine. Fraction 10 produced a major RP subunit peak at 6.92 minutes that has a mass consistent with the scFc fragment with lysine on the COOHterminus. For Fraction 6, the scFc fragments both with and without COOH-terminal lysine are predominantly observed. The LC-MS data is consistent with Fractions 5, 6, and 10 being predominantly comprised of mAb with COOH-terminal lysine on neither heavy chain, on one of the heavy chains, or on both heavy chains, respectively.

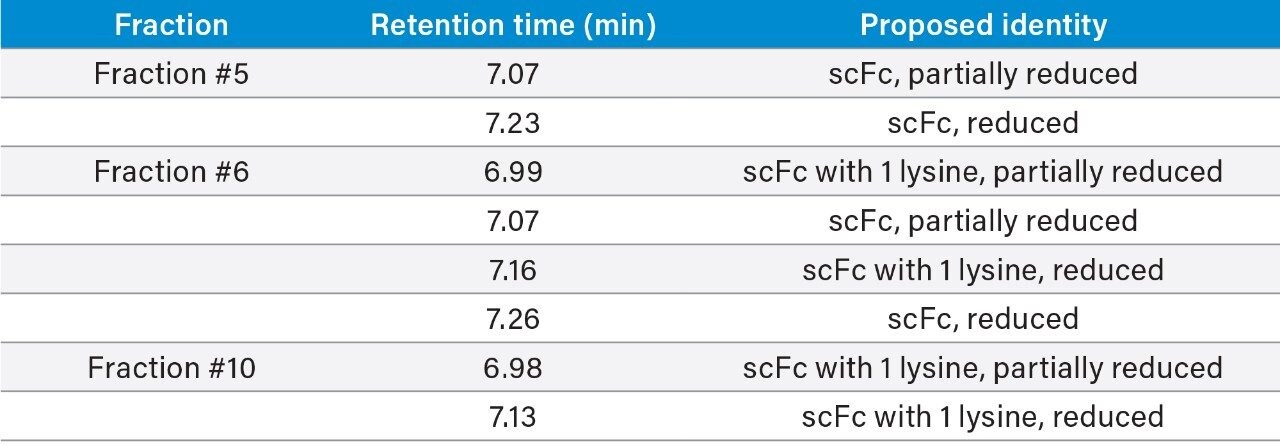
Under the reduced condition, three peaks are generally expected for an mAb: the scFc fragment, the light chain (LC), and the Fd’ fragment. Shown in Figure 5C, for all the fractions, the peak at retention of ~8.28 minutes has been identified as LC, and the peak at the retention of ~8.54 minutes has been identified as the Fd’ fragment. The proposed identity of the peak between 6.98 minutes and 7.26 minutes is
shown in Table 1. They are the scFc fragments likely different in one lysine with different degrees of disulfide-bond reduction. Figures 5D and 5E show the difference in deconvoluted mass of the Fc fragment peaks, as supporting information.

Overall, the subunit analysis agrees with the intact mass analysis that Fractions 5, 6, and 10 differ in the number of lysines at the COOH-terminus.

Table 1. Proposed peak identity in Fractions 5, 6, and 10 of infliximab under reduced conditions.

Peptide mapping analysis of trastuzumab

Figure 6A shows charge variant separation of trastuzumab on a BioResolve SCX mAb Column. Fractions were collected using the WFM-A. The peptide mapping analysis was carried out on Fraction 5 (the acidic peak) and Fraction 7 (the main peak). The fractions were pre-concentrated and digested by trypsin and Lys-C. The peptides were separated on a BEH300 C18, 1.7 μm Column.

Figure 6B is a mirror image of the peptide map of Fraction 5 and Fraction 7. A peak at retention time of 30.24 minutes in Fraction 5 was observed, while there is very little absorbance at the same retention time in Fraction 7. The extracted ion chromatograms (XIC) show that there is a large increase of peak area at retention time of 30.26 minutes in Fraction 5, and this increased peak has been identified by the UNIFI Software as deamidation of the peptide ASQDVNTAVAWYQQKPGK. The un modified peptide peak is present at retention time of 29.63 minutes (Figure 6C). Comparing MS-MS fragment data of the modified and unmodified peaks reveals that the m/z of the fragment ions are the same, if the fragment does not contain asparagine (N). However, fragments that contain asparagine are different in 1 Da of mass, consistent with deamidation of the peptide (Figure 6D). Forced deamidation of trastuzumab showed a large increase of Fraction 5, further indicating the major component of this acidic peak is deamidated trastuzumab (data not shown).

Peptide mapping analysis of trastuzumab fractions. (A) Trastuzumab fractions collected from a BioResolve SCX mAb, 4.6 × 100 mm Column. (B) Mirror image of peptide maps for Fractions 5 and 7. A peak at a retention time of 30.24 min increased significantly in Fraction 5, compared to that in Fraction 7 (indicated by the blue arrow). (C) Extracted ion chromatograms (XIC) for identified peptides. The peak at 30.26 min has been identified as deamidation of the peptide ASQDVNTAVAWYQQKPGK. The un-modified peak has a retention time of 29.63 min. (D) MS-MS fragment comparison of the deamidated and un-modified peptide ASQDVNTAVAWYQQKPGK. The fragments that do not contain asparagine have the same mass value, while the fragments that do contain asparagine differ in 1 Da in mass.

Other Potential Analysis

Shown above are a few examples of the types of analysis that can be performed with the mAb fractions collected from the ionexchange separation. Other types of structural analyses such as oxidation analysis or glycan analysis, can also be done to provide detailed information of the peaks of interest. Additionally, functional assessments of the charge variants using SPR, bioassays, and even preclinical pharmacokinetic studies can provide additional understanding of the biotherapeutic protein.

Conclusion

Charge-related heterogeneity is observed in virtually all mAbs. It can be introduced either during antibody expression or during manufacturing and storage of the antibody. The charge variants can potentially influence quality, safety, and efficacy, so they need to be identified and characterized. A commonly used approach is to collect the charge variant fractions separated on an IEX column, and characterize them in a variety of structural and functional assays.

In this application note, we have demonstrated sample load optimization on a  BioResolve SCX mAb Column, purification strategy using WFM-A, as well as a few examples of analyses that could be done on the charge-variant fractions in order to obtain useful information on the modification of the mAbs. It has been shown that the BioResolve SCX mAb Column, coupled with WFM-A, is ideal for analytical-scale, mAb-charge-variant fraction collection and characterization.

References

  1. Khawli, L. A.; et al. Charge Variants in IgG1. mAbs. 2010, 2(6), 613–624.
  2. Jablonski, J. M.; et al. Small Scale Peptide and Impurity Isolation Using the ACQUITY UPLC H-Class and Waters Fraction Manager-Analytical Systems. Waters Application Note, 720005500EN (2015).
  3. Lauber, M. A.; et al. Designing a new particle technology for robust charge variant analysis of mAbs. Waters Application Note, 720006475EN (2019).
  4. Jung, S. K.; et al. Physicochemical characterization of Remsima. mAbs. 2014, 6(5), 1163–1177.
  5. Sakae, Y.; et al. Conformational effects of N-glycan core fucosylation of immunoglobulin G Fc region on its interaction with Fcγ receptor IIIa. Scientific Reports. 2017, 7, 13780.

720006647, August 2019

Zurück zum Seitenanfang Zurück zum Seitenanfang