• Applikationsbericht

High Resolution and High Throughput Size-Exclusion Chromatography Separations of IgG Antibody Aggregates and Fragments on UHPLC and HPLC Systems with 2.5 μm BEH Particles

High Resolution and High Throughput Size-Exclusion Chromatography Separations of IgG Antibody Aggregates and Fragments on UHPLC and HPLC Systems with 2.5 μm BEH Particles

  • Stephan M. Koza
  • Weibin Chen
  • Waters Corporation

Abstract

The XBridge Protein BEH SEC, 200 Å, 2.5 µm Columns can provide HMWS and LMWS resolutions equal to those that can be achieved on ACQUITY UPLC Protein BEH SEC, 1.7 µm Columns, however, use of the XBridge Column will result in moderately increased analysis times. The goal of this study was to demonstrate the performance of the Waters XBridge Protein BEH SEC, 200 Å, 2.5 µm Columns, which are provided in both 7.8 mm and 4.6 mm I.D.

Benefits

  • A performance comparison of Waters Protein BEH SEC, 200 Å (2.5 μm, 1.7 μm, and 3.5 μm) Columns on UPLC, UHPLC, HPLC LC systems
  • Performance comparisons of Waters Protein BEH SEC, 200 Å, 2.5 μm Columns and current competitor sub-3-μm columns
  • Guidance for selecting the optimal SEC column configuration based on the LC systems to be used for analysis

Introduction

Size-exclusion chromatography (SEC) has been the method of choice for the routine assessment of protein aggregation (high molecular weight species [HMWS]) for most recombinant protein-based biotherapeutic products.1 Additionally, the use of SEC for the non-denatured analysis of protein fragments (low molecular weight species [LMWS]) in these samples has also been successfully applied.2 A predominant form of which for many mAb biotherapeutics is two-thirds the molecular weight (~100 kDa) of the mAb monomer (~150 kDa) and is the result of proteolytic cleavage of a Fab domain (50 kDa) at the IgG hinge region of an IgG.2 We will refer to this fragment as LMWS1. Additionally, a lower abundance LMWS peak is also observed eluting later than the LMWS1 fragment. This peak, referred to as LMWS2, is a mixture of cleaved Fab and Fc domains, where the Fc domains are the result of the cleavage of both Fab domains. Due to the LMWS1 and monomer being more similar in size (hydrodynamic radius) and eluting on the tail-end of the significantly larger monomer peak, the separation and reproducible quantification of this LMW form is typically more challenging than it is for the dimer HMWS protein form (~300 kDa), which elutes prior to the monomer, and for the LMWS2 fragments which are baseline resolved. While this study will focus on the mAb SEC separation as an example, the general principals demonstrated here may also be applied to other protein biotherapeutics as well.

While it has been demonstrated that the use of multiple SEC columns in series can be used to provide the efficiencies needed to reliably separate the 100 kDa mAB LMW fragment, this separation has generally been performed using higher efficiency SEC columns, with particle diameters of 2 µm and smaller, to enable higher throughput analyses.3 However, as these columns are typically manufactured with internal diameters (I.D.s) of 4.6 mm and smaller, their use is limited for this application on HPLC and even some UHPLC chromatography systems with their somewhat larger system dispersion volumes, as compared to UHPLC systems.4 As a result, BEH SEC, 200 Å, 2.5 µm columns packed in larger formatted 7.8 mm I.D. hardware were developed to effectively bridge the performance gap between the Waters Protein BEH SEC, 200 Å, 1.7 µm and 3.5 µm Columns, and provided more robust and easily transferred analyses with less dependency on the extra-column dispersion of the LC systems being used. 

Throughout this discussion we will refer to 5σec system dispersion volume as a primary measurement of LC system performance. Briefly, 5σec system dispersion volume, also referred to as extra-column dispersion, is the volume of mobile phase that an injected sample slug (1 µL or less) will occupy after it has traveled through an LC system without a column in place as measured from the beginning to the end of the peak at a height of 4.4% of the peak maximum.5 More detailed discussion of LC system dispersion, and the effect that it has on SEC separations, can be found in Waters Application Notes (p/n’s: 720006336EN and 720006337EN).

The goal of this study was to demonstrate the performance of the Waters XBridge Protein BEH SEC, 200 Å, 2.5 µm Columns, which are provided in both 7.8 mm and 4.6 mm I.D. Comparisons will be provided for Waters SEC 1.7 µm and 3.5 µm particle size columns and current sub-3-µm competitor columns. In summary, recommendations are provided for column selections that are compatible with Waters LC instrumentation.

Experimental

Sample description

The mAb sample of rituximab (Rituxan) was used past expiry at original concentration of ~21 mg/mL. 

BEH200 SEC Protein Standard Mix (p/n: 186006518)

Method conditions

Systems:

ACQUITY UPLC H-Class Bio

Detection:

ACQUITY UPLC TUV with 5 mm titanium flow cell

Wavelength:

280 nm

Columns:

ACQUITY UPLC Protein BEH SEC, 200 Å, 1.7 μm, 2.1 × 150 mm (p/n: 186008471)

ACQUITY UPLC Protein BEH SEC, 200 Å, 1.7 μm, 4.6 × 150 mm (p/n: 186005225)

ACQUITY UPLC Protein BEH SEC, 200 Å, 1.7 μm, 4.6 × 300 mm (p/n: 186005226)

XBridge Protein BEH SEC, 200 Å, 2.5 μm, 4.6 × 150 mm and BEH200 Protein Standard (p/n: 176004335)

XBridge Protein BEH SEC, 200 Å, 2.5 μm, 4.6 × 300 mm and BEH200 Protein Standard (p/n: 176004336)

XBridge Protein BEH SEC, 200 Å, 2.5 μm, 7.8 × 150 mm and BEH200 Protein Standard (p/n: 176004326)

XBridge Protein BEH SEC, 200 Å, 2.5 μm, 7.8 × 300 mm and BEH200 Protein Standard (p/n: 176004327)

XBridge Protein BEH SEC, 200 Å, 3.5 μm, 7.8 × 300 mm and BEH200 Protein Standard (p/n: 176003596)

Column temp.:

Ambient, ~22 °C

Sample temp.:

10 °C

Mobile phase A:

100 mM NaH2PO4

Mobile phase B:

100 mm Na2HPO4

Mobile phase C:

1.00 M NaCl

Mobile phase D:

H2O (all 0.2 μm sterile filtered) and Auto•Blend Plus blended at 3.4% A, 16.6% B, 40% C, and 40% D to yield 20 mm sodium phosphate, 400 mM NaCl, pH 7.2, unless otherwise noted

Sample vials:

Polypropylene 12 × 32 mm Screw Neck with Cap and PTFE/silicone Septum, 300 μL Volume (p/n: 186002640)

Chromatography software:

Empower 3

Flow rates and injection volumes, unless otherwise noted

Column dimension (mm)

Flow rate (mL/min)

Injection volume (µL)

4.6 × 150

0.35

1

4.6 × 300

0.35

2

7.8 × 150

1

5.8

7.8 × 300

1

10

Results and Discussion

General performance comparison of 1.7 μm, 2.5 μm, and 3.5 μm BEH sec, 200 Å Columns

The general performance of the BEH SEC 200 Å, 2.5 µm column was compared to that of the 1.7 µm and 3.5 µm particle size columns for the separation of the BEH200 SEC Protein Standard Mix. Sample chromatographic profiles presented in Figure 1 were performed on 300 mm length columns for all three particle sizes and the linear velocities (cm/min), and ultimately analysis times, were equivalent in this comparison. The 1.7 µm column I.D. was 4.6 mm, and 2.5 µm and 3.5 µm column I.D.s were 7.8 mm. The 5σec dispersion volume of the LC system used for the 1.7 µm column was 17.6 µL, which is within the middle of the dispersion volume range expected for a UPLC system, and the 5σec dispersion volume of the LC system used for the 2.5 µm and 3.5 µm columns was 38.1 µL, which is within the upper dispersion volume range expected for a typical UHPLC system or within the lower dispersion volume range expected for a typical HPLC system.  

Figure 1. Shown is a comparison of the separation of standard proteins on 200 Å pore size BEH SEC particles with diameters of 1.7 µm, 2.5 µm, and 3.5 µm. Sample loads and flow rates were proportional to column I.D. The 5σec LC system dispersion volume was 17.6 µL for the 1.7 µm column and 38.8 µL for the 2.5 µm and 3.5 µm columns. Peak identifications (shown in top left chromatogram) are: thyroglobulin dimer (A1, 1.32 kDa), thyroglobulin monomer (A2, 660 kDa), IgG (B, 150 kDa), BSA (C, 66 kDa), myoglobin (D, 17 kDa), and uracil (E, 112 kDa). Mobile phase was 20 mM sodium phosphate, 400 mM NaCl, pH 7.2. Plate counts for specified peaks are based on USP tangent method and reduced plate count is determined by dividing the plate height (column length divided by plate count) by the particle diameter.

In comparing the profiles, it is readily observed that the peak widths are narrower, and resolutions improved as the particle size decreased, as would be predicted since peak width is proportional to the inverse of particle diameter. The USP plate counts determined for the immunoglobulin G (IgG), bovine serum albumin (BSA), and myoglobin protein standard are also provided alongside their respective peaks. These plate counts confirm that the column efficiency increases as particle size is decreased. It is also noted that the determined plate counts decrease as the protein size increases. This is consistent with the predicted proportional relationship between separation efficiency and the diffusion coefficient of the analyte.5 To further quantitatively assess this performance difference, we compared the reduced plate heights for the protein standards (Figure 1). Reduced plate height is a dimensionless quantity determined by dividing the plate height (column length divided by plate count) by the particle diameter where both values are expressed in the same units of length. Comparable reduced plate heights were measured on all three columns, which demonstrates that the column efficiency is reasonably proportional to the BEH particle diameters, as would be predicted. Practically, these results show that greater resolution for an SEC separation can be achieved without an increase in analysis time by using smaller diameter particles. 

Analysis of HMWS and LMWS impurities in mAb preparations with 1.7 μm, 2.5 μm, and 3.5 μm BEH SEC, 200 Å columns

Next, we compare the performance of the three 200 Å BEH SEC particle sizes in the separation of the recombinant rituximab, a chimeric (mouse/human) anti-CD20 IgG1 antibody (Figure 2). It was previously demonstrated that the use of 1.7 µm, 4.6 × 150 mm columns significantly decreases the resolution and limit of quantification for the LMWS1 fragment (100 kDa) of an IgG and also required tight control of system dispersion volumes in order to provide reproducible results in comparison to the use of a 4.6 × 300 mm column.3 Therefore, we will only compare the 300 mm column lengths in this study. In Figure 2, the two sets of chromatograms produced by 4.6 × 300 mm columns containing either 1.7 µm or 2.5 µm diameter particles were run at a constant flow rate of 0.35 mL/min and the 5σec system dispersion volume was altered. For the 7.8 × 300 mm columns packed with 2.5 µm and 3.5 µm diameter particles, the 5σec system dispersion volume was set to 38.8 µL, while the flow rate was lowered as noted to provide more resolution. The quality of the separation will be assessed using peak-to-valley (P/V) ratio, which is calculated by dividing the height from the baseline of the smaller peak by the height of the valley between the critical pair. 

Figure 2. A comparison of the separation of rituximab on 200 Å pore size BEH SEC particles with diameters of 1.7 µm, 2.5 µm, and 3.5 µm. All columns were  300 mm in length, and sample loads and flow rates were proportional to the square of the column I.D. For the 1.7 µm and 2.5 µm, 4.6 mm I.D. columns the  flow rate was held constant and system dispersion was increased; and for the 2.5 µm and 3. 5 µm, 7.8 mm I.D. columns, the system dispersion is constant  and flow rates were decreased. Further experimental details are provided in the text. Percent peak areas were determined by drop-baseline peak integration.

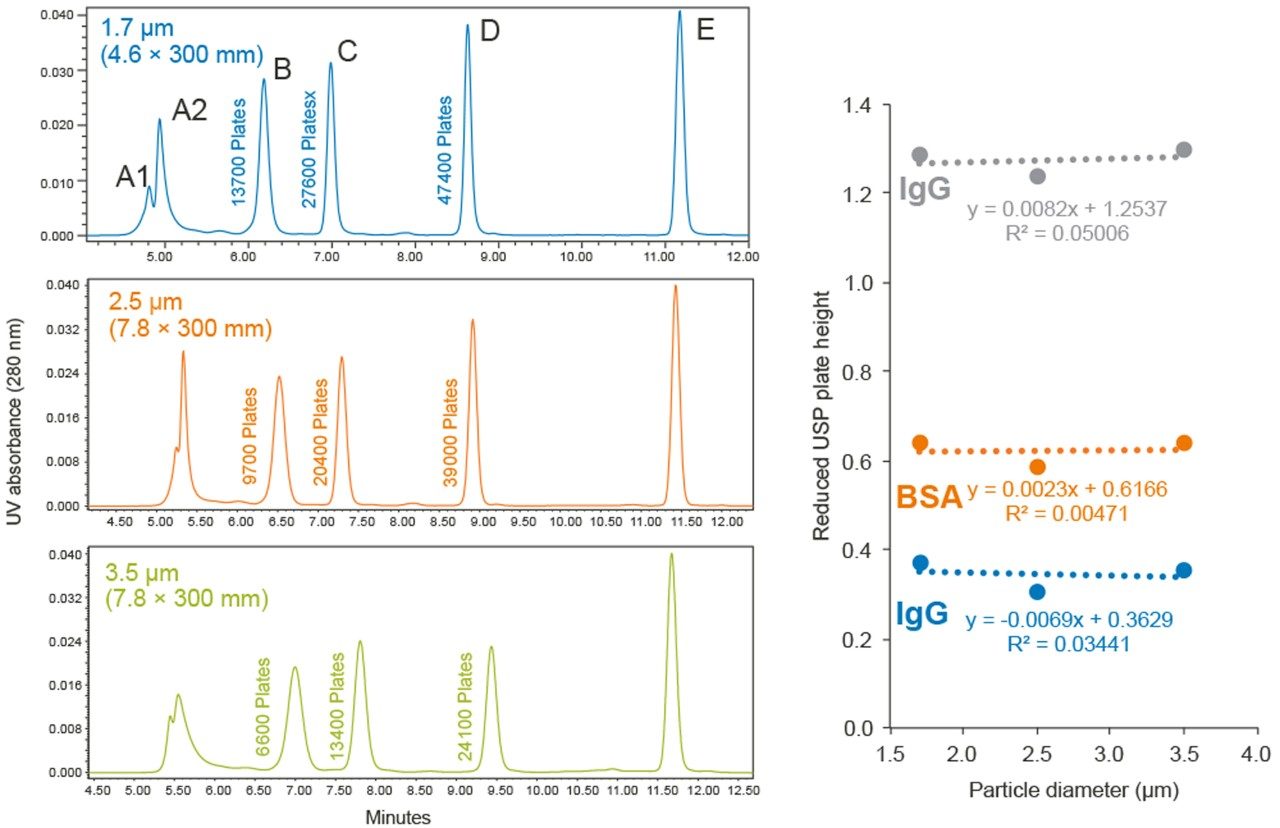
We will first consider the critical pair separation between the HMWS and the monomer. HMWS is presumed to be predominantly a dimer (~300 kDa) that is present at a level of approximately 0.5% in the sample tested. We observe by comparing the top row  of chromatograms that the HMWS-monomer separation improves (higher P/V values) as particle size is decreased when the columns are operated at equal linear velocities and on systems with appropriate dispersion volumes. Throughout, the range of 5σec system dispersion volumes showed the 1.7 µm particle size column provided better resolution than the 7.8 mm I.D. (2.5 µm or 3.5 µm) columns, although this advantage diminishes as system dispersion is increased. We also see for the 2.5 µm particles that the performance of the 4.6 mm I.D. column matches that of the 7.8 mm I.D. column at only the lowest dispersion volume tested (5σec = 12.5 µL). Changes in system dispersion did not significantly alter the HMWS P/V values for the 7.8 mm I.D., 2.5 µm particle size column (data not shown). 

By decreasing the flow rate for the 2.5 µm and 3.5 µm columns with 7.8 mm I.D., the HMWS P/V value can be improved to match and even exceed that of the 1.7 µm column, however, this will result in longer analysis times. Similar observations were also made for the separation of the VHMWS peak which is comprised of multimeric aggregate forms (data no shown). For both the 4.6 mm I.D. and 7.8 mm I.D. columns, variations in 5σec system dispersion volumes or flow rate did not significantly alter the integrated percent peak areas of the VHMWS or the HMWS with the highest relative deviations of 4.9% and 6.7% being observed for VHMWS and HMWS during the flow rate study on the 3.5 µm, 7.8 × 300 mm column.

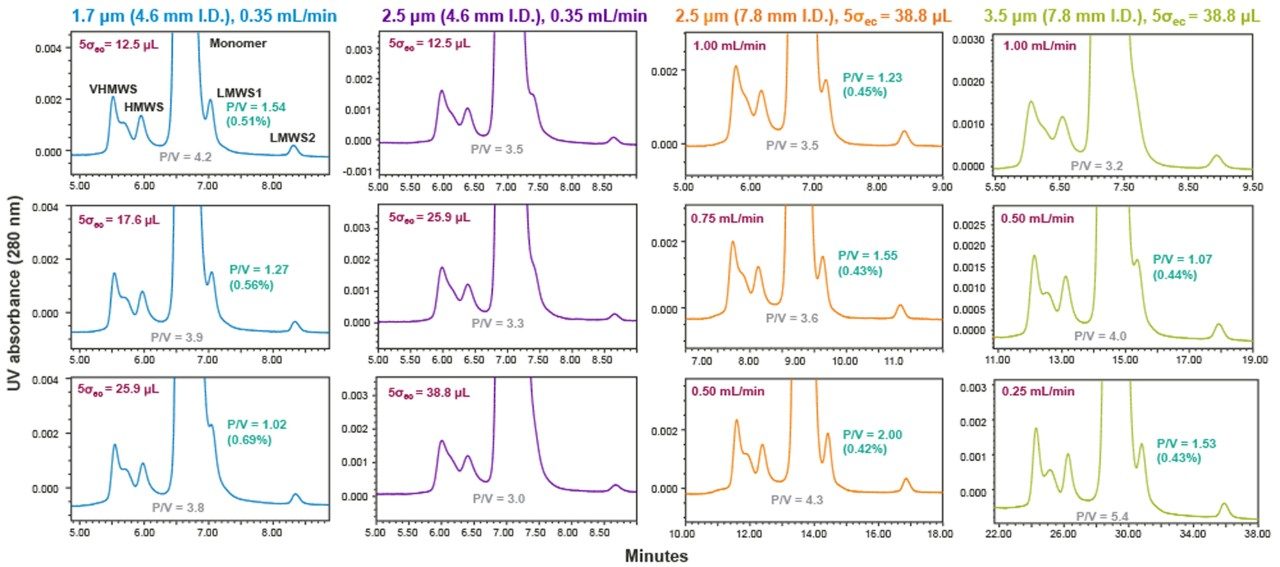
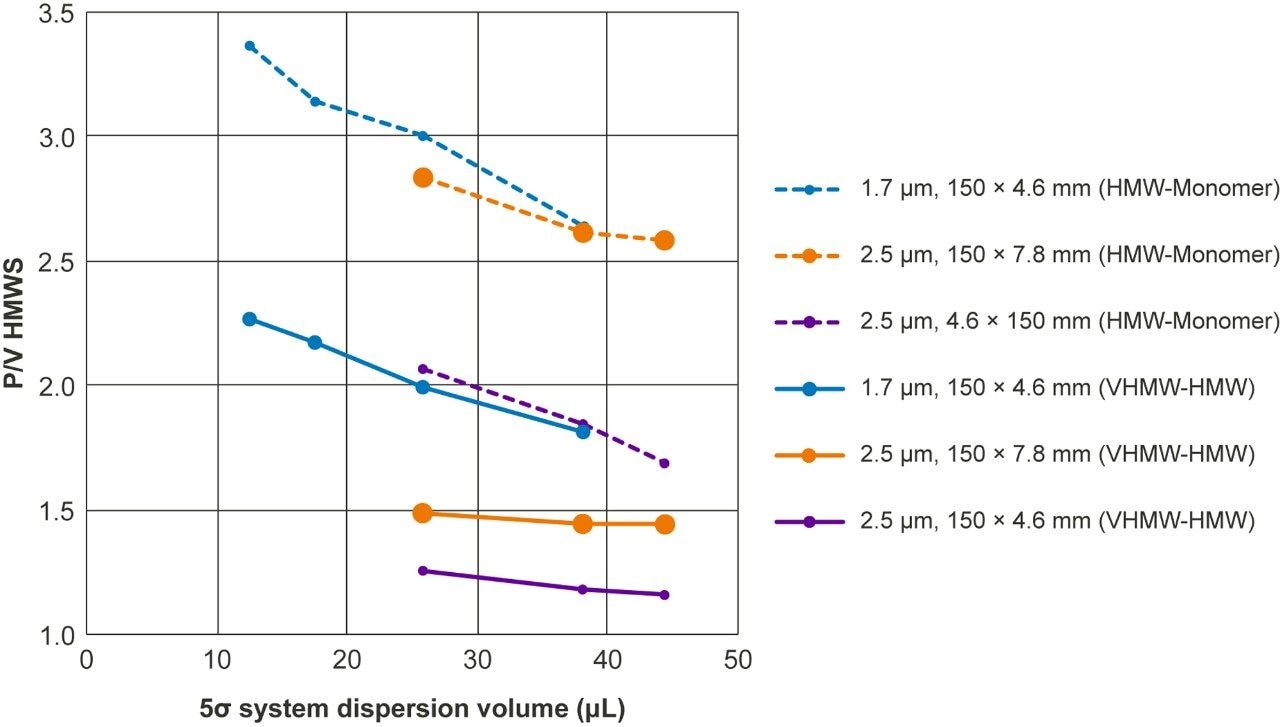
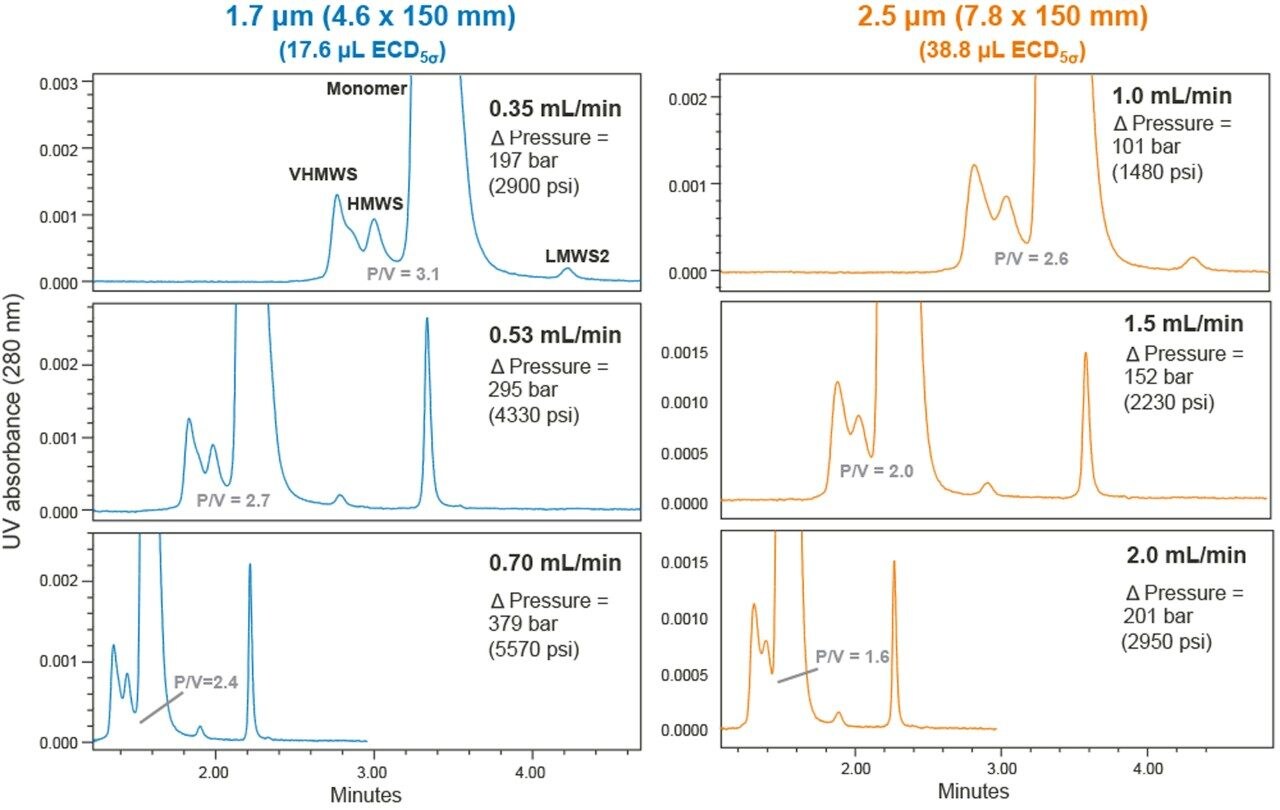
We will now consider the separation of the IgG LMWS1 fragment (Figure 2) which has a molecular weight of approximately 100 kDa. It is challenging to reproducibly separate and quantify LMWS1 due to this form not being as different in size from the monomer versus the size difference between HMWS and monomer. This separation is further complicated by the elution position of the LMWS peak within the tailing segment of the far more abundant monomer and by the very low abundance of LMWS1 in the sample being evaluated (~0.4%) in this study.3 Of note is the effect that system dispersion can have on this resolution. This is clearly observed for the 1.7 µm (4.6 × 300 mm) column where we observe a precipitous decrease in P/V measured between LMWS1 and monomer as 5σec system dispersion volume was increased 12.5 µL to 25.9 µL, where the latter volume is commonly observed in UHPLC and even some UPLC system configurations. This loss in resolution also resulted in an increase in the integrated relative peak area of LMWS1 from 0.5% up to 0.7%. In comparison, the LMWS1 separation provided by the 2.5 µm (7.8 × 300 mm) column when run at a flow rate of 0.75 mL/min, which results in a 33% increase in run time, was comparable to that observed for the 1.7 µm column (5σecc = 12.5 µL). More practically, when run at the same linear velocity the 2.5 µm (7.8 × 300 mm) particle size column produced a comparable or greatly improved separation to that observed for the 1.7 µm column when used on an LC at a 5σec system dispersion volume of 17.6 µL to 25.9 µL, performance that is more typical of UHPLC and UPLC systems capable of using 30 cm columns. As further evidence of the impact that extra-column dispersion can have when using 4.6 mm I.D. SEC columns, we also observe a significant loss of LMWS1 resolution for the 4.6 mm I.D., 2.5 µm particle size column versus the 7.8 mm I.D. column.

When we compare the LMWS1 separations produced by the 2.5 µm and 3.5 µm particle size columns, we observe that the comparable P/V values can be achieved using the 3.5 µm particle size, albeit at a considerably lower linear velocity. As an example, the P/V achieved at a 0.75 mL/min flow rate when using the 2.5 µm column is comparable to that observed at a flow rate of 0.25 mL/min on the 3.5 µm column. This corresponds to a sample throughput of approximately three times greater for the 2.5 µm column. 

The robustness for the measurement of the LMWS1 fragment relative abundance is greatly improved for both larger format (7.8 × 300 mm) columns in comparison to that observed for the 1.7 µm particle size column (4.6 × 300 mm). Regardless of the resolution achieved, we observe a remarkably consistent LMWS1 percent peak area ranging between 0.42% and 0.45% for the two 7.8 mm I.D. columns. Additionally, in a separate experiment, the LMWS1 percent peak area was consistent for the 2.5 µm particle size (7.8 × 300 mm) column ranging from 0.41% to 0.43% as 5σec system dispersion volume was increased from 25.9 µL to 44.4 µL (data not shown). Throughout this study the percent peak area for the 50 kDa LMWS2 fragments was consistent for all columns (data not shown). This is a result of this peak being fully baseline resolved under the conditions tested.

In summary, for the analysis of LMWS1 fragments by SEC, the use of a 1.7 µm particle size (4.6 × 300 mm) column can provide improved resolution and reliable results with the same analysis time as compared to the 2.5 µm particle size (7.8 × 300 mm) column provided that UPLC system dispersion is minimized and controlled. Alternatively, comparable HMWS and LMWS resolutions can be realized when using the 2.5 µm particle size (7.8 × 300 mm) column at moderately lower linear velocities and increased analysis times with the added benefit of the methods being far less dependent on the system dispersion and running at lower pressures. Thereby, allowing for the use of UHPLC and modern HPLC systems. 

The 2.5 µm particle size in a 7.8 × 300 mm column configuration will outperform the same particle in a 4.6 × 300 mm column configuration and that performance increase improves as system dispersion increases. As a result, the 7.8 mm column I.D. is generally recommended unless there is a desire to limit sample or mobile phase volumes, and system dispersion will be controlled. In all cases, a 2.5 µm particle size column will outperform a 3.5 µm particle size column of the same length and I.D. The advantages of the 3.5 µm particle size will be an approximate 50% lower back pressure, enabling its use on some LC systems with low upper pressure capabilities.

High-throughput analysis of HMWS

We receive numerous requests from customers who are interested in deploying high-throughput SEC analysis during process and formulation development for a biotherapeutic protein. Greatly reducing SEC analysis time has also provided the possibility of deploying SEC and SEC with multi-angle light scattering detection (SEC-MALS) for on-line monitoring of a manufacturing process step.6 Given the utility of these applications we compared the performance of the 1.7 µm and 2.5 µm particles with a column length of 150 mm and at equivalent linear velocities. The 3.5 µm particle size was not considered due to the benefits smaller particles provide for high-throughput SEC analysis. 

The impact of system dispersion on the separation of both VHMWS and HMWS for the 1.7 µm particle size (4.6 mm I.D.) and 2.5 µm  particle size (4.6 mm and 7.8 mm I.D.) columns is shown in Figure 3. Here we observe that the 1.7 µm column provides superior separation of the VHMWS and HMWS peaks throughout the range of system dispersions evaluated. However, for the separation of HMWS and monomer, we observe that as 5σec exceeds 25 µL that the performance advantage of the 1.7 µm particle size is substantially diminished. The greater impact of system dispersion on the separation of HMWS and monomer is a direct result of  the significantly larger monomer peak size and the limited separation observed between those two peaks. These results indicate that for partially resolved HMWS separations the LC system dispersion should be minimized and controlled to derive the full benefits of the 1.7 µm particle size (4.6 × 300 mm) column. 

Comparison of the performance of the 2.5 µm particle size in 4.6 mm and 7.8 mm I.D. columns (Figure 3) shows that the 7.8 mm I.D. significantly outperforms the 4.6 mm I.D. column for the separation of HMWS and monomer, and to a lesser extent the separation  of VHMWS and HMWS. This is a result in that UHPLC and HPLC system dispersion levels have a much greater deleterious effect  on separation quality for the smaller I.D. column. 

Figure 3. Plotted is a comparison of the peak-to-valley (P/V) measurements at the start (VHMW-HMW) and end (HMW-Monomer) of the HMWS peak as a function of system dispersion for the separation of rituximab on 200 Å pore size BEH SEC particles with diameters of 1.7 µm, 2.5 µm, and 3.5 µm. Linear velocities were constant for all columns as sample loads and flow rates were proportional to the square of the column I.D.

We next compare the performance of the 1.7 µm particle size (4.6 × 150 mm) and 2.5 µm particle size (7.8 × 150 mm) columns at increased flow rates (Figure 4). The flow rate studies were carried out at a 5σec volume of 17.6 µL (UPLC performance) for the 1.7 µm particle size column and a 5σec volume of 38.8 µL (UHPLC/HPLC performance) for the 2.5 µm particle size column. In comparing the HMWS and monomer separation, we observe that as the linear velocity is increased, the P/V value decreases to a lesser extent for the 1.7 µm particle size column. This behavior is a consistent chromatographic theory based on the van Deemter relationship for SEC.1 

Based on these results, a 1.7 µm particle size (4.6 × 150 mm) column, when used in combination with a low dispersion UPLC system, will provide the higher resolutions and potentially higher sample throughput versus the 2.5 µm particle size (7.8 × 150 mm) column. However, if UHPLC and HPLC systems with larger dispersions are used, the use of the 2.5 µm particle size (7.8 × 150 mm) column can provide comparable separations with an approximate 50% to 75% increase in analysis time depending on flow rate.

Figure 4. Shown is a comparison of the separation of rituximab aggregates VHMWS and HMWS as a function of flow rate on 200 Å pore size BEH SEC particles with diameters of 1.7 µm and 2.5 µm. Both columns were 150 mm in length, and sample loads and flow rates were proportional to the square of the column I.D. The reported Δ pressure values reflect the pressure drop across the column only. Further experimental details are provided in the text. 

Comparison of commercial sub-3-μm SEC columns

SEC columns with particle sizes between 2 µm and 3 µm provide a significant amount of efficiency for separations that will be performed on UHPLC and HPLC instrumentation. In evaluating the performance of the XBridge Protein BEH SEC, 200 Å, 2.5 µm  Column with two other commercially available columns, a physiologically relevant 20 mM phosphate buffered saline (PBS) mobile phase with a pH of 7.2 was employed for the analysis. However, for the analysis of rituximab the NaCl concentration was increased to 400 mM for the XBridge Column and 500 mM for the comparison columns to minimize the increased ionic secondary interactions resulting from operating at a pH above neutral. The XBridge Column and the Competitor A, 300 Å, 2.7 µm column had dimensions of 7.8 × 300 mm and were tested at a 5σec volumes of 38.8 µL while the Competitor B, 250 Å, 2.0 µm column had dimensions of 4.6 × 300 mm and was tested at a 5σec volume of 25.9 µL that is typical of UHPLC systems. All three columns were operated at equivalent linear velocities and the separations were quantitatively assessed based on the plate counts observed for the protein standards. Thyroglobulin monomer plate count is not included as this larger protein eluted near the excluded volume for the XBridge and Competitor B columns, which would have resulted in artificially high plate counts versus the Competitor A column.

A chromatographic comparison and the plate counts determined for the protein standards are shown in Figure 5. We observe that the XBridge Column produces significantly higher plate counts for the IgG, BSA, and myoglobin standards versus the comparison columns, consistent with those peaks being narrower and of greater height. We also observe the impact of pore size where the larger 300 Å pore diameter of the Competitor A column provides clearly improved separation of thyroglobulin and its dimer form versus the other two columns. In contrast, due to their smaller pore diameters, higher resolutions (based on peak width at half-height) between the IgG and BSA standards were observed for the XBridge Column (Rs(HH) = 3.3) and Competitor B column (Rs(HH) = 2.9) versus the Competitor A column (Rs(HH) = 2.6).

Figure 5. A comparison of the separation of standard proteins on three commercially available sub-3-µm particle size SEC columns. Sample loads and flow rates were proportional to column I.D. The 5σec LC system dispersion volume was 25.9 µL for the Competitor B column and 38.8 µL for the XBridge and Competitor A columns. Mobile phase was 20 mM sodium phosphate, 400 mM NaCl, pH 7.2 for the XBridge Column and it was the same for Competitor A and B columns except for the NaCl concentration, which was increased to 500 mM. Plate counts for specified peaks are based on USP tangent method and reduced plate count is determined by dividing the plate height (column length divided by plate count) by the particle diameter. Peak identifications (shown in top chromatogram) are: thyroglobulin dimer (A1, 1.32 kDa), thyroglobulin monomer (A2, 660 kDa), IgG (B, 150 kDa), BSA (C, 66 kDa), myoglobin (D, 17 kDa), and uracil (E, 112 kDa).

The performance of the three columns for the analysis of rituximab was also evaluated and the chromatograms are presented in Figure 6. In this comparison, we observe comparable separation (P/V) between the HMWS and monomer peaks. Similar differences to those observed for the thyroglobin protein standard are seen for the multimeric VHMWS aggregate, where the larger pore size of the Competitor A column results the inclusion of the majority of the VHMWS aggregates versus the XBridge and Competitor B columns where a significant portion of the VHMWS aggregates are mostly excluded from the pores as indicated by the sharper peak profile of VHMWS on those two columns. Lastly, when we compare the separation for the LMWS1 fragment (100 kDa) we achieve a useful separation on only the XBridge Column. The ability to realize this separation on the XBridge Column is due to its more optimal 200 Å pore diameter and greater efficiency. 

Figure 6. A comparison of the separation of rituximab on three commercially available sub-3-µm particle size SEC columns. Sample loads and flow rates were proportional to column I.D. The 5σec LC system dispersion volume was 25.9 µL for the Competitor B column and 38.8 µL for the XBridge and Competitor A columns. Mobile phase was 20 mM sodium phosphate, 400 mM NaCl, pH 7.2 for the XBridge Column and it was the same for the Competitor A and B columns except for the NaCl concentration, which was increased to 500 mM. 

These results demonstrate that the performance of the XBridge Protein BEH SEC, 200 Å, 2.5 µm Column compares favorably with other commercially available SEC columns packed with particle sizes ranging between 2 µm and 3 µm. The XBridge Column produced superior resolution for the 100 kDa IgG fragment (LMWS1) and comparable separation of HMWS and monomer. In addition, in contrast to the Competitor B, 2.0 µm particle size column that is only produced with a 4.6 mm I.D., the 7.8 mm I.D. configuration of the Competitor A and XBridge 2.5 µm Columns can provide this performance on most HPLC system configurations. 

Conclusion

The XBridge Protein BEH SEC, 200 Å, 2.5 µm Columns can provide HMWS and LMWS resolutions equal to those that can be achieved on ACQUITY UPLC Protein BEH SEC, 1.7 µm Columns, however, use of the XBridge Column will result in moderately increased analysis times. The XBridge Column, however, when used in a 7.8 mm I.D. configuration, will provide performance that is far less dependent on the system dispersion and will generate lower back pressures to the extent that both UHPLC and HPLC systems can be employed. Whereas, minimization and control of system dispersion and the ability to operate at significantly higher pressures is required to gain the benefits provided by the more efficient ACQUITY UPLC SEC, 1.7 µm, 4.6 mm I.D. Column. 

In addition, as would be predicted, XBridge 2.5 µm Columns provide improved efficiencies in comparison to equivalently sized XBridge 3.5 µm Columns, however, the back pressures generated by the smaller particle size will be greater. The XBridge Protein BEH SEC, 200 Å, 2.5 µm Column also compares favorably with other commercially available SEC columns packed with particle sizes ranging between 2 µm and 3 µm, making this column a worthwhile candidate for new method development, particularly when the resultant method will be run on different LC systems. However, as we have observed in this study, the optimal ionic strength mobile phase for SEC methods on the XBridge Column comprised of organo-silica hybrid particles will be lower than what is required for typical silica-particle-based SEC columns. 

To aid in the selection between 1.7 µm, 2.5 µm, and 3.5 µm particle size BEH SEC columns we have summarized key considerations in Table 1. While this study focused on the 200 Å pore size column and the separation of a IgG and its HMW and LMW impurities, this generic guide can also be applied to other proteins as well. Also, the guidance, with regards to column diameter in this table, can be applied to the use of BEH and other SEC columns with other pore and particle sizes.

Table 1. BEH SEC Column Selection Guide.

Acknowledgments

The authors would like to thank Pamela Iraneta and William Warren for their insights and perspectives of the SEC analysis of proteins.

References

  1. Hong, P.; Koza, S.; Bouvier, E.S. Size-Exclusion Chromatography for the Analysis of Protein Botherapeutics and their Aggregates. J. Liq. Chromatogr. Relat. Technol. 2012; 35, 2923–50.
  2. Cordoba, A.J.; Shyong, B-J.; Breen, D.; Harris, R.J. Non-Enzymatic Hinge Region Fragmentation of Antibodies in Solution. J Chromatogr. B. 2005; 818, 115–21.
  3. Koza, S.M.; Reed, C.; Chen, W. Impact of LC System Dispersion on the Size-Exclusion Chromatography Analysis of Monoclonal IgG Antibody Aggregates and Fragments: Selecting the Optimal Column Configuration for Your Method. Waters Application Note 720006336EN, September 2018.
  4. Fekete, S.; Guillarme, D. Influence of Connection Tubing in Modern Size Exclusion Chromatography and its Impact on the Characterization of mAbs. Journal of Pharmaceutical and Biomedical Analysis. 2018; 149, 22–32.
  5. Koza, S.M.; Reed, C.; Chen, W. Evaluating the Impact of LC System Dispersion on the Size-Exclusion Chromatography Analysis of Proteins. Waters Application Note 720006337EN, September 2018.
  6. Patel, B.A.; Gospodarek, A.; Larkin, M.; Kenrick, S.A.; Haverick, M.A.; Tugcu, N.; et al. Multi-Angle Light Scattering as a Process Analytical Technology Measuring Real-Time Molecular Weight for Downstream Process Control. mAbs. 2018, Taylor & Francis.

720006522, April 2019

Zurück zum Seitenanfang Zurück zum Seitenanfang