Analysis of Aminoglycosides in Foods Using a Zwitterionic Stationary Phase and Liquid Chromatography-Tandem Mass Spectrometry
Abstract
The effects of chromatographic conditions, such as mobile phases, pH, and ionic strength (or buffer concentration), on the separation of 17 highly polar aminoglycosides (AMGs) on Atlantis Premier BEH Z-HILIC Columns were systematically investigated. The AMGs included in this study were Amikacin (AMI), Apramycin (APR), Gentamicin (GEN C1, C1a, C2/C2a), Hygromycin B (HYG), Kanamycin (KAN), Kasugamycin (KAS), Neomycin (NEO), Neamine (or Neomycin A, NEO A), Paromomycin (PAR), Ribostamycin (RIB), Spectinomycin (SPC), Streptomycin (STP), Dihydrostreptomycin (DSTP), Sisomicin (SIS), and Tobramycin (TOB). Gradient elution with a binary mobile phase of aqueous 20 mM ammonium formate at pH 3.0 and acetonitrile with 0.1% formic acid provided a reliable and adequate separation with excellent sensitivity for these AMGs by electrospray tandem mass spectrometry (ESI-MS/MS). The extraction of food samples was carried out using a trichloroacetic acid containing solution. A solid phase extraction (SPE) and clean-up procedure was optimized using an Oasis HLB Cartridge. This method was evaluated for milk, beef, pork, liver, and honey samples. Good performance characteristics for sensitivity, accuracy, and precision were obtained for 16 AMGs. The final optimized HILIC-ESI-MS/MS method was demonstrated to be reliable, accurate, and sensitive for the determination of AMGs in food.
Benefits
- Reliable separation of 17 aminoglycosides using an Atlantis Premier BEH Z-HILIC Column
- Sensitive HILIC-MS/MS method that meets regulatory requirements in major markets
- Accurate and reliable determination of AMGs in milk, muscle, liver, and honey
- MS friendly mobile phase with no ion pair reagents nor high concentration buffer
Introduction
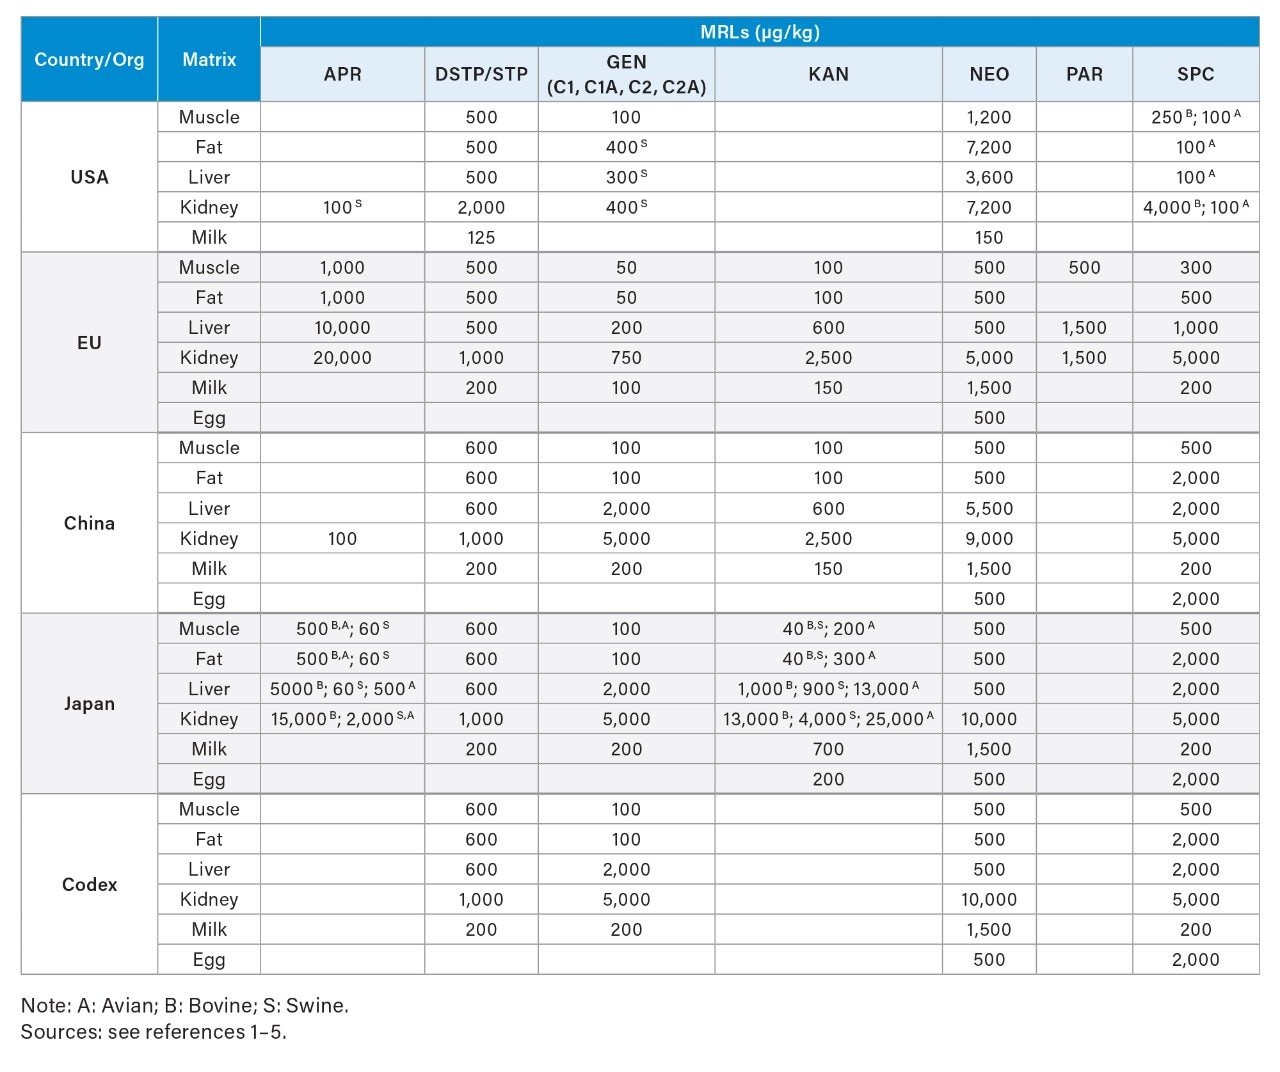
Aminoglycosides (AMGs) are an important class of antibiotics that have been extensively used in both human and veterinary medicine to treat Gram-negative bacterial infections. Extra-label use of AMGs in animal husbandry, such as not observing the withdrawal time after treatment, can lead to a high residue level of AMGs in food. The presence of AMGs in food represents a risk to consumer health due to their toxicity, allergenicity, and possible contribution to antimicrobial resistance. It is important to monitor AMGs content in food to ensure the proper use of AMGs and the safety of food. Maximum Residue Levels (MRLs) for AMGs in foods of animal origin have been established by several countries and international organizations (See Table 1).1–5
AMGs are water soluble, polar compounds. Ion-paring agents have been successfully used in reversed phase liquid chromatography for the analysis of AMGs.6,7 However, due to the practical concerns associated with ion-pairing agents, such as slow equilibration and possible detrimental impacts on other non-ion-pair applications, this approach has seen limited applications.8 Alternatively, AMGs can be analyzed by hydrophilic interaction liquid chromatography (HILIC), but limited separation selectivity for these compounds is observed using amide or aminopropyl HILIC stationary phases.9 It has been reported that zwitterionic stationary phases showed better resolution in separating AMGs compared to amide or aminopropyl columns, but high mobile phase buffer concentrations (up to 175 mM) are needed for some zwitterionic HILIC Columns, which is not a preferable condition for LC-MS analysis.9
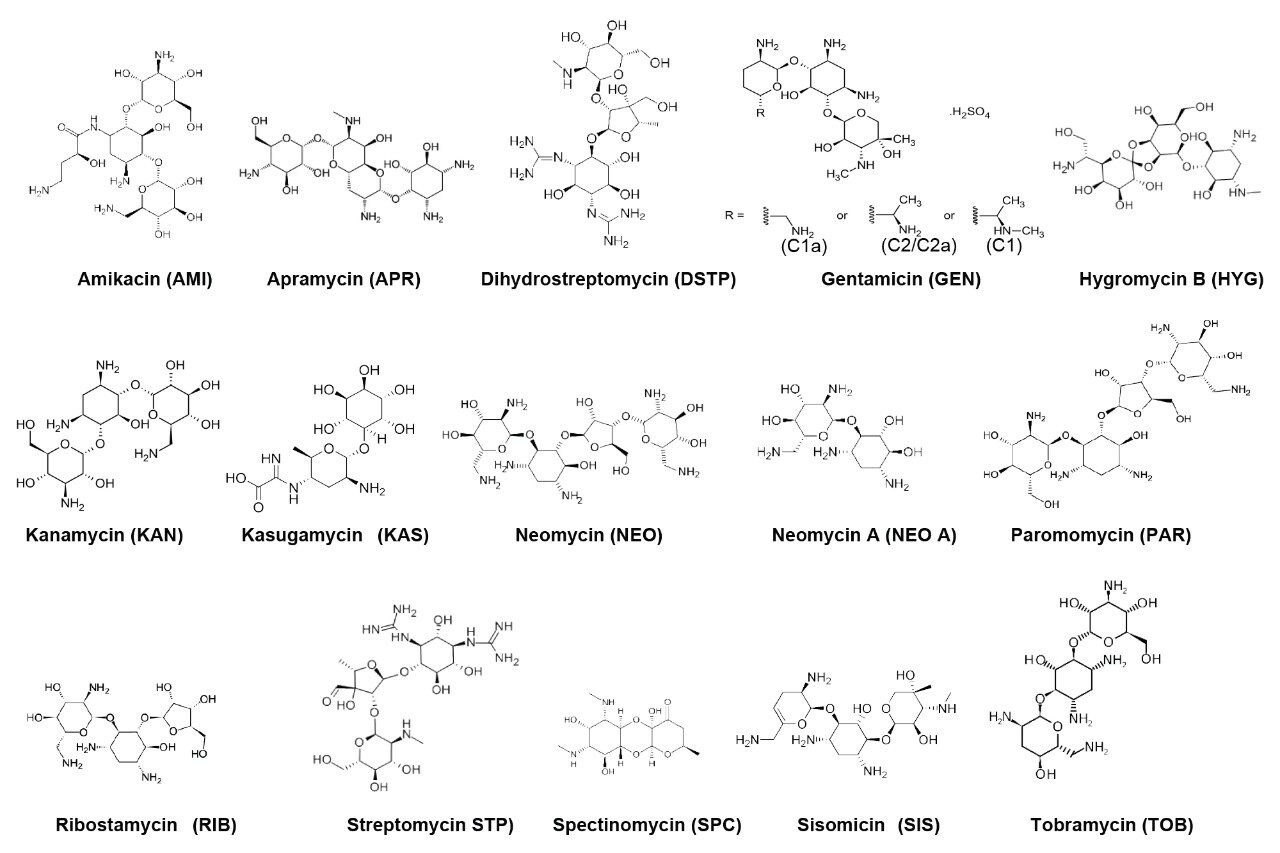
In this study, the Atlantis Premier BEH Z-HILIC Column, which has a zwitterionic sulfoalkylbetaine stationary phase on BEH Particles, was evaluated for the analysis of 17 AMGs in food by Electrospray Tandem Mass Spectrometry (ESI-MS/MS). The AMGs included in this study are Amikacin (AMI), Apramycin (APR), Gentamicin (GEN C1, C1a, C2/C2a), Hygromycin B (HYG), Kanamycin (KAN), Kasugamycin (KAS), Neomycin (NEO), Neamine (or Neomycin A, NEO A), Paromomycin (PAR), Ribostamycin (RIB), Spectinomycin (SPC), Streptomycin (STP), Dihydrostreptomycin (DSTP), Sisomicin (SIS), and Tobramycin (TOB). The structures of these AMGs are shown in Figure 1. The effects of chromatographic conditions on the separation and detection of AMGs were systematically evaluated. A solid phase extraction and cleanup procedure originally used for STP, DSTP, GEN, and NEO was adapted and optimized.10 The method performance was evaluated for milk, muscle, liver, and honey samples.
Experimental
All food samples and AMG standards were prepared using polypropylene (PP) or plastic containers or labware.
Chemicals and Solutions
Amikacin, hygromycin B, ribostamycin sulfate, sisomicin sulfate, gentamicin sulfate, neomycin trisulfate salt hydrate, tobramycin sulfate and kanamycin sulfate were purchased from Sigma–Aldrich (Allentown, PA). Neamine (or neomycin A) hydrochloride, apramycin sulfate, kasugamycin hydrochloride, streptomycin sulfate, paromomycin sulfate, dihydrostreptomycin sulfate, and spectinomycin dihydrochloride hydrate were purchased from Cayman Chemical (Ann Arbor, MI). GEN consists of a mixture of four components, GEN C1, C1a, C2, and C2a. GEN C2 and C2a are stereoisomers. Structures of these AMGs are given in Figure 1.
Stock standard solutions of AMGs (1 mg/mL) were prepared by dissolving standards in deionized water (>18.2 Mohm∙cm). Standard working solution mixtures were prepared by mixing and diluting the stock standards with deionized water. All solutions were stored in PP containers in a freezer (-20 oC). AMI was used as an Internal Standard (IS).
An extraction solution that contained 10 mM Ammonium acetate, 0.4 mM Ethylenediamine tetraacetic acid (EDTA), 0.5% NaCl, and 2% Trichloroacetic acid (TCA) was prepared as follows: place 0.385 g of Ammonium acetate into a 500 mL volumetric flask. Add approximately 450 mL of deionized water and dissolve. After adjusting the pH to 4.0 with reagent Formic acid (FA), add 0.074 g Disodium ethylenediamine tetraacetate dihydrate, 2.5 g of Sodium chloride, and 10 g of TCA to the flask. Mix well to dissolve, and bring to the mark with deionized water.
Sample Description
Milk, muscle (beef and pork), liver (poultry), and honey samples were purchased in local stores. Honey is included in this study because honeybee bacterial infections are treated with AMGs. Honey and milk samples were kept in a refrigerator (0–4 oC), while muscle and liver samples were kept in a freezer (-20 oC).
Sample Extraction and Clean-up
3 g of honey, milk, or ground muscle or minced liver tissue was mixed with 20 mL of extraction solution in a 50 mL PP centrifuge tube. This tube was vortexed at high speed (3200 RPM) for 2 minutes and then placed in a refrigerator for 30 minutes. The sample was vortexed again then centrifuged at 3200 g for 10 minutes at 4 oC. The supernatant was quantitatively transferred to another 50 mL PP centrifuge tube by using a plastic transfer pipette. Using a calibrated pH meter, the supernatant was adjusted to pH 6.75 ± 0.25 with basic solutions (50% and 10% KOH solutions) prior to the solid phase extraction (SPE) and cleanup. The SPE cartridge (Oasis HLB SPE Cartridge, 6 cc Vac Cartridge, 500 mg sorbent, 60 µm. p/n 186000115) was conditioned and equilibrated with 3 mL methanol and 3 mL deionized water prior to the loading of all supernatant (approximately 18 mL). After loading, the cartridge was rinsed with 3 mL deionized water and dried for 15 minutes under vacuum. The analytes were eluted with 3 mL of elution solution (10 v/v% FA, 5 v/v% isopropanol in water). The final extract was analyzed by LC–MS/MS without any reconstitution or dilution. A Waters Extraction (Vacuum) Manifold (186008998) and an Otto SPEcialist Positive Pressure Manifold (725000682) were both used in the SPE cleanup procedure and comparable results were obtained. Comparable results were also obtained using Oasis PRiME HLB Cartridge (p/n 186008718) without the conditioning and equilibration steps.
LC Conditions
|
LC system: |
Arc Premier System with Binary Solvent Manager |
|
|
MS system: |
Xevo TQ-S micro System |
|
|
Run time: |
10.0 minutes |
|
|
Column: |
Atlantis Premier BEH Z-HILIC Column, (2.5 μm, 2.1 × 150 mm, p/n: 186009987) |
|
|
Temperature: |
50 °C |
|
|
Mobile phases: |
A: 20 mM ammonium formate in water (pH 3.0) B: 0.1% FA in acetonitrile |
|
|
Purge solvent: |
Water/acetonitrile (1/9 v/v) mixture |
|
|
Injection volume: |
6.0 µL |
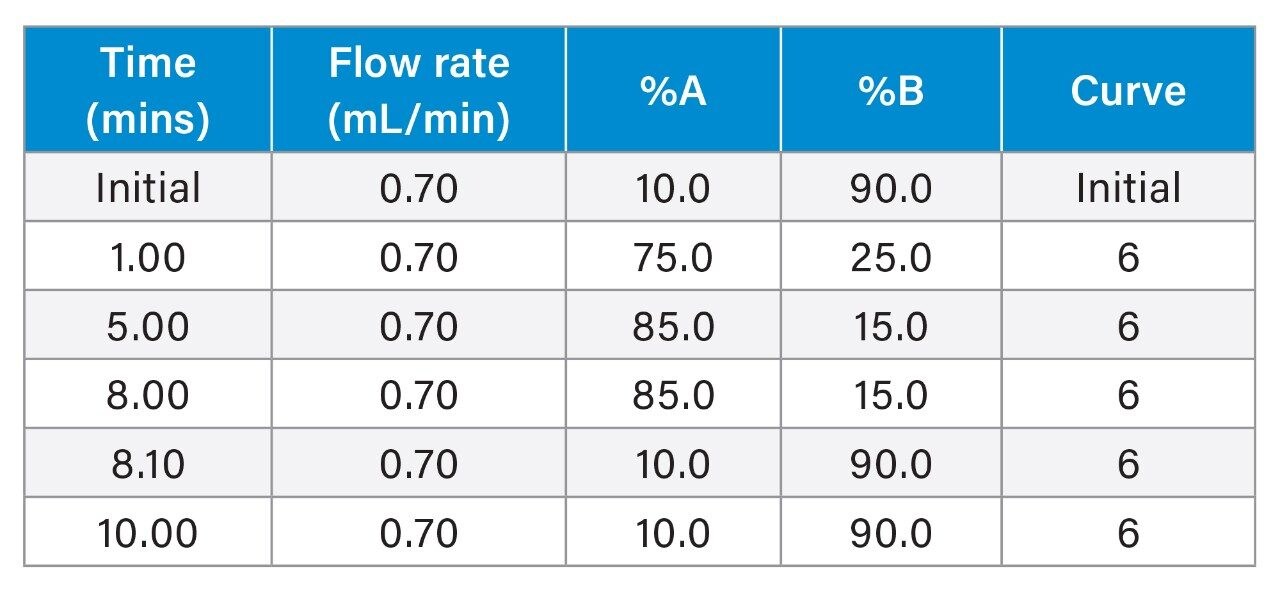
Gradient Table
MS Conditions
|
Software: |
MassLynx v4.2 SCN1017 |
|
|
Polarity: |
ES+ |
|
|
Desolvation temperature: |
600 °C |
|
|
Capillary voltage: |
1.5 kV |
|
|
Cone gas flow: |
50 L/Hr |
|
|
Source temperature: |
150 °C |
|
|
Desolvation gas flow: |
1000 L/Hr |
Results and Discussion
1 Separation of AMGs on Atlantis Premier BEH Z-HILIC Column
The mobile phase aqueous content, pH, and buffer concentration are the main factors in optimizing the separation of AMGs on Atlantis Premier BEH Z-HILIC Columns.
1.1 Effects of mobile phase aqueous content
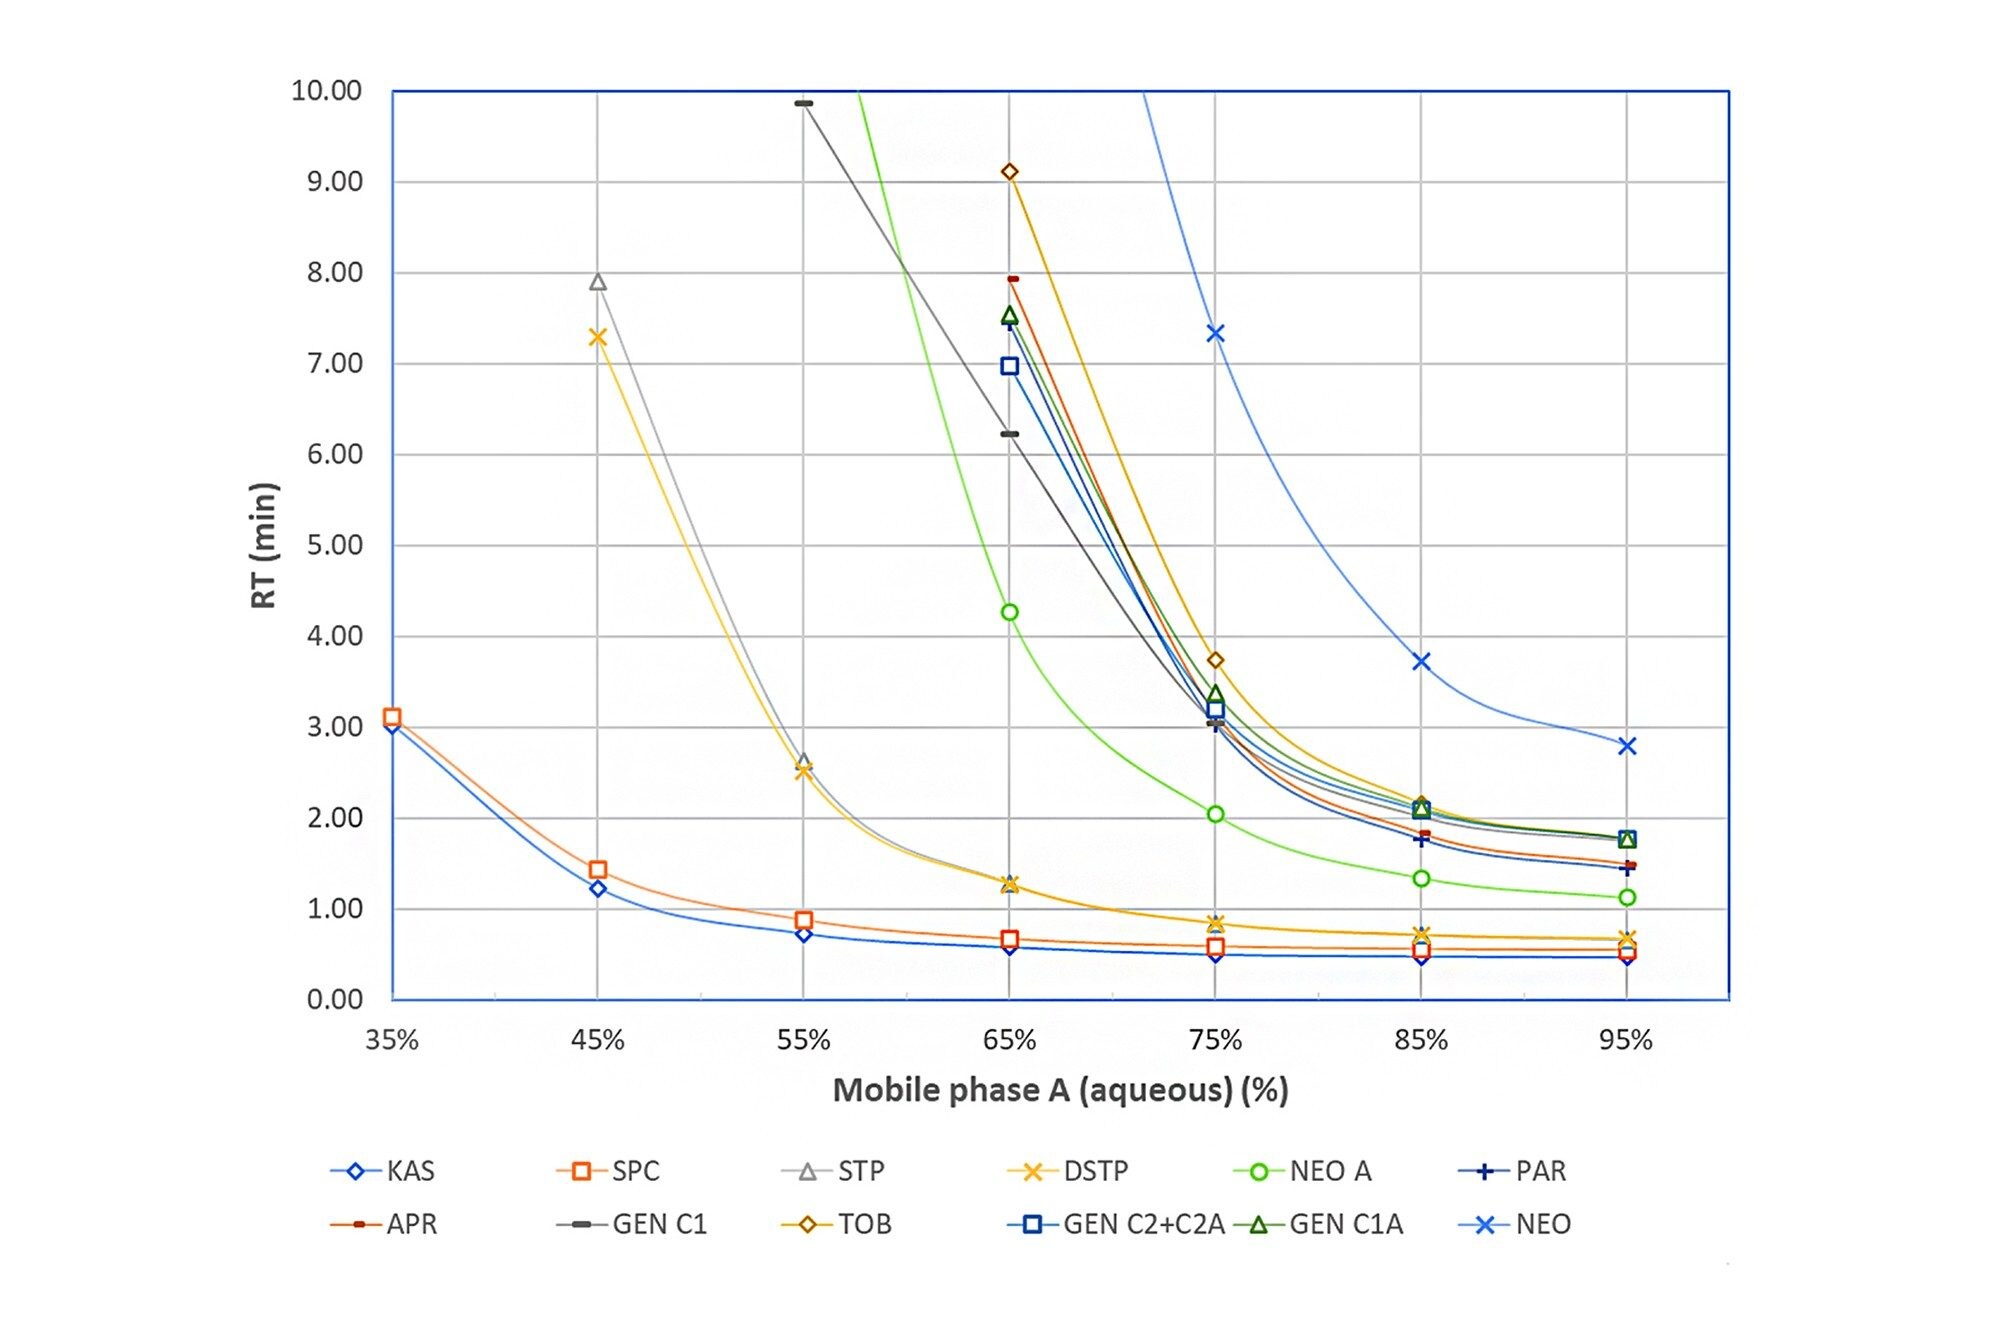
Figure 2 shows the effects of the mobile phase aqueous content on the retention times (RT) of selected AMGs on an Atlantis Premier BEH Z-HILIC Column (2.1 x 100 mm, 1.7 μm) under isocratic elution. The aqueous mobile phase A was 20 mM ammonium formate at pH 3.0 and the mobile phase B was 0.1% FA in acetonitrile. Figure 2 shows that the higher the aqueous content in the mobile phase, the faster the elution (smaller RT).
1.2 Effects of mobile phase pH
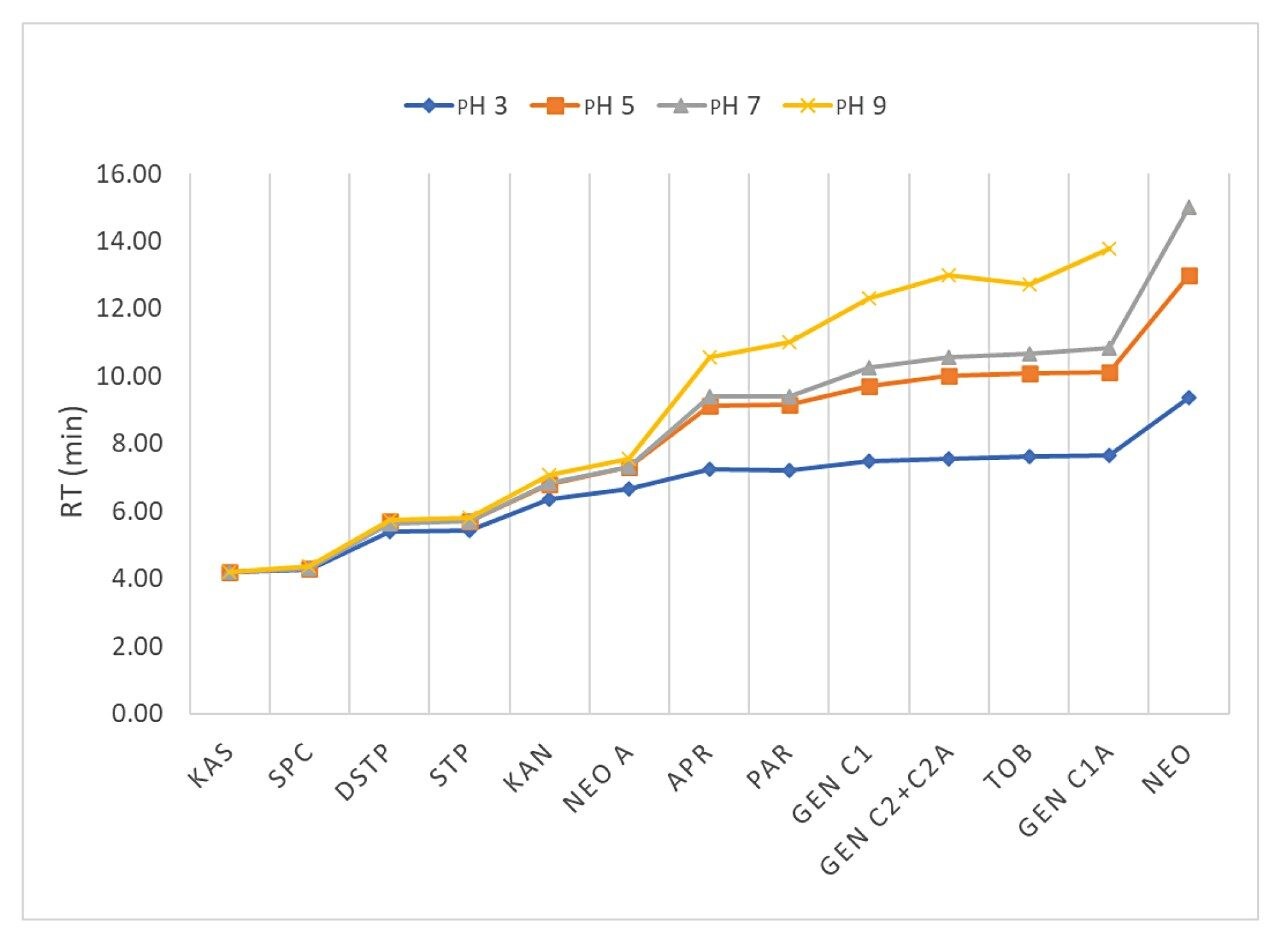
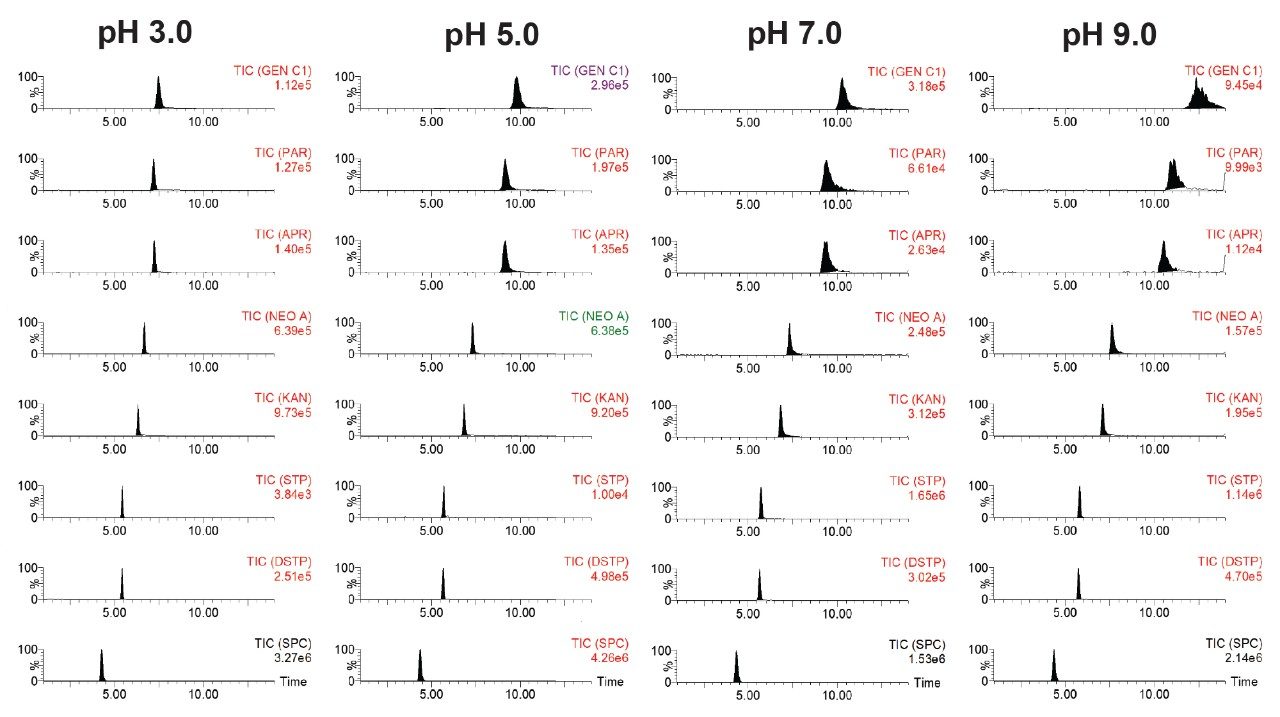
Figure 3 shows the effects of pH of mobile phase A on the RT of selected AMGs on an Atlantis Premier BEH Z-HILIC Column (2.1 x 100 mm, 1.7 μm) under gradient elution in which 20% mobile phase A is increased to 95% A in 5 minutes and is kept at 95% A for 10 minutes. Mobile phase A was aqueous 20 mM ammonium formate at various pH and mobile phase B was acetonitrile with 0.1% FA. The flow rate was 0.2 mL/minute. The column temperature was 40 oC. Figure 3 shows that the late eluting AMGs exhibit a higher dependency on pH. Under high pH conditions, AMGs (weak bases) become less ionized and have stronger hydrophobic interactions with the stationary phase, which leads to higher RT. The peak shape, peak intensity, and resolution are also affected by mobile phase pH. Figure 4 shows chromatograms of selected AMGs under the same conditions as those in Figure 3. With the pH changed from 9 to 3, the peaks, especially the late eluting peaks, become narrower, more symmetric, higher intensity, and better resolved.
1.3 Effects of buffer concentration
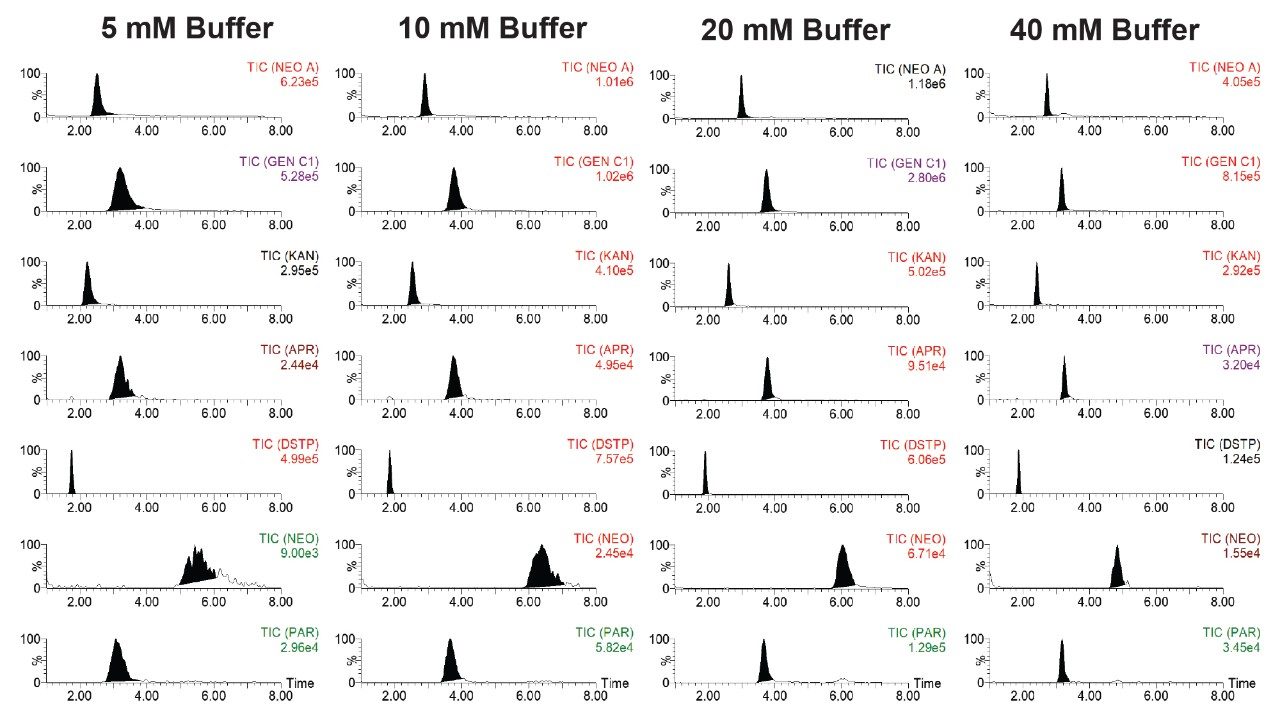
Figure 5 shows the effects of aqueous mobile phase buffer (ammonium formate) concentration on the separation of selected AMGs on an Atlantis Premier BEH Z-HILIC Column (2.1 x 150 mm, 2.5 μm) under flow rate 0.7 mL/minute and column temperature 50 oC. Mobile phase A was aqueous ammonium formate solution at various concentrations (5 mM, 10 mM, 20 mM, and 40 mM) with pH 3.0 and mobile phase B was acetonitrile with 0.1% FA. The elution program was the same as that shown in the Experimental section. The best peak intensity was obtained under buffer concentration of 20 mM.
1.4 Other factors
Other factors such as column temperature and FA concentration in mobile phase B have a limited influence on peak intensity, peak shape, and chromatographic resolution. The Atlantis Premier BEH Z-HILIC Columns with different particle sizes (1.7 μm and 2.5 μm) showed the same trends under various chromatographic conditions (composition, pH, buffer concentration, etc.). The 2.5 μm particle size column (2.1 x 150 mm) was found to allow a higher flow rate (0.7 mL/minute) than the 1.7 μm particle size column (2.1 x 100 mm) under the corresponding gradient elution (0.2 mL/minute), which helps shorten the run time. The 2.5 μm particle size column (2.1 x 150 mm) was used in the final optimized method.
2. Analysis selectivity
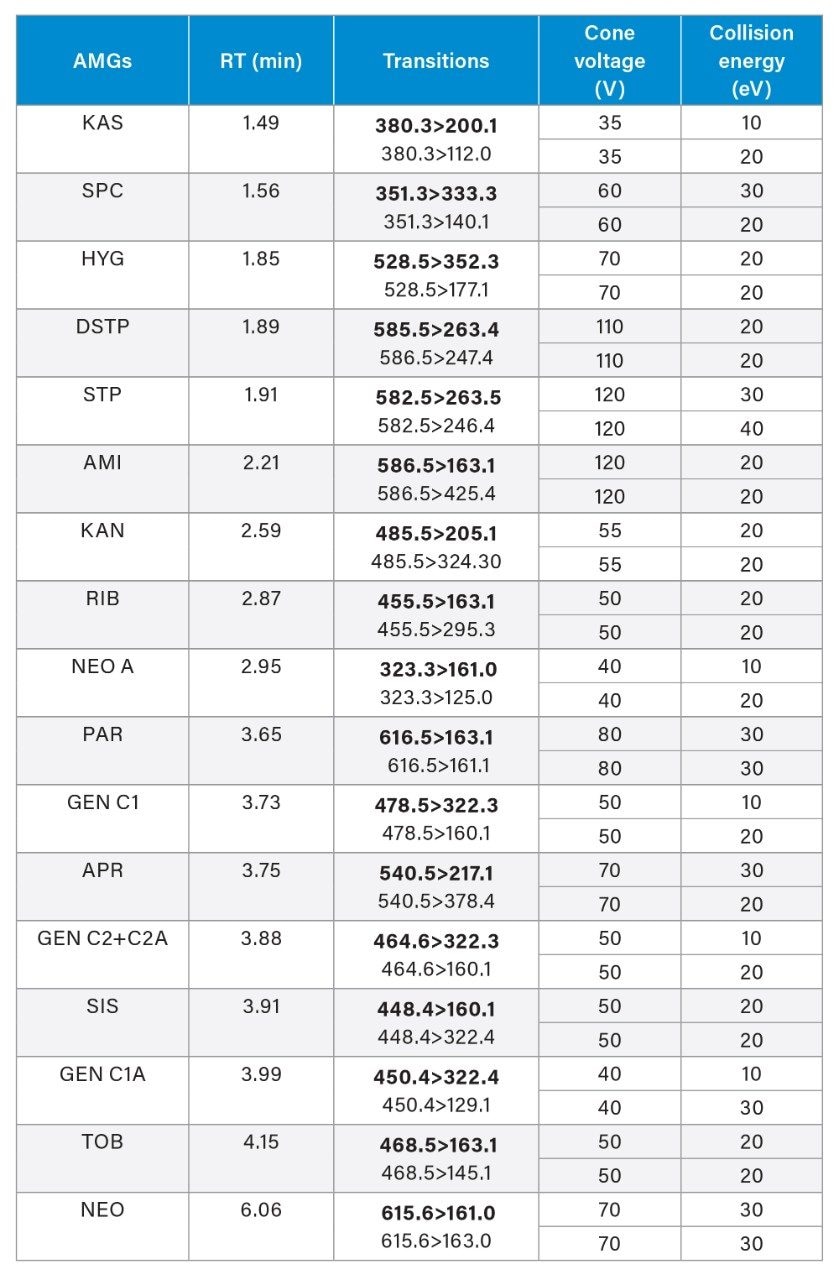
An interference peak from blank muscle samples for SPC has been uncovered. We initially used the MRM transitions of 351>98 and 351>207, which were also used in other reports.9 In our study, we noticed an unknown peak in blank muscle samples at RT 1.62 minutes, which overlapped with the SPC peak (RT 1.56 minutes). The ion ratio of this unknown peak was also different from that of the SPC. To avoid possible interference from this unknown peak, alternative MRM transitions (351>333 and 333>140) for SPC were used in our method and no interference peak from blank samples was found.
In addition, we also optimized the MRM transitions of DSTP to reduce the interference from isotopically substituted STP. STP (MW 581 Da) and DSTP (MW 583 Da) have similar chemical structures and they share the same fragmentation pattern. STP has an isotopic peak that has the same mass as DSTP at a relative abundance of 5.8% (relative to its monoisotopic peak at 581 m/z), which can interfere with the quantification of DSTP. Alternative MRM transitions for DSTP involving its proton adducts of isotopically substituted DSTP are used (MRM 585>263, 586>247), which reduce the interference from STP to DSTP to less than 1% while maintaining an adequate sensitivity for DSTP. It is difficult to completely remove the interference from STP isotopic species.
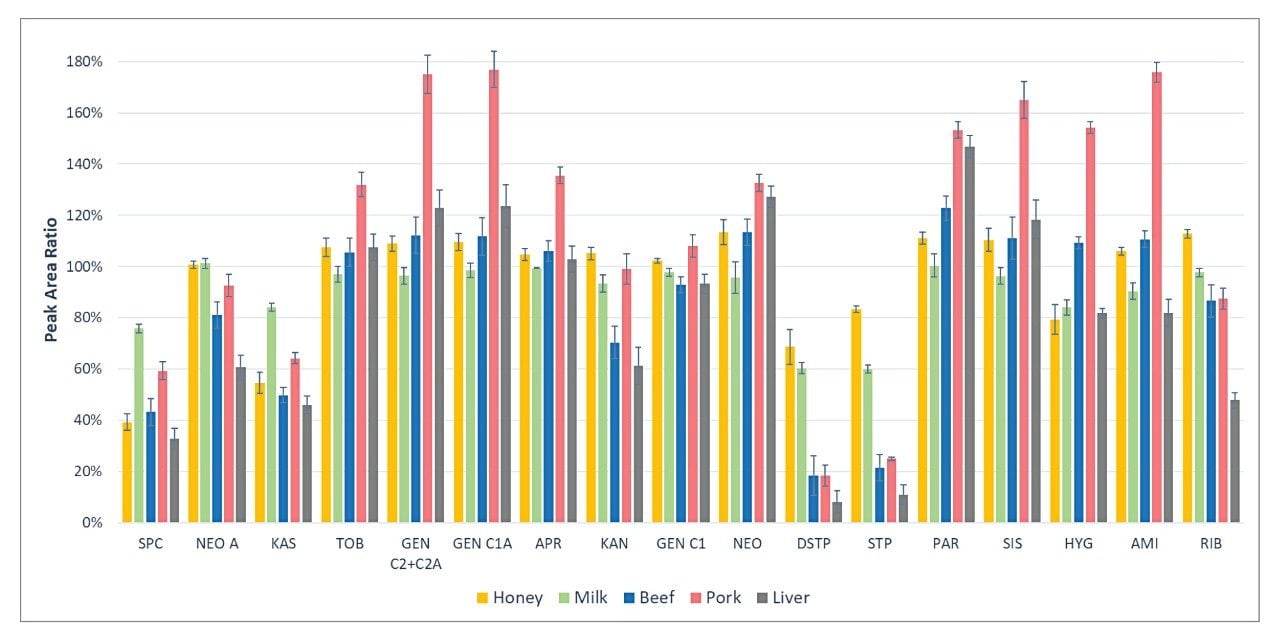
3. Matrix effects
Figure 6 shows the matrix effects in the LC-MS/MS analysis of AMGs. The matrix effects were evaluated by the peak area ratio of blank sample extracts spiked at 1000 μg/kg after SPE cleanup over standards in SPE elution solution at 1000 μg/kg. Diverse levels of matrix effects were observed for these AMGs, from strong ion suppression (ratio as low as less than 20%) to strong ion enhancement (ratio as large as more than 170%). Matrix-matched calibration is required for the AMG quantification.
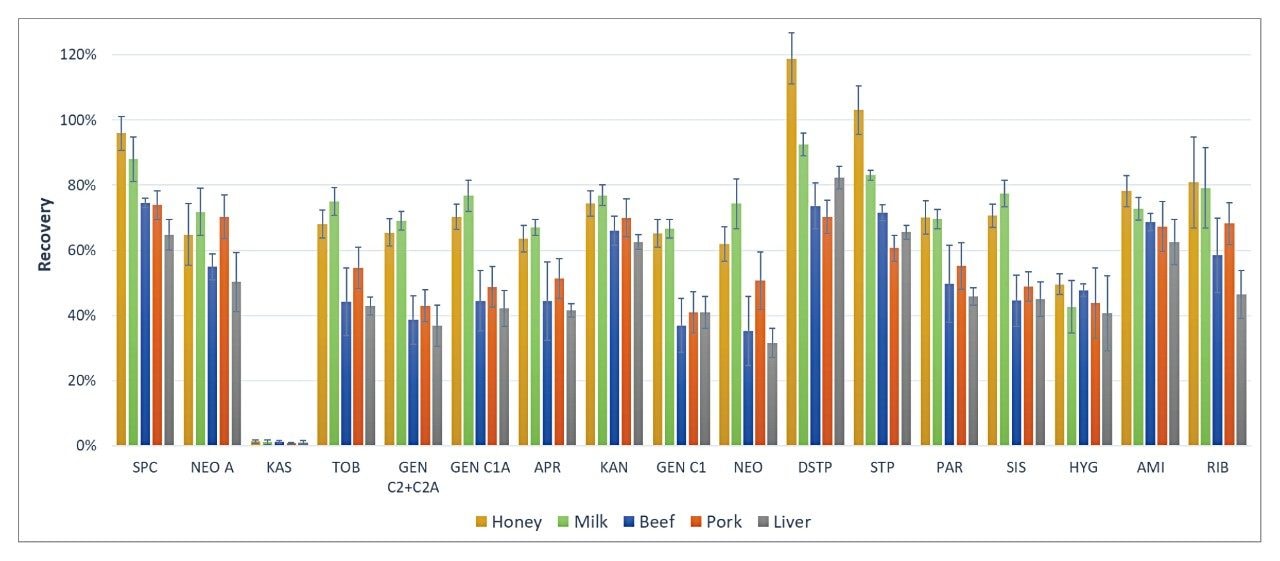
4. SPE recovery
Recoveries were calculated by the peak area ratio of blank samples spiked at the beginning of sample preparation over blank samples spiked after SPE cleanup (see Figure 7). The spiking level was 1000 μg/kg. The recoveries for most of the AMGs (except KAS) in all five samples (honey, milk, beef, pork, and liver) ranged from about 40% to 100%, which is comparable to the results reported in similar food matrices.7,9 KAS was found to have poor recovery. This has something to do with its low pKa value (pKa1 of 3.23) as compared to other AMGs, which have pKa values of about 7 and above. KAS exists in its ionized form in the SPE loading solution (pH adjusted to 6.75± 0.25) and is not retained by the Oasis HLB Sorbents.
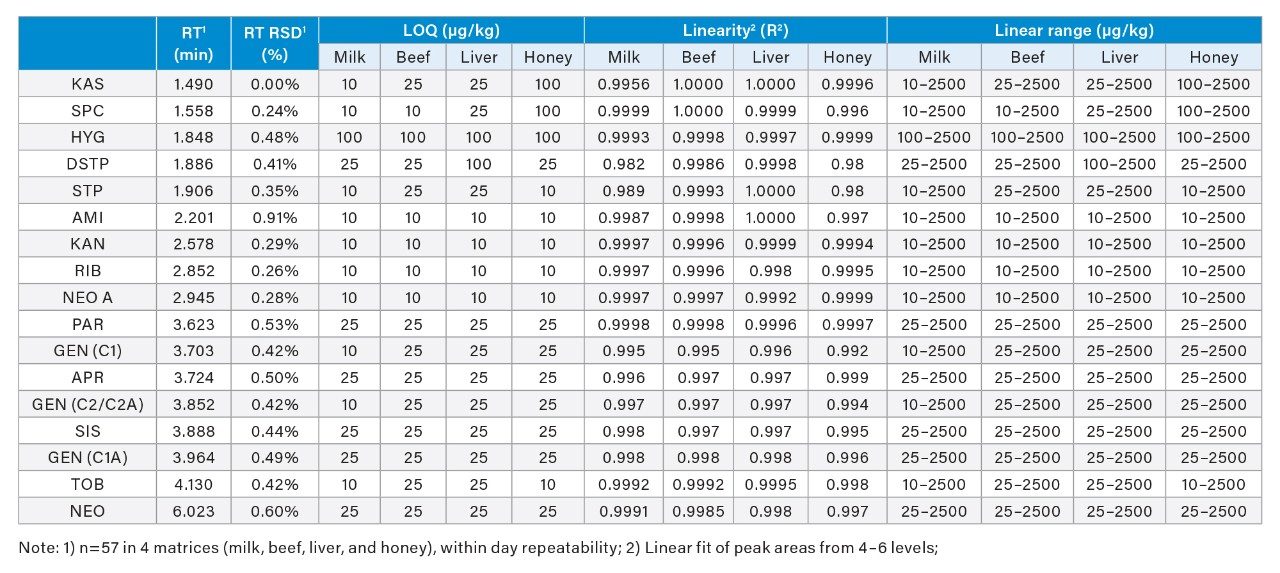
5. LC-MS/MS method performance characteristics
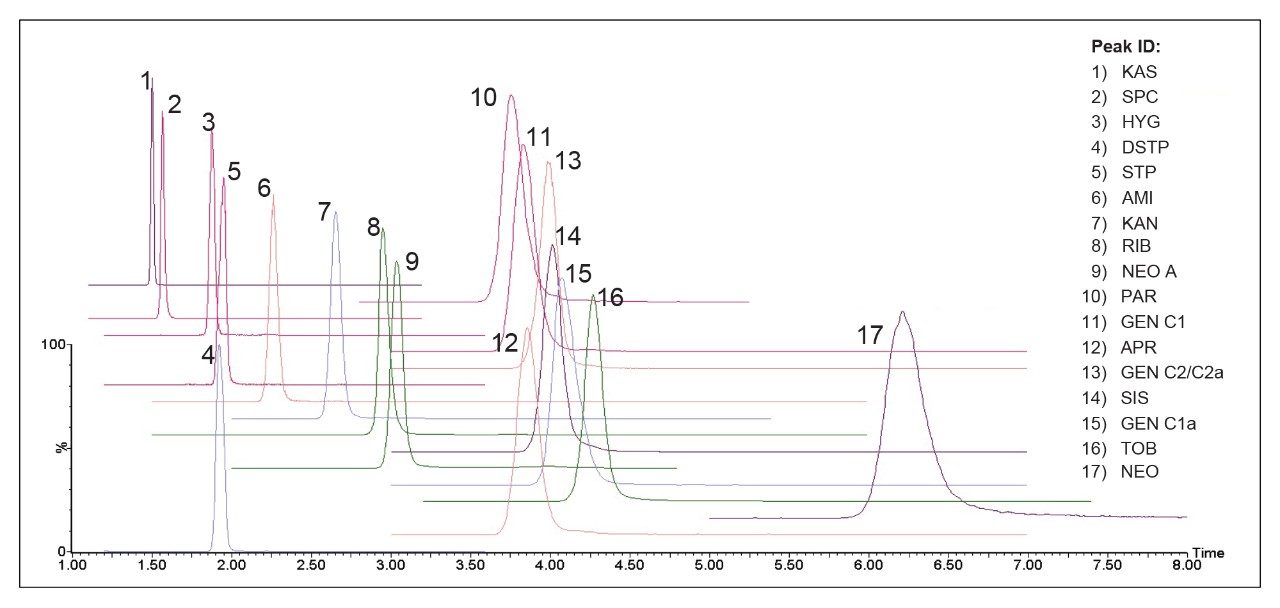
The optimized LC-MS/MS method was evaluated for milk, beef, liver, and honey samples. The limits of quantification (LOQ), coefficient of determination (R2), linear ranges, RT, and RT precision in each food matrix are presented in Table 3. LOQ values were estimated using blank samples spiked (post-SPE spike) at low concentrations at which the signal to noise ratios (S/N) were at least 10 or the lowest concentrations in the calibration curves, whichever was higher. The LOQ values in these foods are well below the MRLs established in the major markets as shown in Table 1. The R2 values were obtained from matrix-matched standards (post-SPE spike) at 4 – 6 concentration levels. Excellent linearity (R2>0.99) was obtained in most food matrices. The relative standard deviations (RSD) in RT were obtained from solvent standards, matrix-matched standards, and spiked samples (n=57, within day precision). Excellent RT repeatability for all AMGs was demonstrated (RSD less than 1.0 %). Figure 8 shows an overlay of chromatograms for 17 AMGs in a blank milk sample spiked at 2500 𝜇g/kg. The capacity factor (k’) of the earliest peak (KAS) was 2.6.
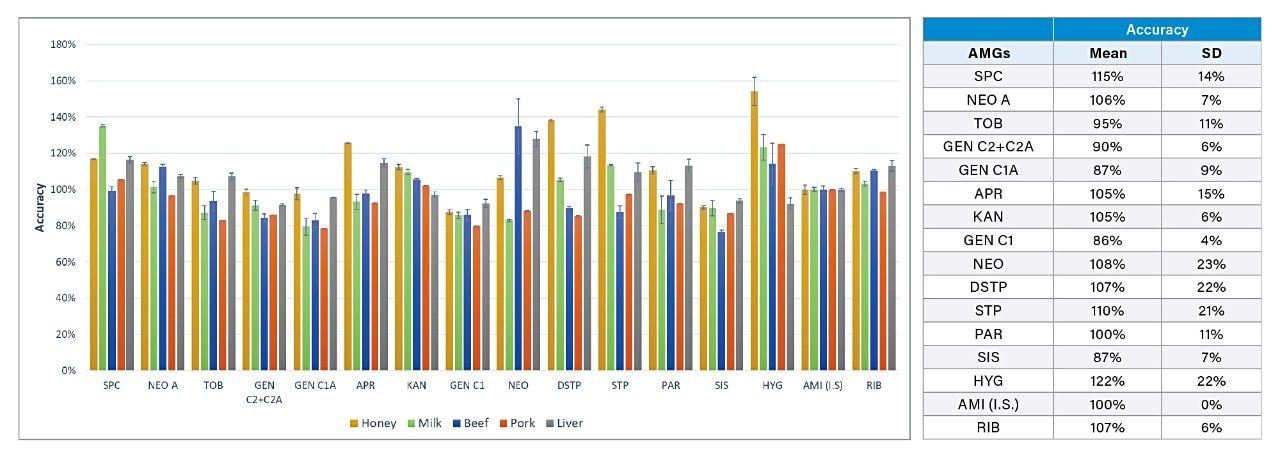
The method accuracy was evaluated by measuring blank honey, milk, beef, pork, and liver samples spiked at the 200 𝜇g/kg level. Accuracy was calculated as the ratio between the determined concentration and the spiked concentration (Figure 9). AMI was used as an internal standard. Blank samples spiked at 1000 𝜇g/kg level were used as a calibrant in the corresponding matrices (single point calibration). The average accuracy from 5 samples for each AMG and the standard deviation (SD) in recovery are also shown in Figure 9. The mean accuracies range from 86% to 122% with SD ranging from 4% to 23%. These results are in line with those reported for similar food matrices.7,9 8 food samples have been analyzed. No AMG was found in these samples.
6. Discussion
AMGs share similar structures and it is difficult to separate them. The Atlantis Premier BEH Z-HILIC Column provides a good resolution for 17 AMGs under the optimized chromatographic conditions which include an aqueous mobile phase with 20 mM ammonium format at pH 3.0. Other sulfoalkylbetaine stationary phases require a much higher buffer concentration (up to 175 mM ammonium formate),9 which is not a suitable condition for MS detection. The reason for the difference in the optimal buffer concentration is unknown, but it is believed to be related to the BEH particle, which has a reduced silanol activity over silica particle. KAS was not included in the final method because it was not retained well by SPE. However, it could be analyzed directly by using the extract prior to the SPE cleanup.
Conclusion
The effects of chromatographic conditions, including mobile phase composition, buffer concentration, and pH, on the separation of AMGs on the Atlantis Premier BEH Z-HILIC Column have been systematically investigated. Unlike other zwitterionic sulfoalkylbetaine stationary phases with which high concentrations of ammonium formate up to 175 mM are required, the Atlantis Premier BEH Z-HILIC Column achieves adequate separation and excellent sensitivity for 17 common AMGs in a gradient elution with aqueous 20 mM ammonium formate at pH 3.0 and acetonitrile with 0.1% FA in a 10 minute run. The Oasis HLB SPE Cartridge provided satisfactory cleanup and recoveries for 16 AMGs. The optimized LC-MS/MS method based on the Atlantis Premier BEH Z-HILIC Column and Oasis HLB Cartridge was evaluated for milk, muscle, liver, and honey samples. Excellent sensitivity, good accuracy, and precision were all obtained. This demonstrates that this HILIC-MS/MS method provides a good solution for the screening and quantification of AMGs in foods.
References
- Tolerances for Residues of New animal Drugs in Food. 21 C.F.R. § 556 (2020) Code of Federal Regulations, revised as of April 1, 2020, 21CFR556. Website: https://www.accessdata.fda.gov/scripts/cdrh/cfdocs/cfcfr/CFRSearch.cfm?CFRPart=556&showFR=1.
- Commission regulation (EU) No 37/2010 of 22 December 2009 on Pharmacologically Active Substances and Their Classification Regarding Maximum Residue Limits in Foodstuffs of Animal Origin. Official J. European Union L15, 20.1.2010.
- National Food Safety Standard on Maximum Residue Limits for Veterinary Drugs in Foods (GB 31650-2019), issued on Sept 6, 2019. Effective on April 1st, 2020. Ministry of Agriculture and Rural Affairs, China.
- The Japan Food Chemical Research Foundation, Positive List System – Antibiotics. Website: https://www.ffcr.or.jp/en/zanryu/the-japanese-positive/positive-list-system---antibiotics.html.
- Maximum Residue Limits (MRLs) and Risk Management Recommendations (RMRs) for Residues of Veterinary Drugs in Foods CX/MRL 2-2018, Codex Alimentarius International Food Standards, Food and agriculture Organization of the United Nations, World Health Organization. Website: http://www.fao.org/fao-who-codexalimentarius/codex-texts/dbs/vetdrugs/veterinary-drugs/en/
- Screening for Aminoglycosides by LC/MS-MS, USDA Food Safety and Inspection Service, Office of Public Health Science, CLG-AMG4.03, effective: Nov 2nd, 2020.
- Glinka, M., Wojnowski, W., Wasik, A., Determination of Aminoglycoside Antibiotics: Current Status and Future Trends. Trends in Analytical Chemistry 131 (2020) 116034.
- Dolan, J. Ion pairing – Blessing or Curse? LCGC Europe, 2008; Volume 21, Issue 5, pp 258-263.
- Díez C, Guillarme D, Staub Spörri A, Cognard E, Ortelli D, Edder P, Rudaz S. Aminoglycoside Analysis in Food of Animal Origin With a Zwitterionic Stationary Phase and Liquid Chromatography-Tandem Mass Spectrometry. Anal Chim Acta. 2015; 882:127-39.
- Young, M.S, van Tran, K., Goh, E., and Shia, J.C., UPLC/MS-MS Determination of Aminoglycoside Antibiotics in Meat and Milk, Waters Application Note 720004512EN, 2012.
720007442, December 2021