Fast, High-Resolution Analysis of Polydimethylsiloxanes in Toluene with Advanced Polymer Chromatography Coupled to Refractive Index Detection
Abstract
Size exclusion chromatography (SEC) or gel permeation chromatography (GPC) analysis has been a common polymer analysis technique for more than 50 years. Some of the new advances that have made this technique more easily accomplished are a vast array of columns, new solvent delivery systems, and more detector choices. A new SEC/GPC column technology was developed to withstand the higher pressures of the UPLC™ systems available, and this led to the development of a high-speed/high-resolution GPC system in 2013. Polymer molecular weight (MW) analysis became a modernized technique with a flexible solvent delivery system and low-dispersion detectors. An example of this high-speed MW analysis was demonstrated with polydimethylsiloxane (PDMS) dissolved in toluene, which decreased analysis time to 15-minutes: an efficiency advantage of four times faster when compared to traditional SEC methods.
Benefits
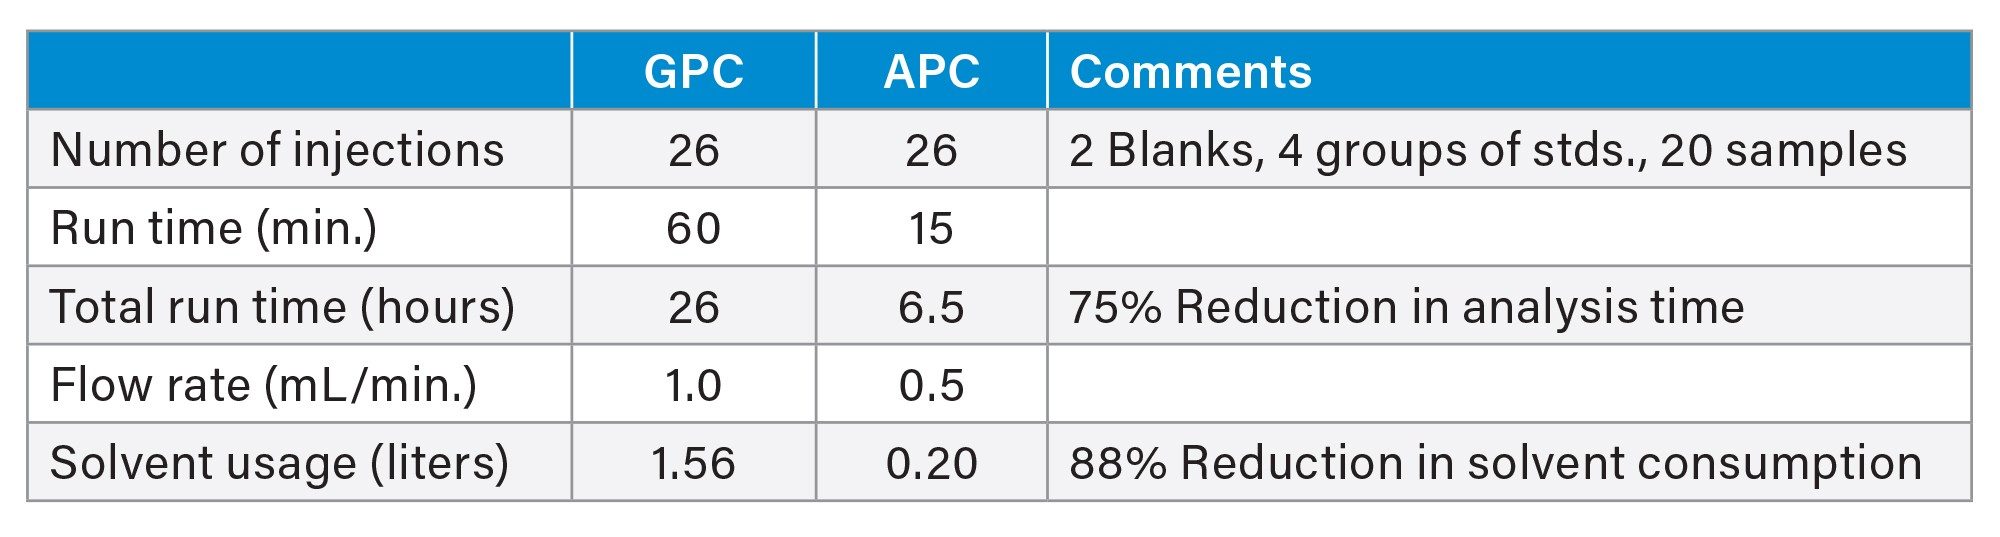
- Speed of Analysis - ACQUITY™ Advanced Polymer Chromatography System (APC™) offers a four times faster SEC analysis of PDMS in fifteen minutes compared to traditional SEC separation of 45–60 minutes1
- Cost Reduction - Lower analysis cost by reducing solvent consumption and waste disposal volumes
- System Flexibility - Having a quaternary pump allows the user to analyze polymers with different organic solvents within one sample set in isocratic or gradient mode. APC XT Column technology allows solvent changes to occur quickly and without damage to the column2, 3
Introduction
Polydimethylsiloxane (PDMS), also known as dimethylpolysiloxane or dimethicone, belongs to a group of polymeric compounds that are commonly referred to as silicones.4 PDMS is the most widely used silicon-based organic polymer due to its properties leading to many versatile applications.5 PDMS has interesting flow, specifically rheological and thermal properties.6 Most PDMS polymers are optically clear, and they are generally inert, non-toxic, and non-flammable. This polymer forms many finished products such as silicone oil, contact lenses, medical devices, and elastomers. PDMS polymers are also used in cosmetics and foods, of which two examples are shampoos and food packaging. PDMS is also used in material science applications such as electronics, architecture, and machining.7
The MW distribution of PDMS can offer meaningful insight into the processing and performance of final products. The first step in a SEC analysis is dissolving the polymer completely in an appropriate mobile phase. The most common solvent for dissolving polymers is tetrahydrofuran (THF), but not all siloxane polymers are soluble in THF. Polymers can also have a refractive index very close to the refractive index of the dissolution solvent, which causes a lower RI detector response. Toluene is chosen for dissolving PDMS polymers, when THF causes iso-refractive issues or poor solubility performance.
The goal of this application is to evaluate the APC System for analysis of PDMS in Toluene in fifteen minutes or less per injection. Traditional SEC/GPC has a typical analysis time of 45–60 minutes per injection. A faster, higher resolved SEC data analysis of PDMS can improve the workflow of synthesis, processing, and final product when compared to legacy SEC applications.
Experimental
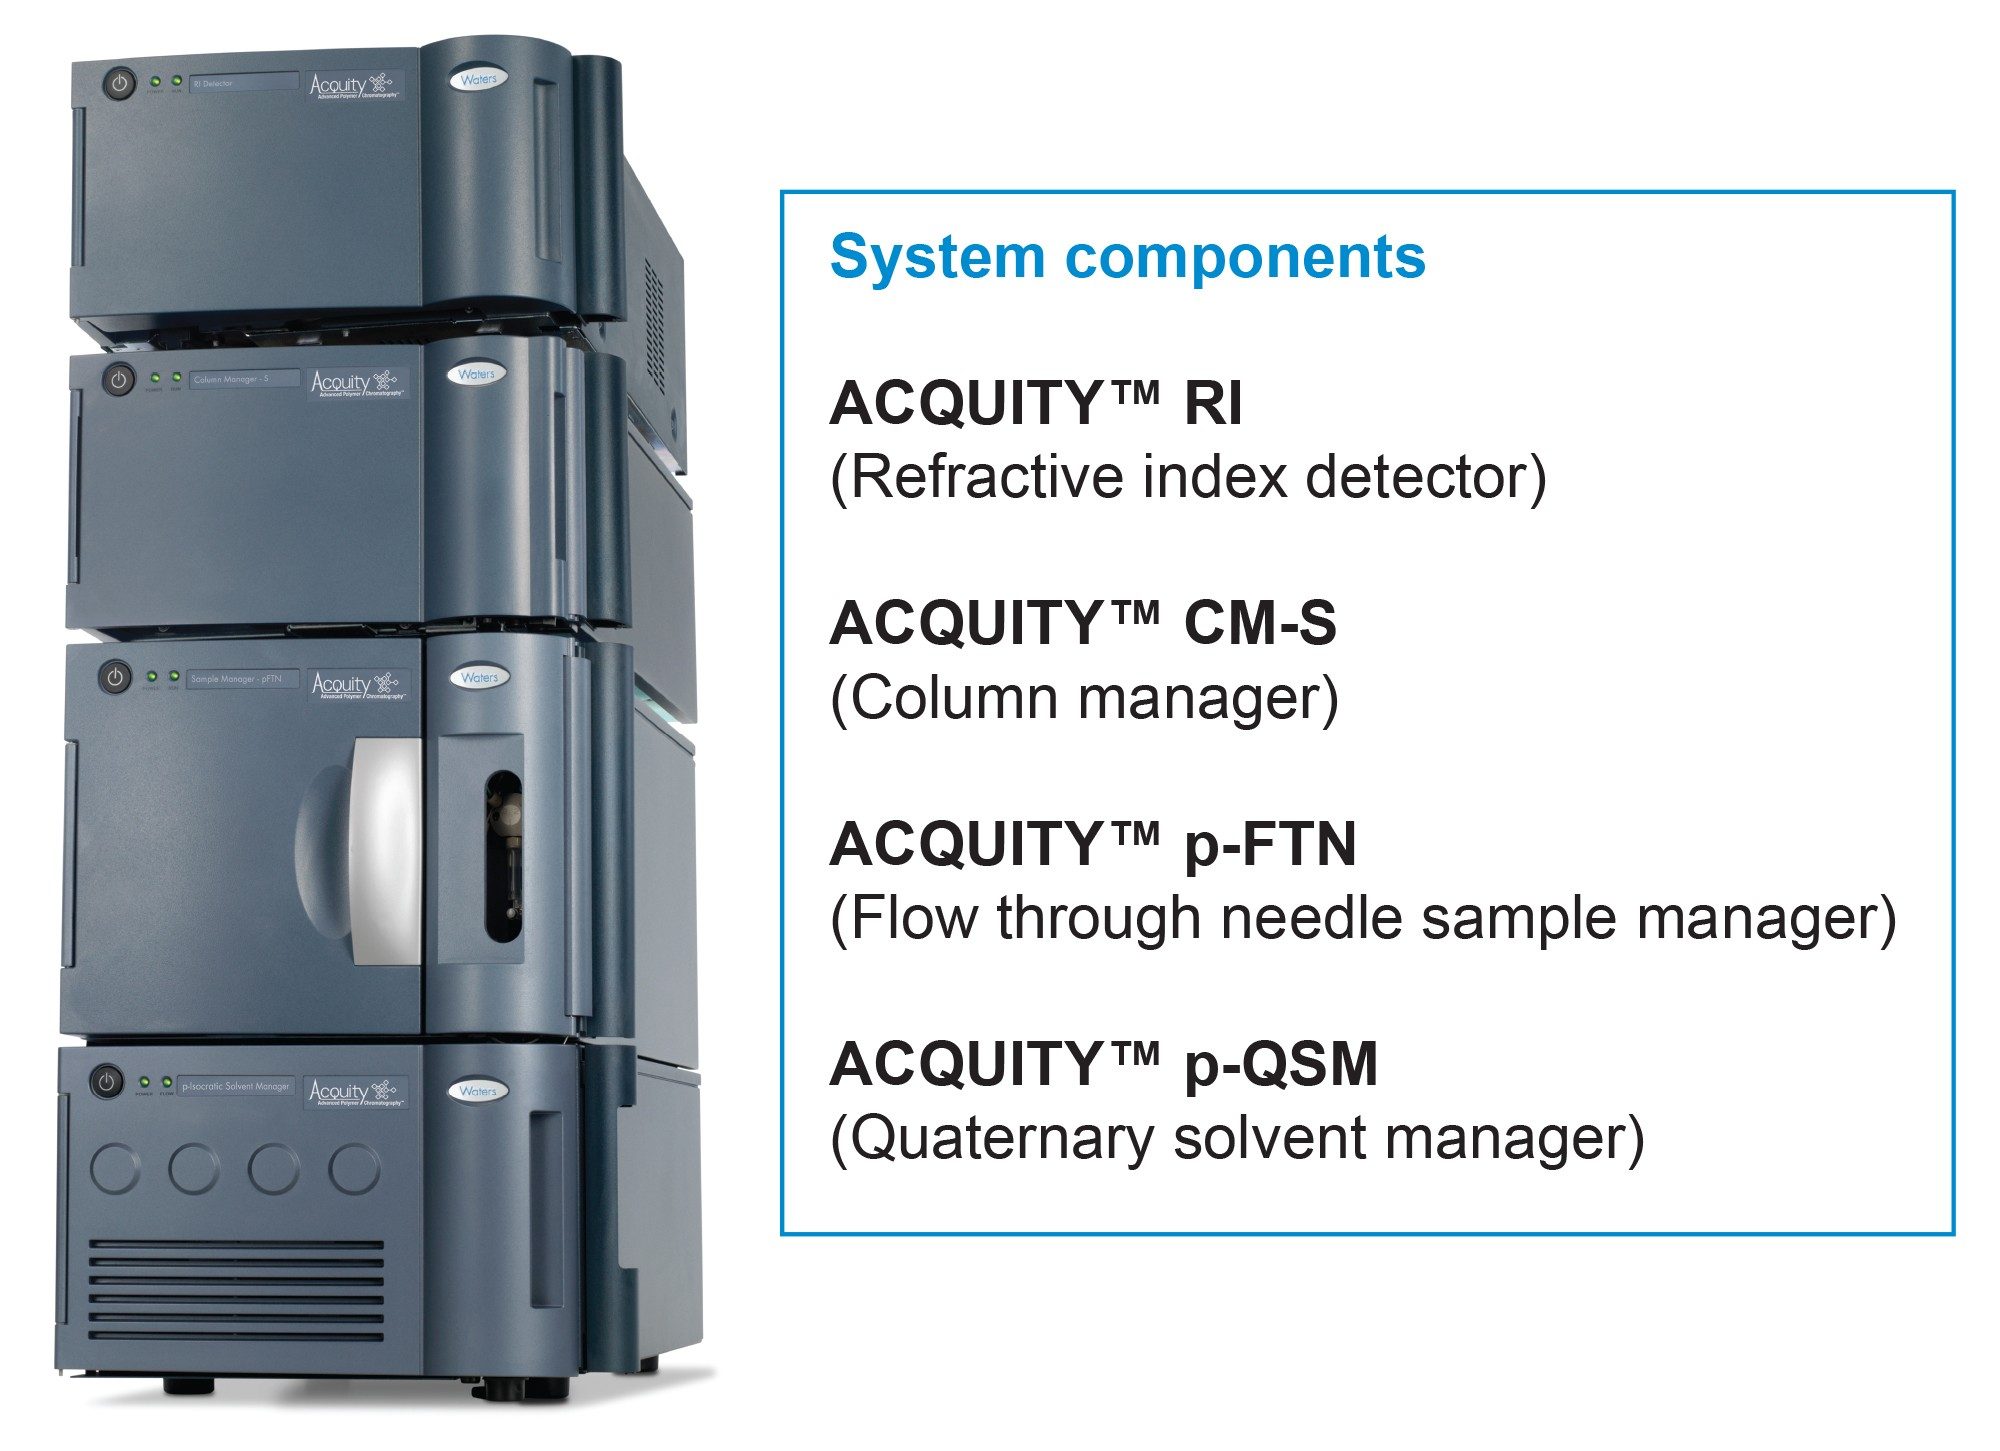
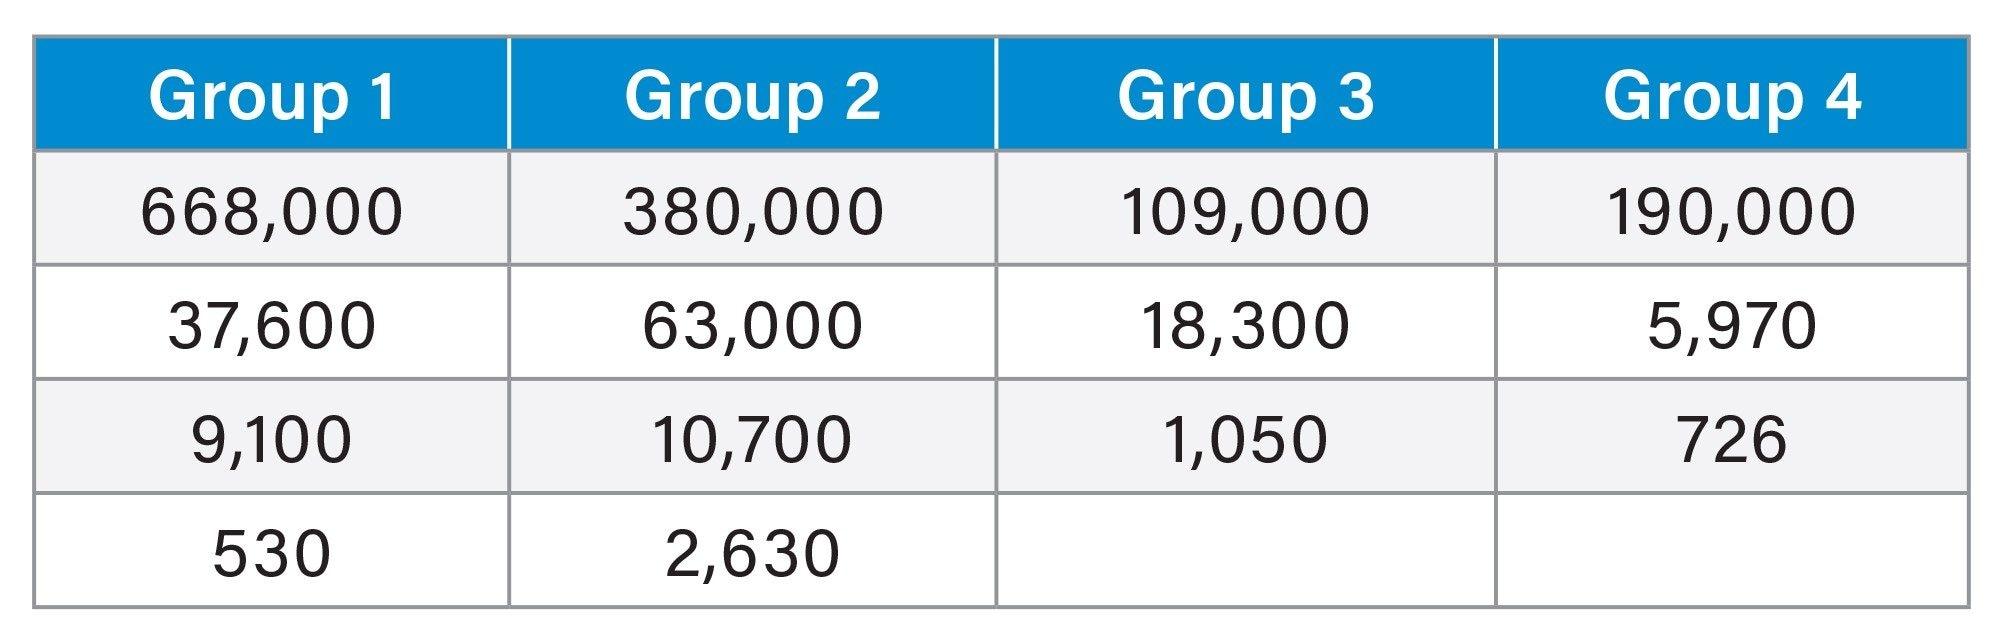
The APC System is described in Figure 1. Toluene was used to dissolve polystyrene (PS) standards (Table 1) and PDMS samples (Table 2). Four columns were used in series to form an SEC Column bank described in Table 2.
|
Chromatographic system: |
ACQUITY Advanced Polymer Chromatography System |
|
Pump: |
Quaternary Solvent Manager |
|
Sample manager temp.: |
20 °C |
|
Column manager temp.: |
50 °C |
|
Columns: |
ACQUITY APC XT 450 Å 2.5 µm (4.6 x 150 mm), 200 Å 2.5 µm (4.6 x 75 mm), 125 Å 2.5 µm (4.6 x 75 mm), 45 Å 1.7 µm (4.6 x 150 mm) |
|
Column temp.: |
50 °C |
|
Solvent: |
Toluene |
|
Wash solvent: |
Toluene |
|
Seal wash: |
Isopropanol |
|
Flow rate: |
0.5 mL/min |
|
Samples preparation: |
PS Stds. (3 mg/mL), Samples (5 mg/mL) |
|
Injection volume: |
PS Stds. (10 µL), Samples (40 µL) |
|
Detector: |
RI |
|
Detector temp.: |
50 °C |
Table 2. LC Conditions
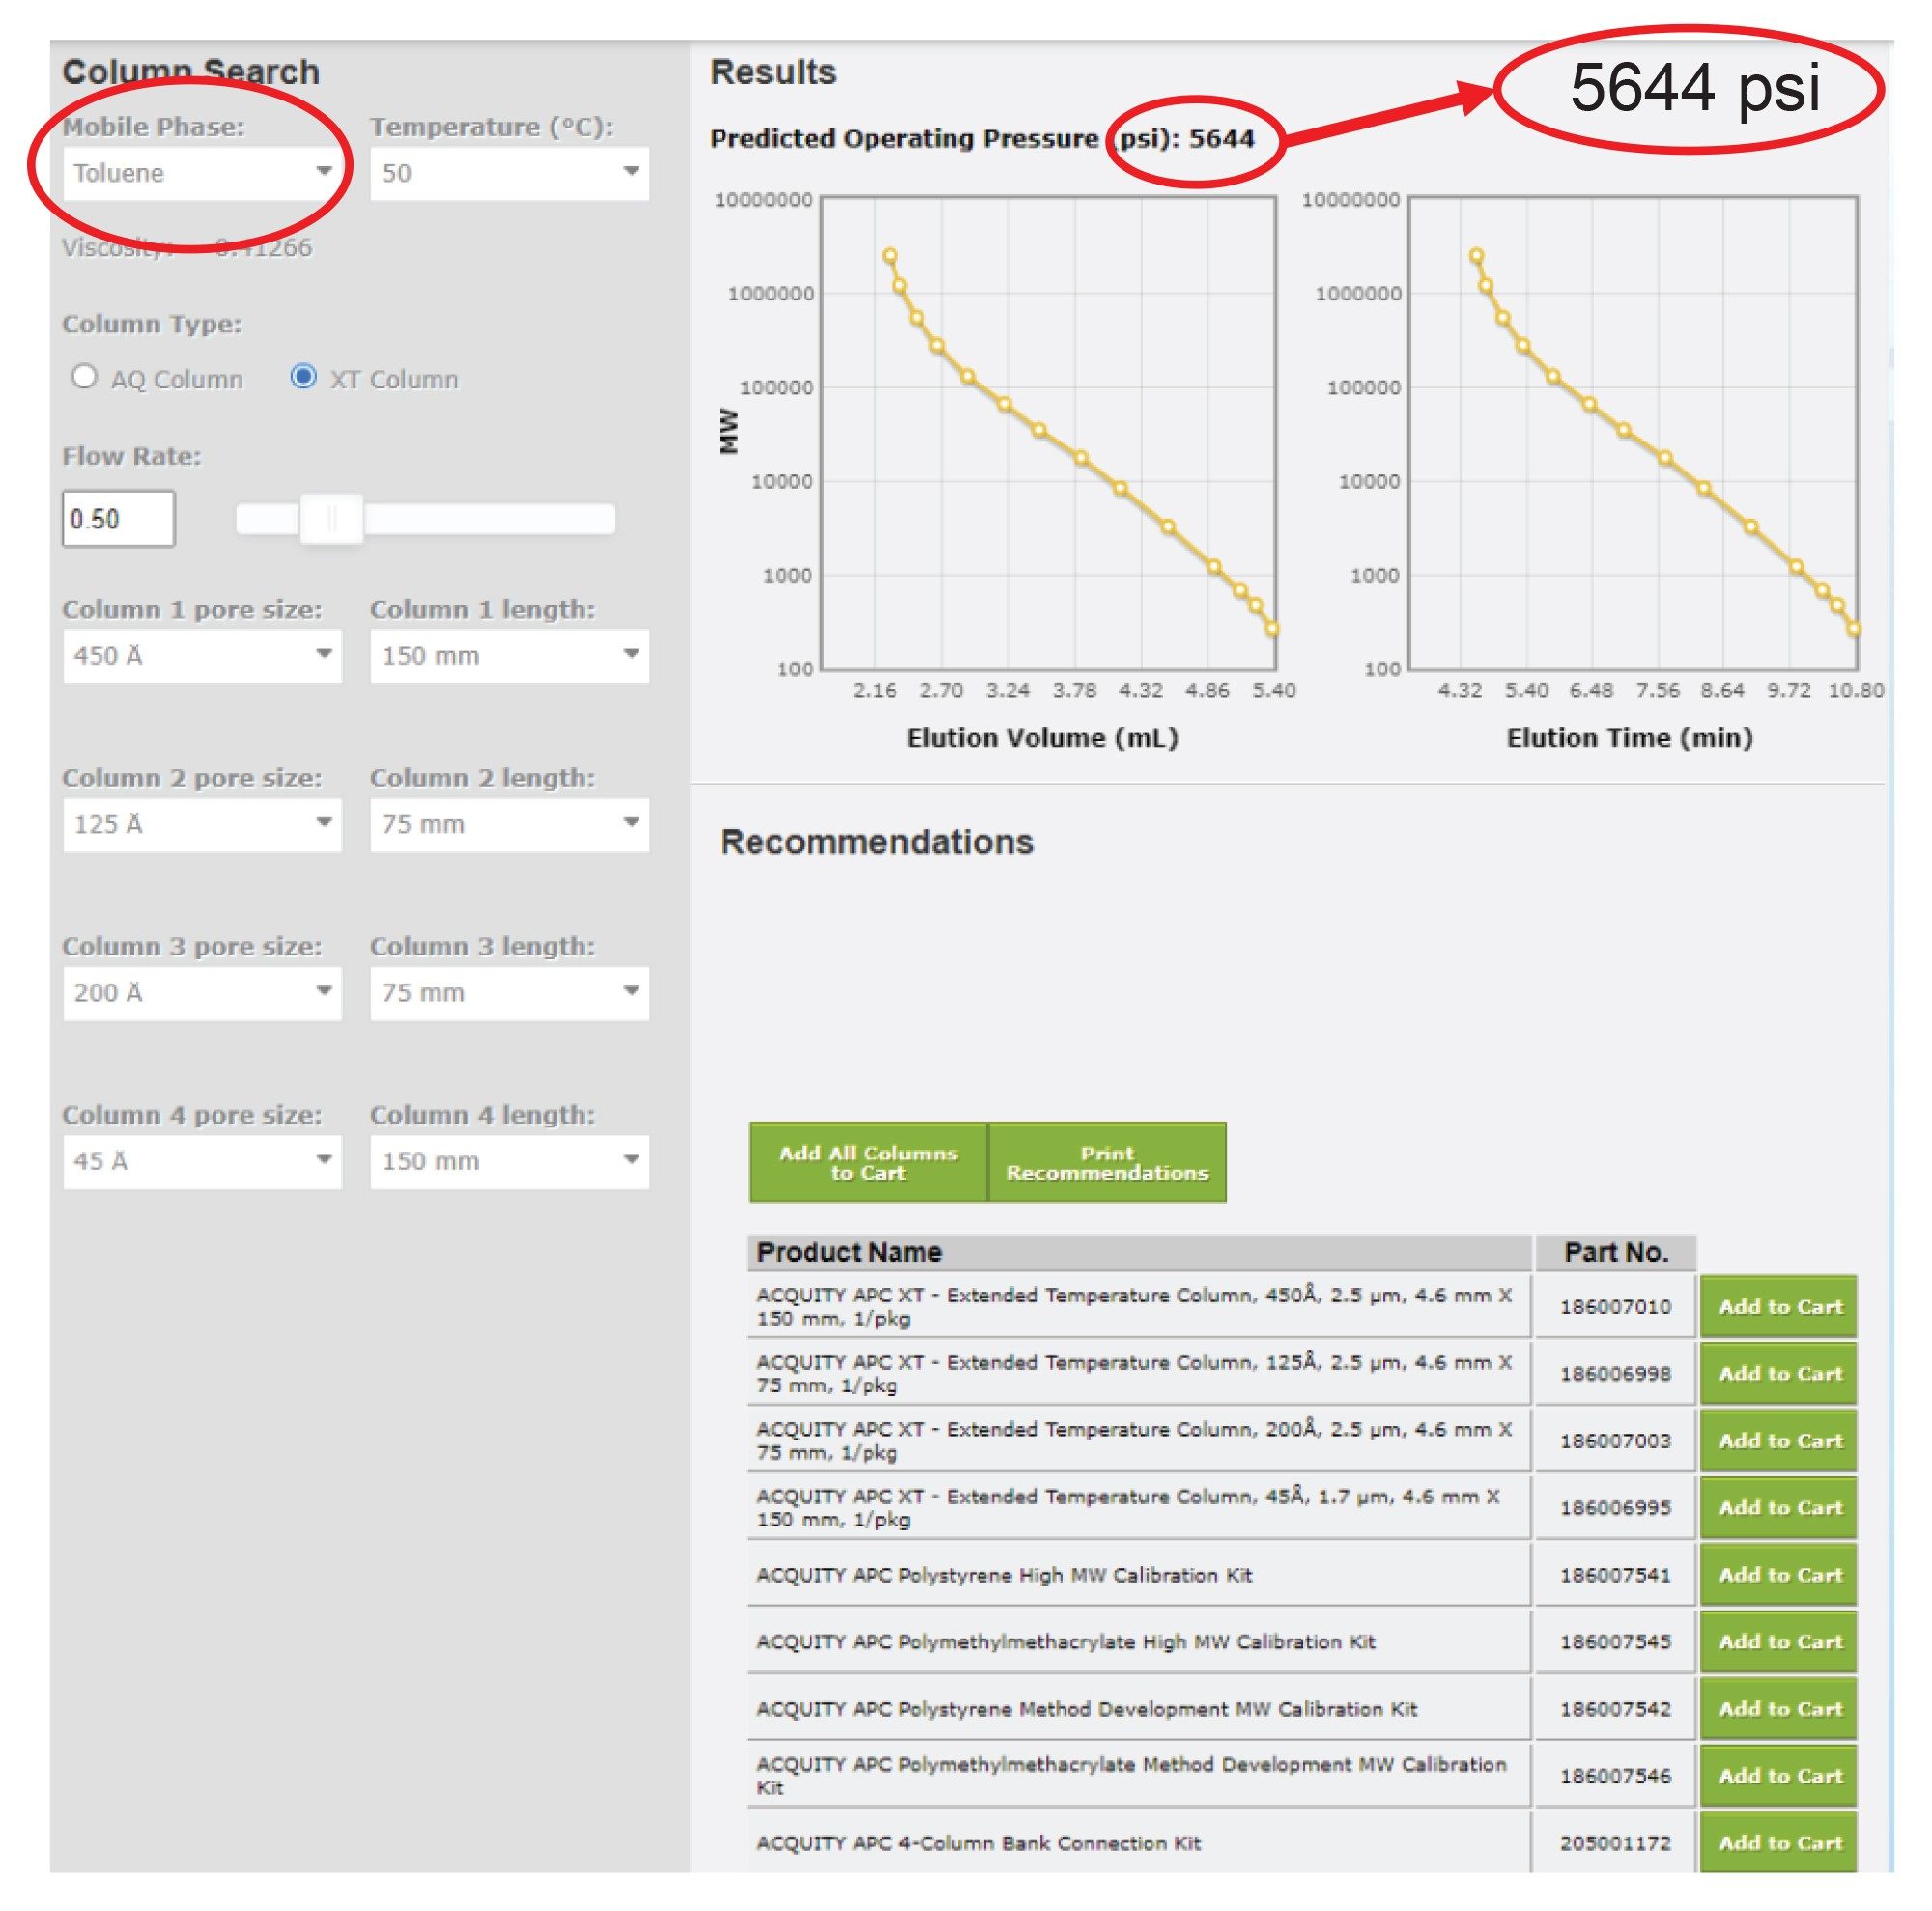
The APC Column selector tool in Figure 2. enabled the start of method development and ordering supplies before entering the lab. The solvent, column temperature, flow rate, and column bank were entered into the tool, and the predicted backpressure of 5644 psi and elution time of eleven minutes were used in for planning the instrument method. The linearity of the elution curve was helpful in building the correct column bank.
Solvent Savings
Data Management
Instrument control (APC and RI detector) as well as data acquisition and processing were done by Empower™ 3 Chromatography Data System, FR5.
Results and Discussion
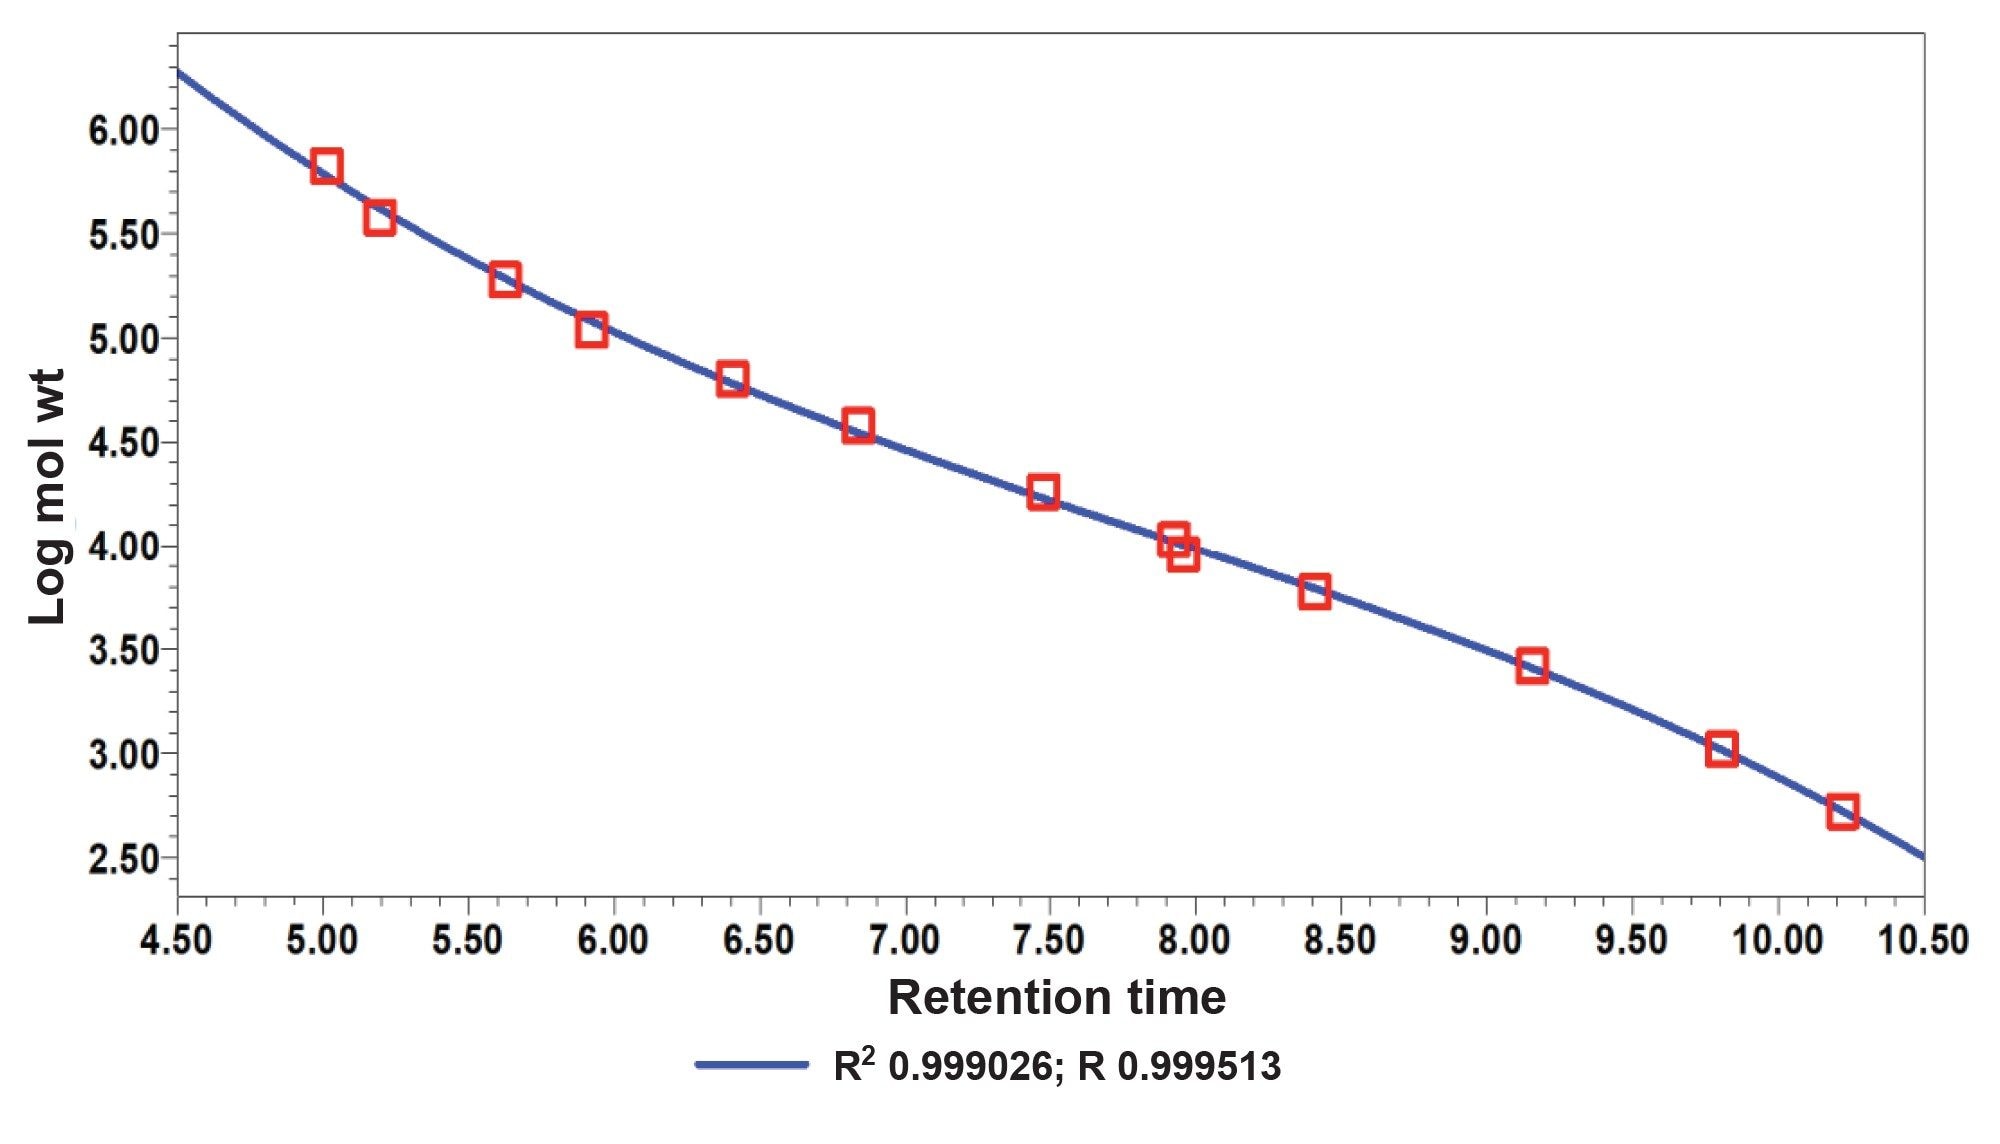
The calibration of the four groups of PS standards analysis was completed, and a calibration curve was created from the processed data within the Empower 3 GPC option (Figure 3 and 4).7
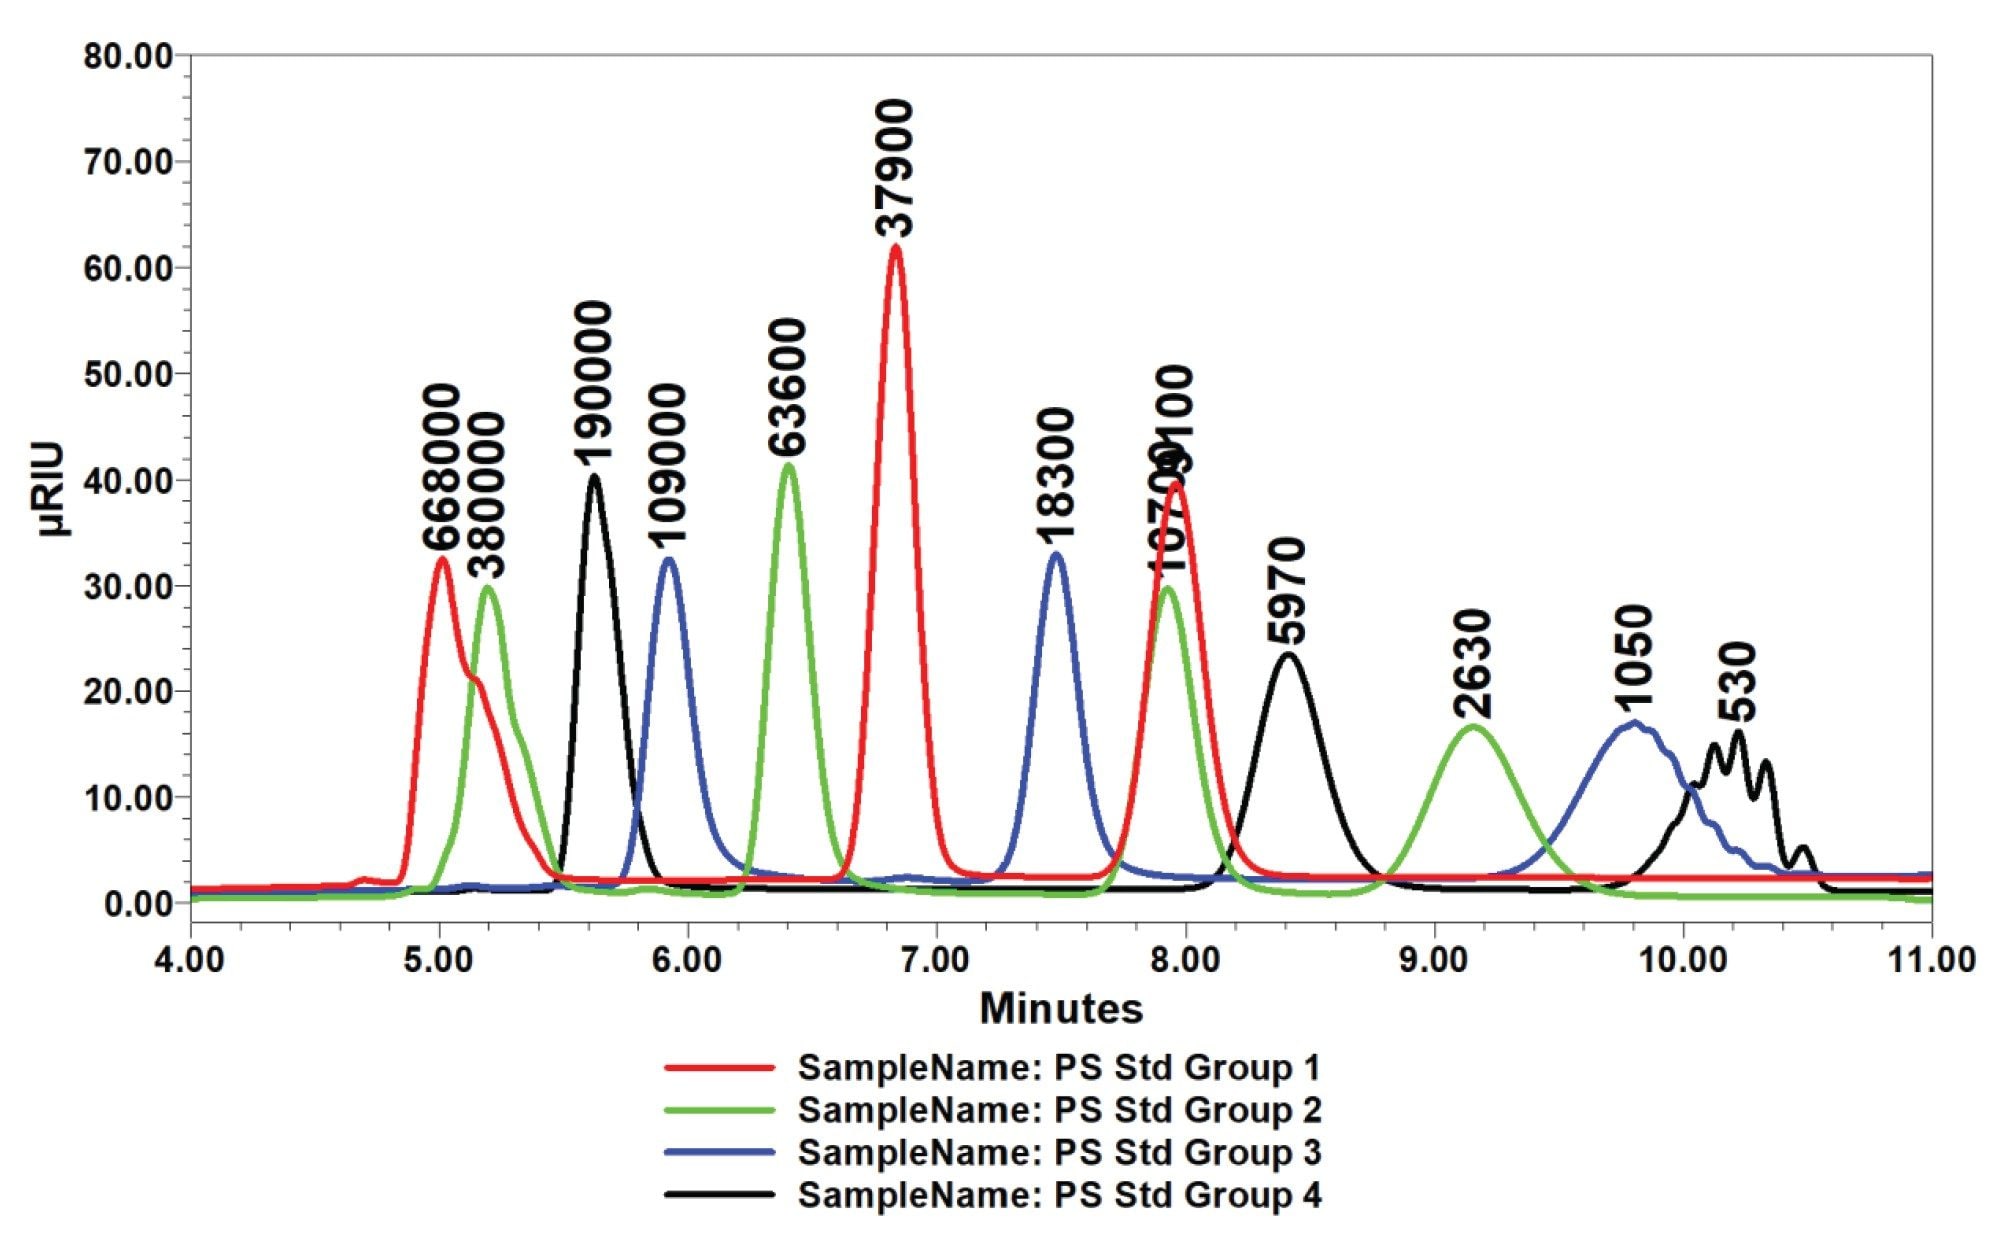
The PS standards were integrated using the Empower Software which generated a calibration curve in Figure 4. The experimental PDMS samples were then integrated which generated peak values relative to the PS calibration curve.
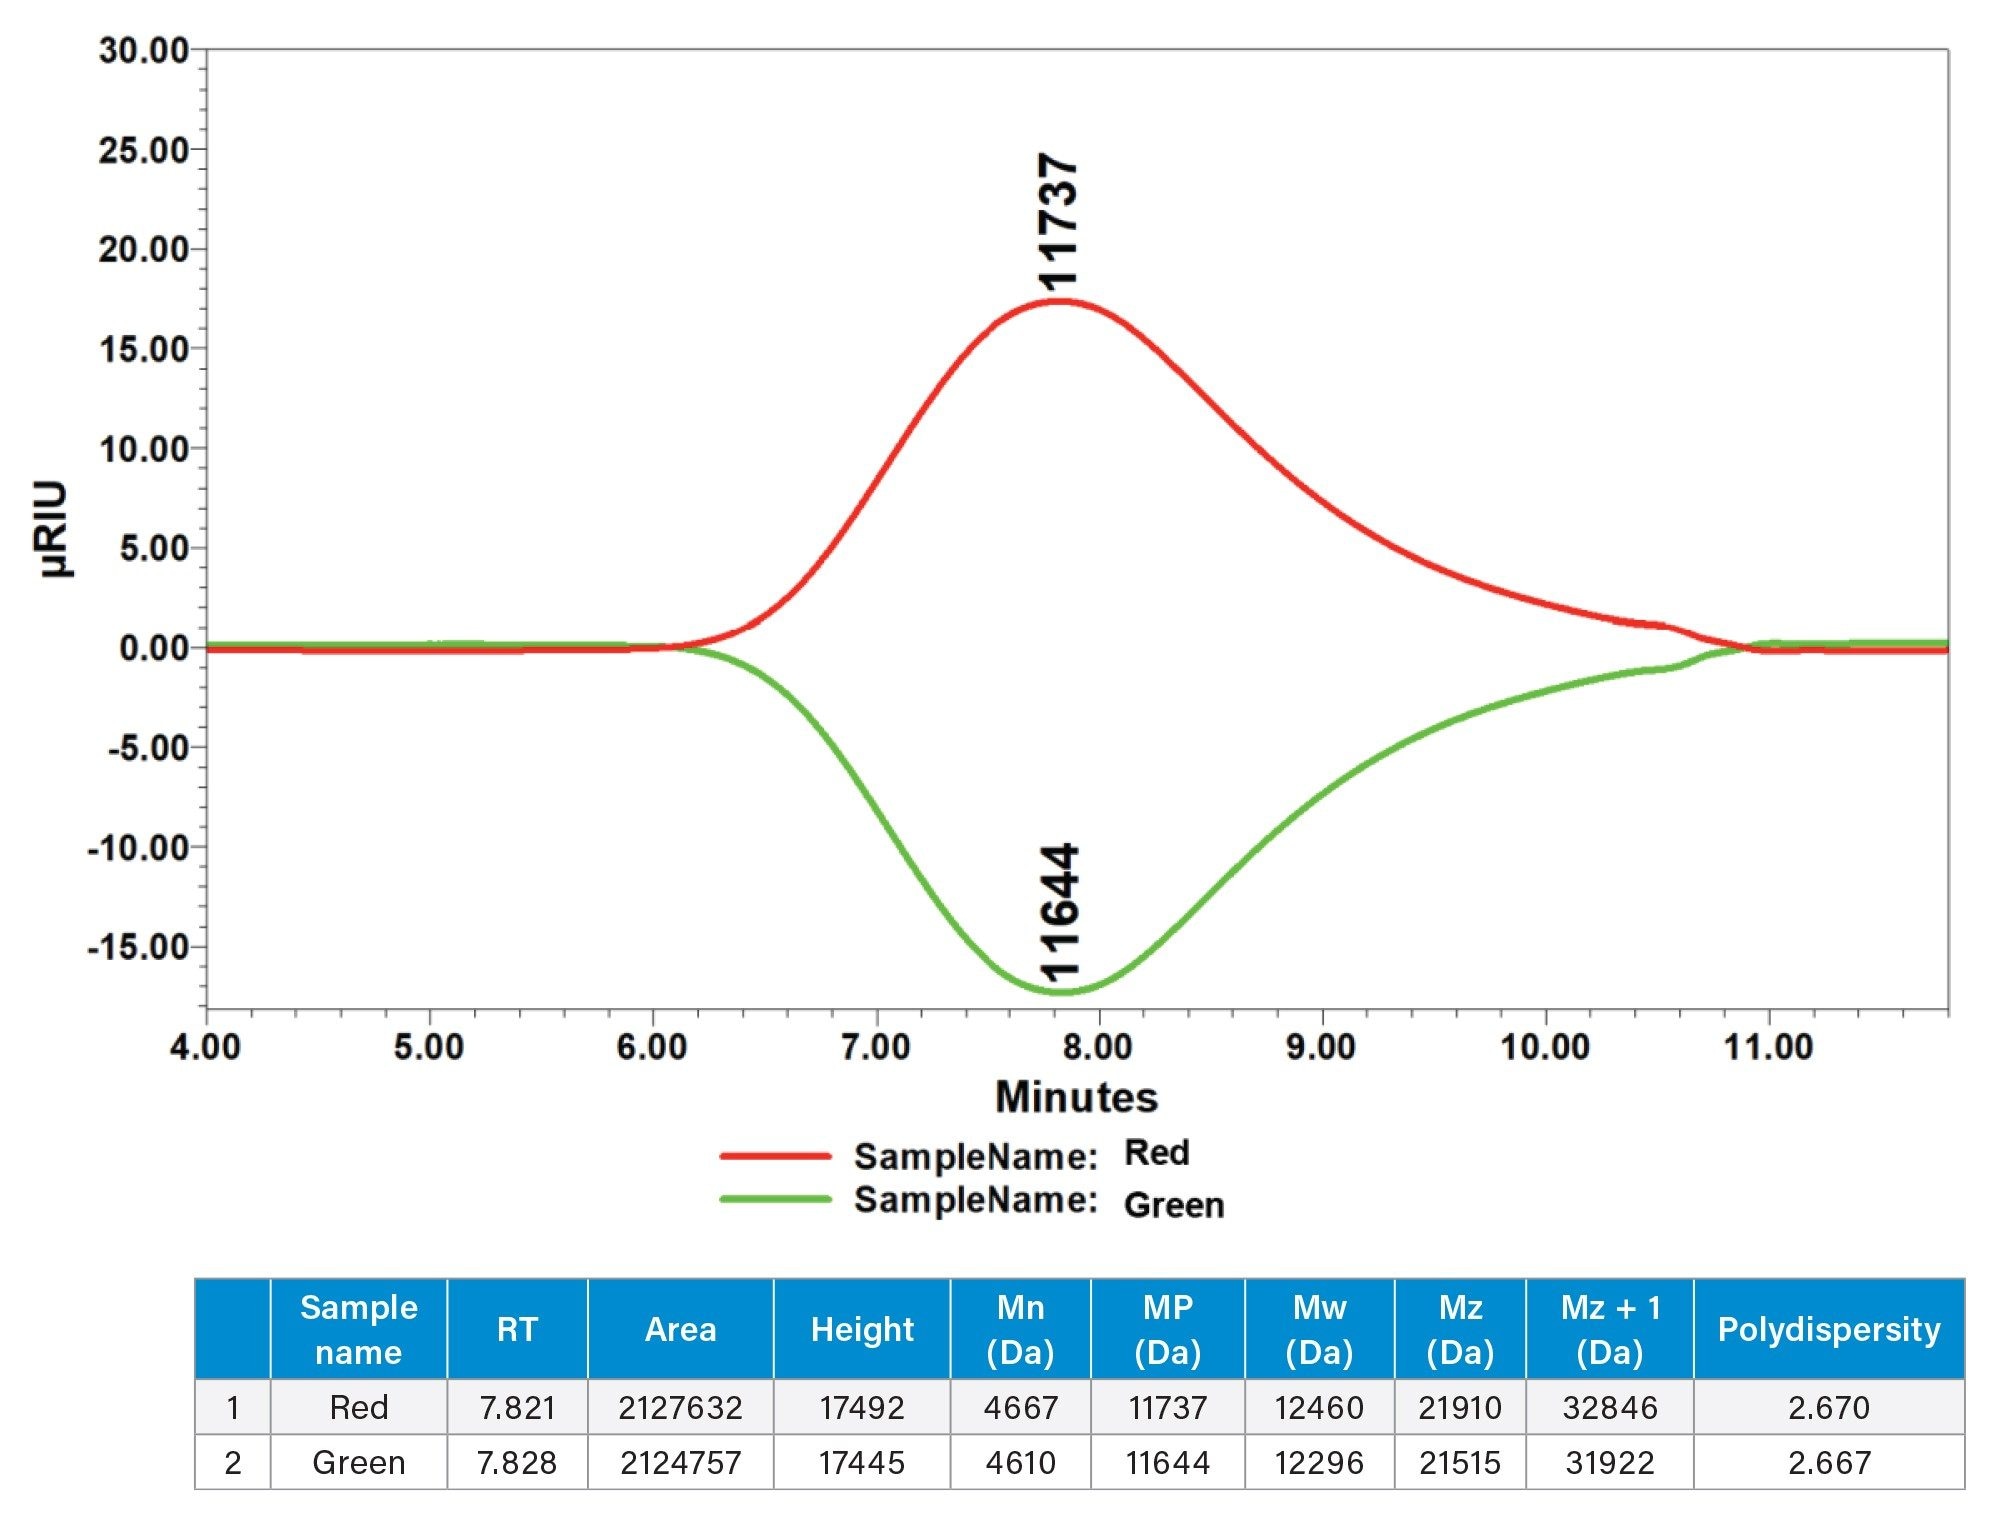
The chromatograms of the experimental PDMS samples appear as negative peaks due to the refractive index difference between the polymer (RI=1.39–1.41) and the toluene (RI=1.497) mobile phase being negative, but the RI polarity was reversed in the detector console to view the peaks as positive. The peak data of the two separate injections were very close (Figure 5).
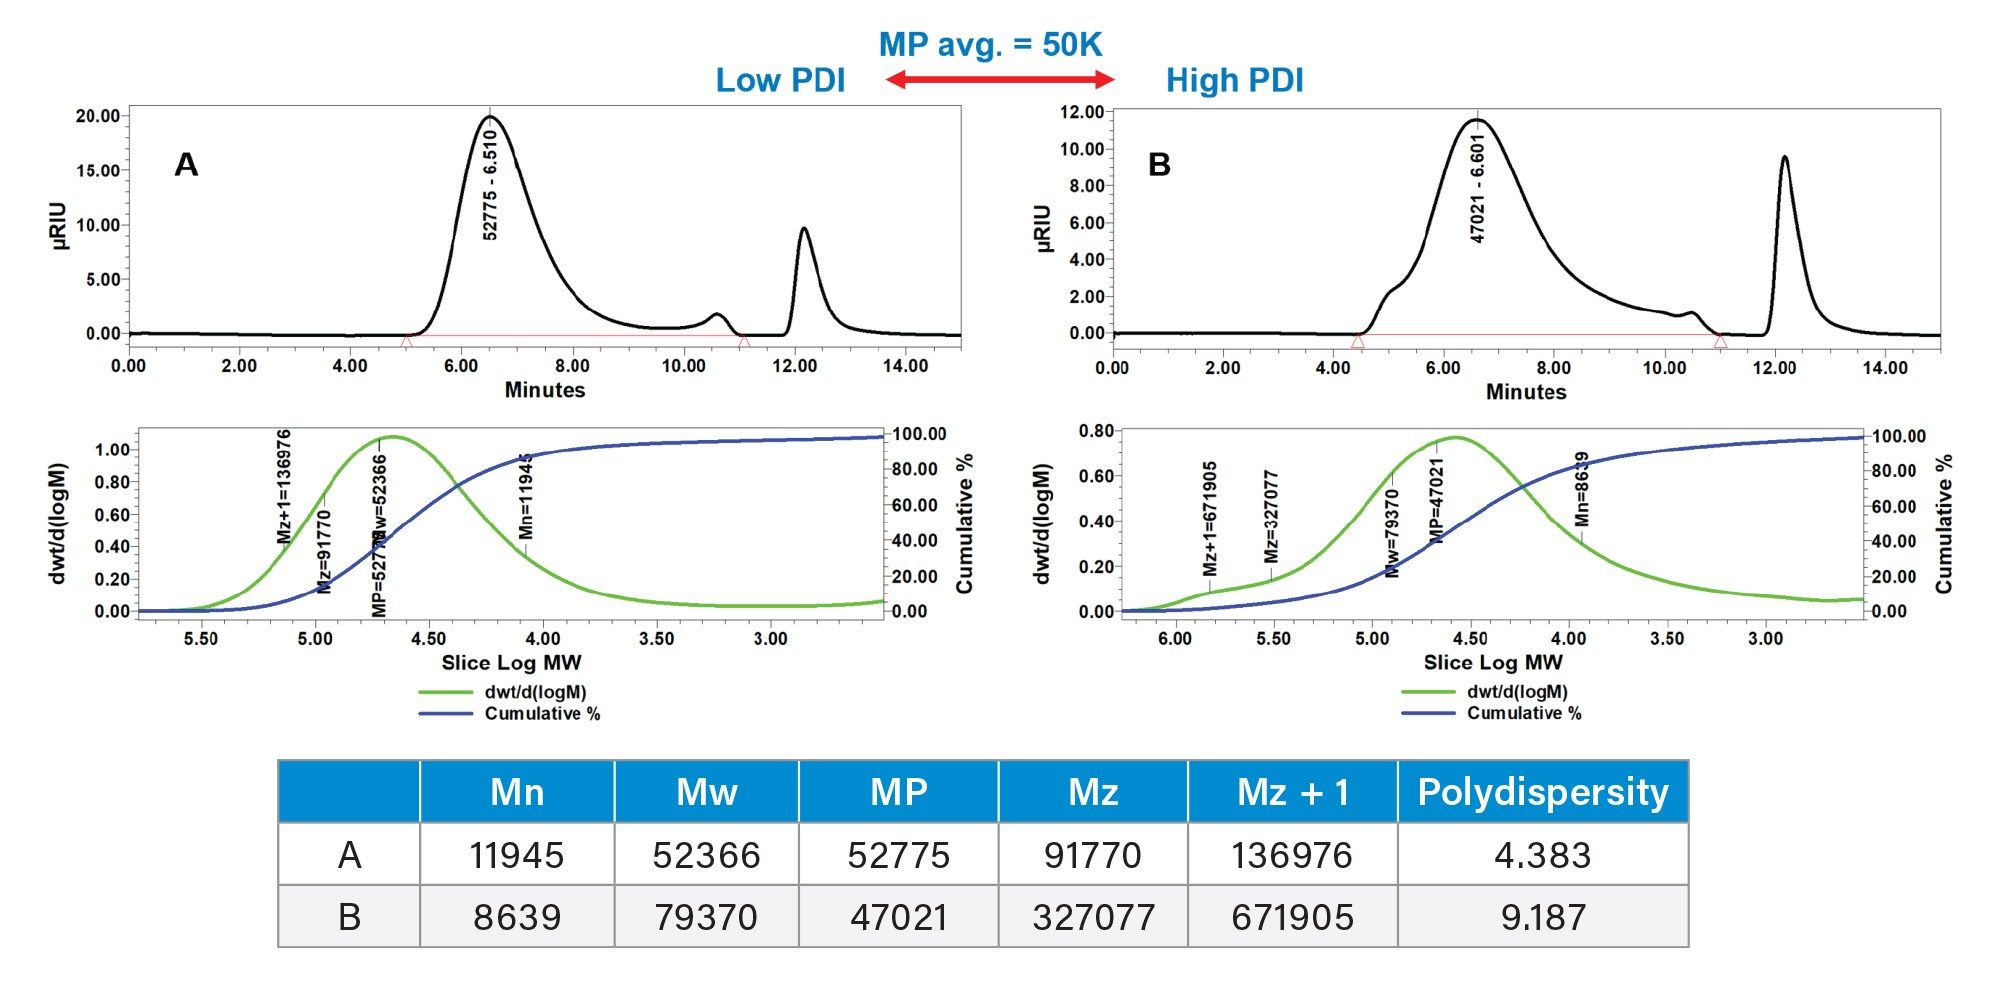
There are two PDMS results displayed in Figure 6 that have similar MP values: A and B are in the 50K peak average molecular weight (MP) range. The MW pair has a low (4.383) and high (9.187) polydispersity index (PDI) example. The low PDI example has a narrower peak. The higher PDI chromatogram has a broader peak and a shoulder that exceeds the exclusion limit of column bank separation capability. The differences in PDI are important information while predicting the final product properties of flow, flexibility, and durability.8 The MP and PDI are just two of the many standard calculations reported in the Empower 3 GPC option.
The molecular weight range of the APC System is from 200–2M Da, and the oligomeric region below 20K MP is highly resolved when compared to traditional GPC (Figure 7).9
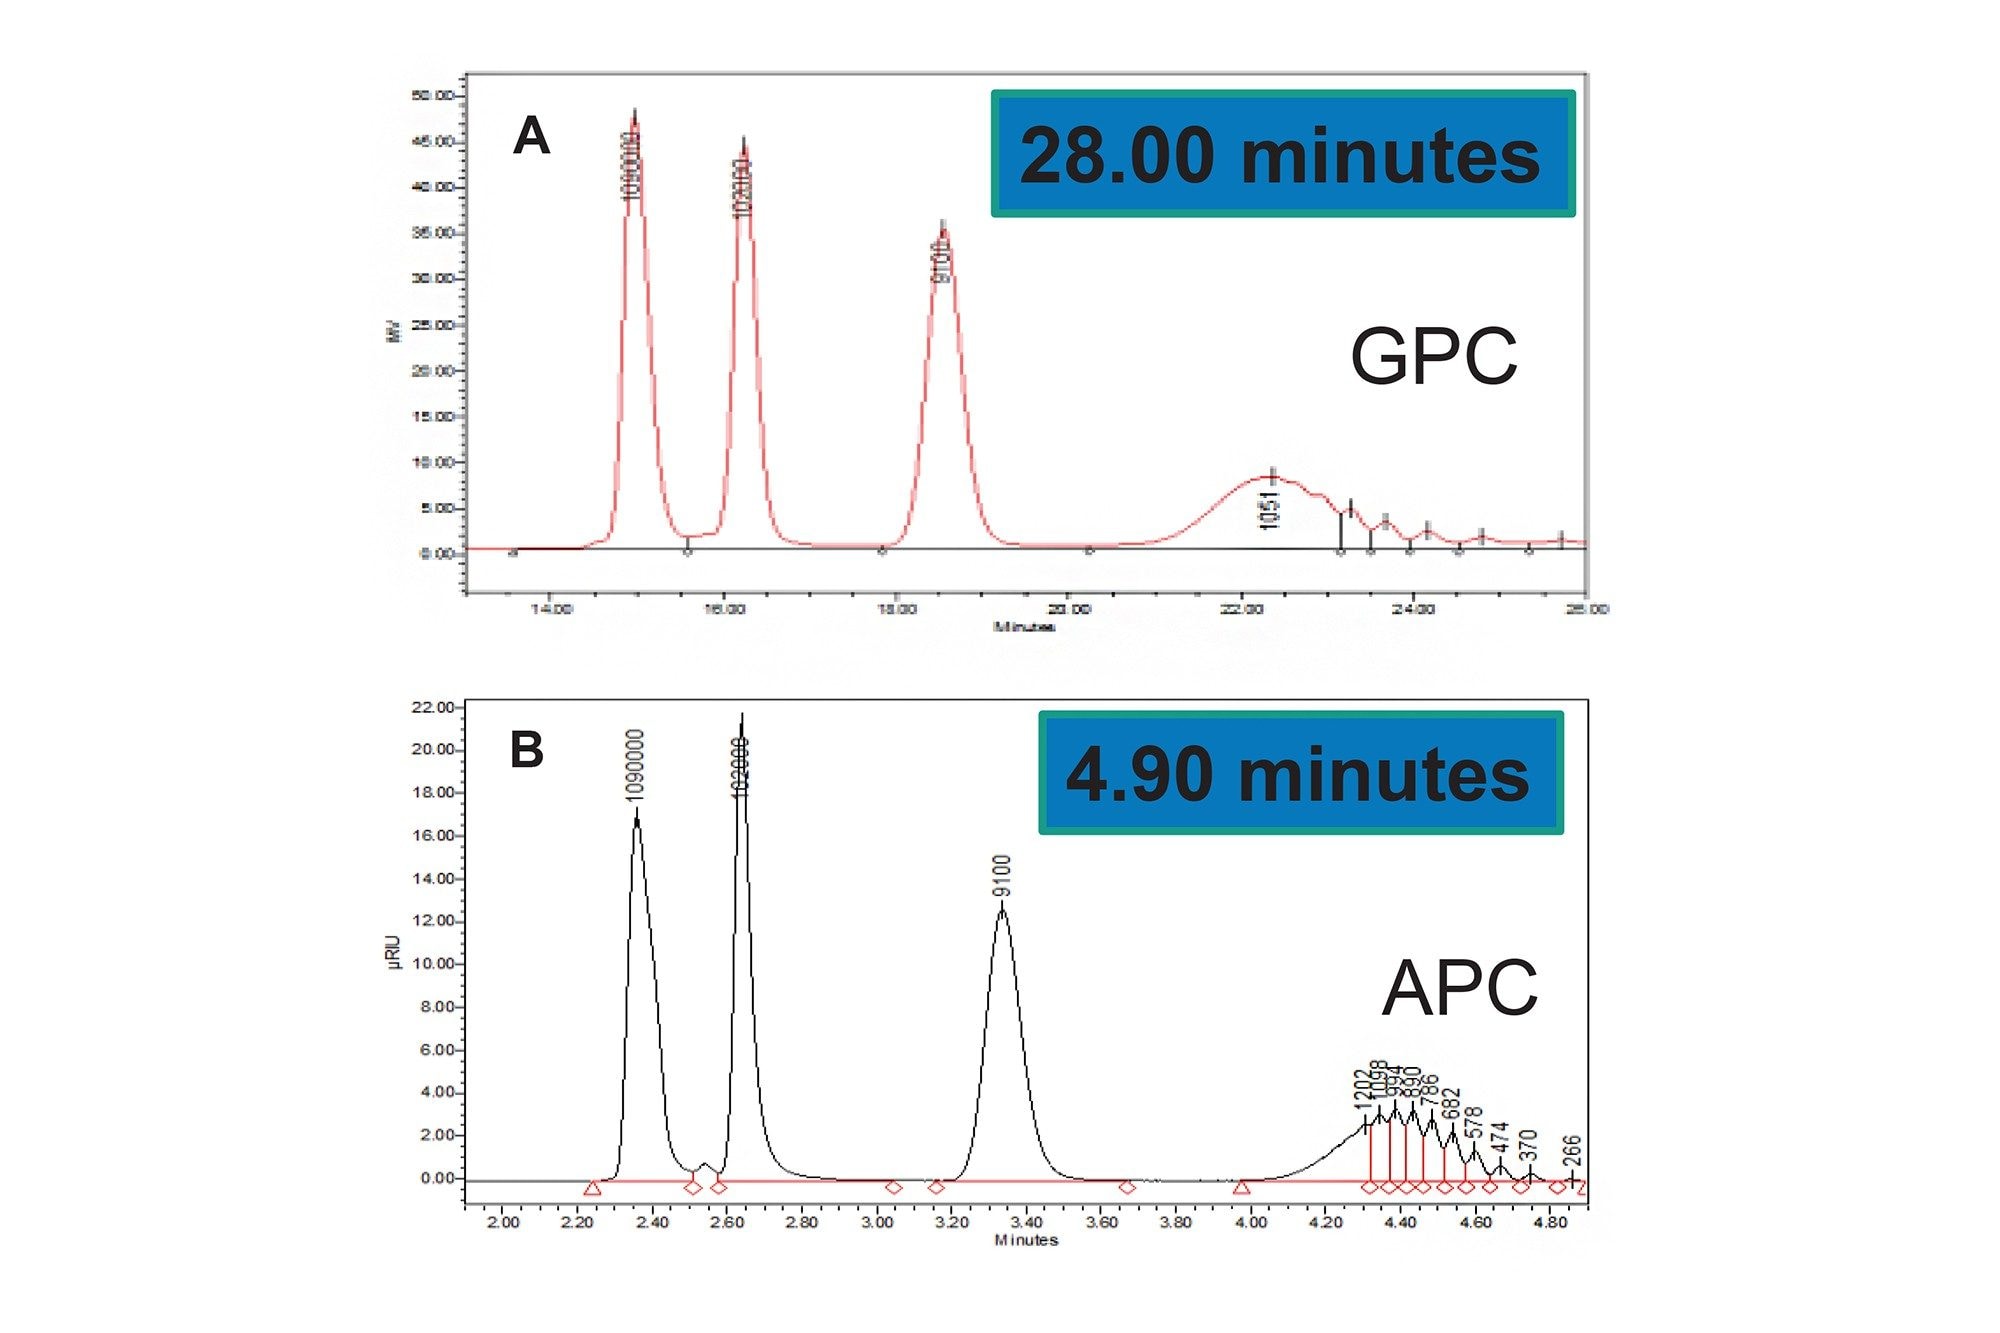
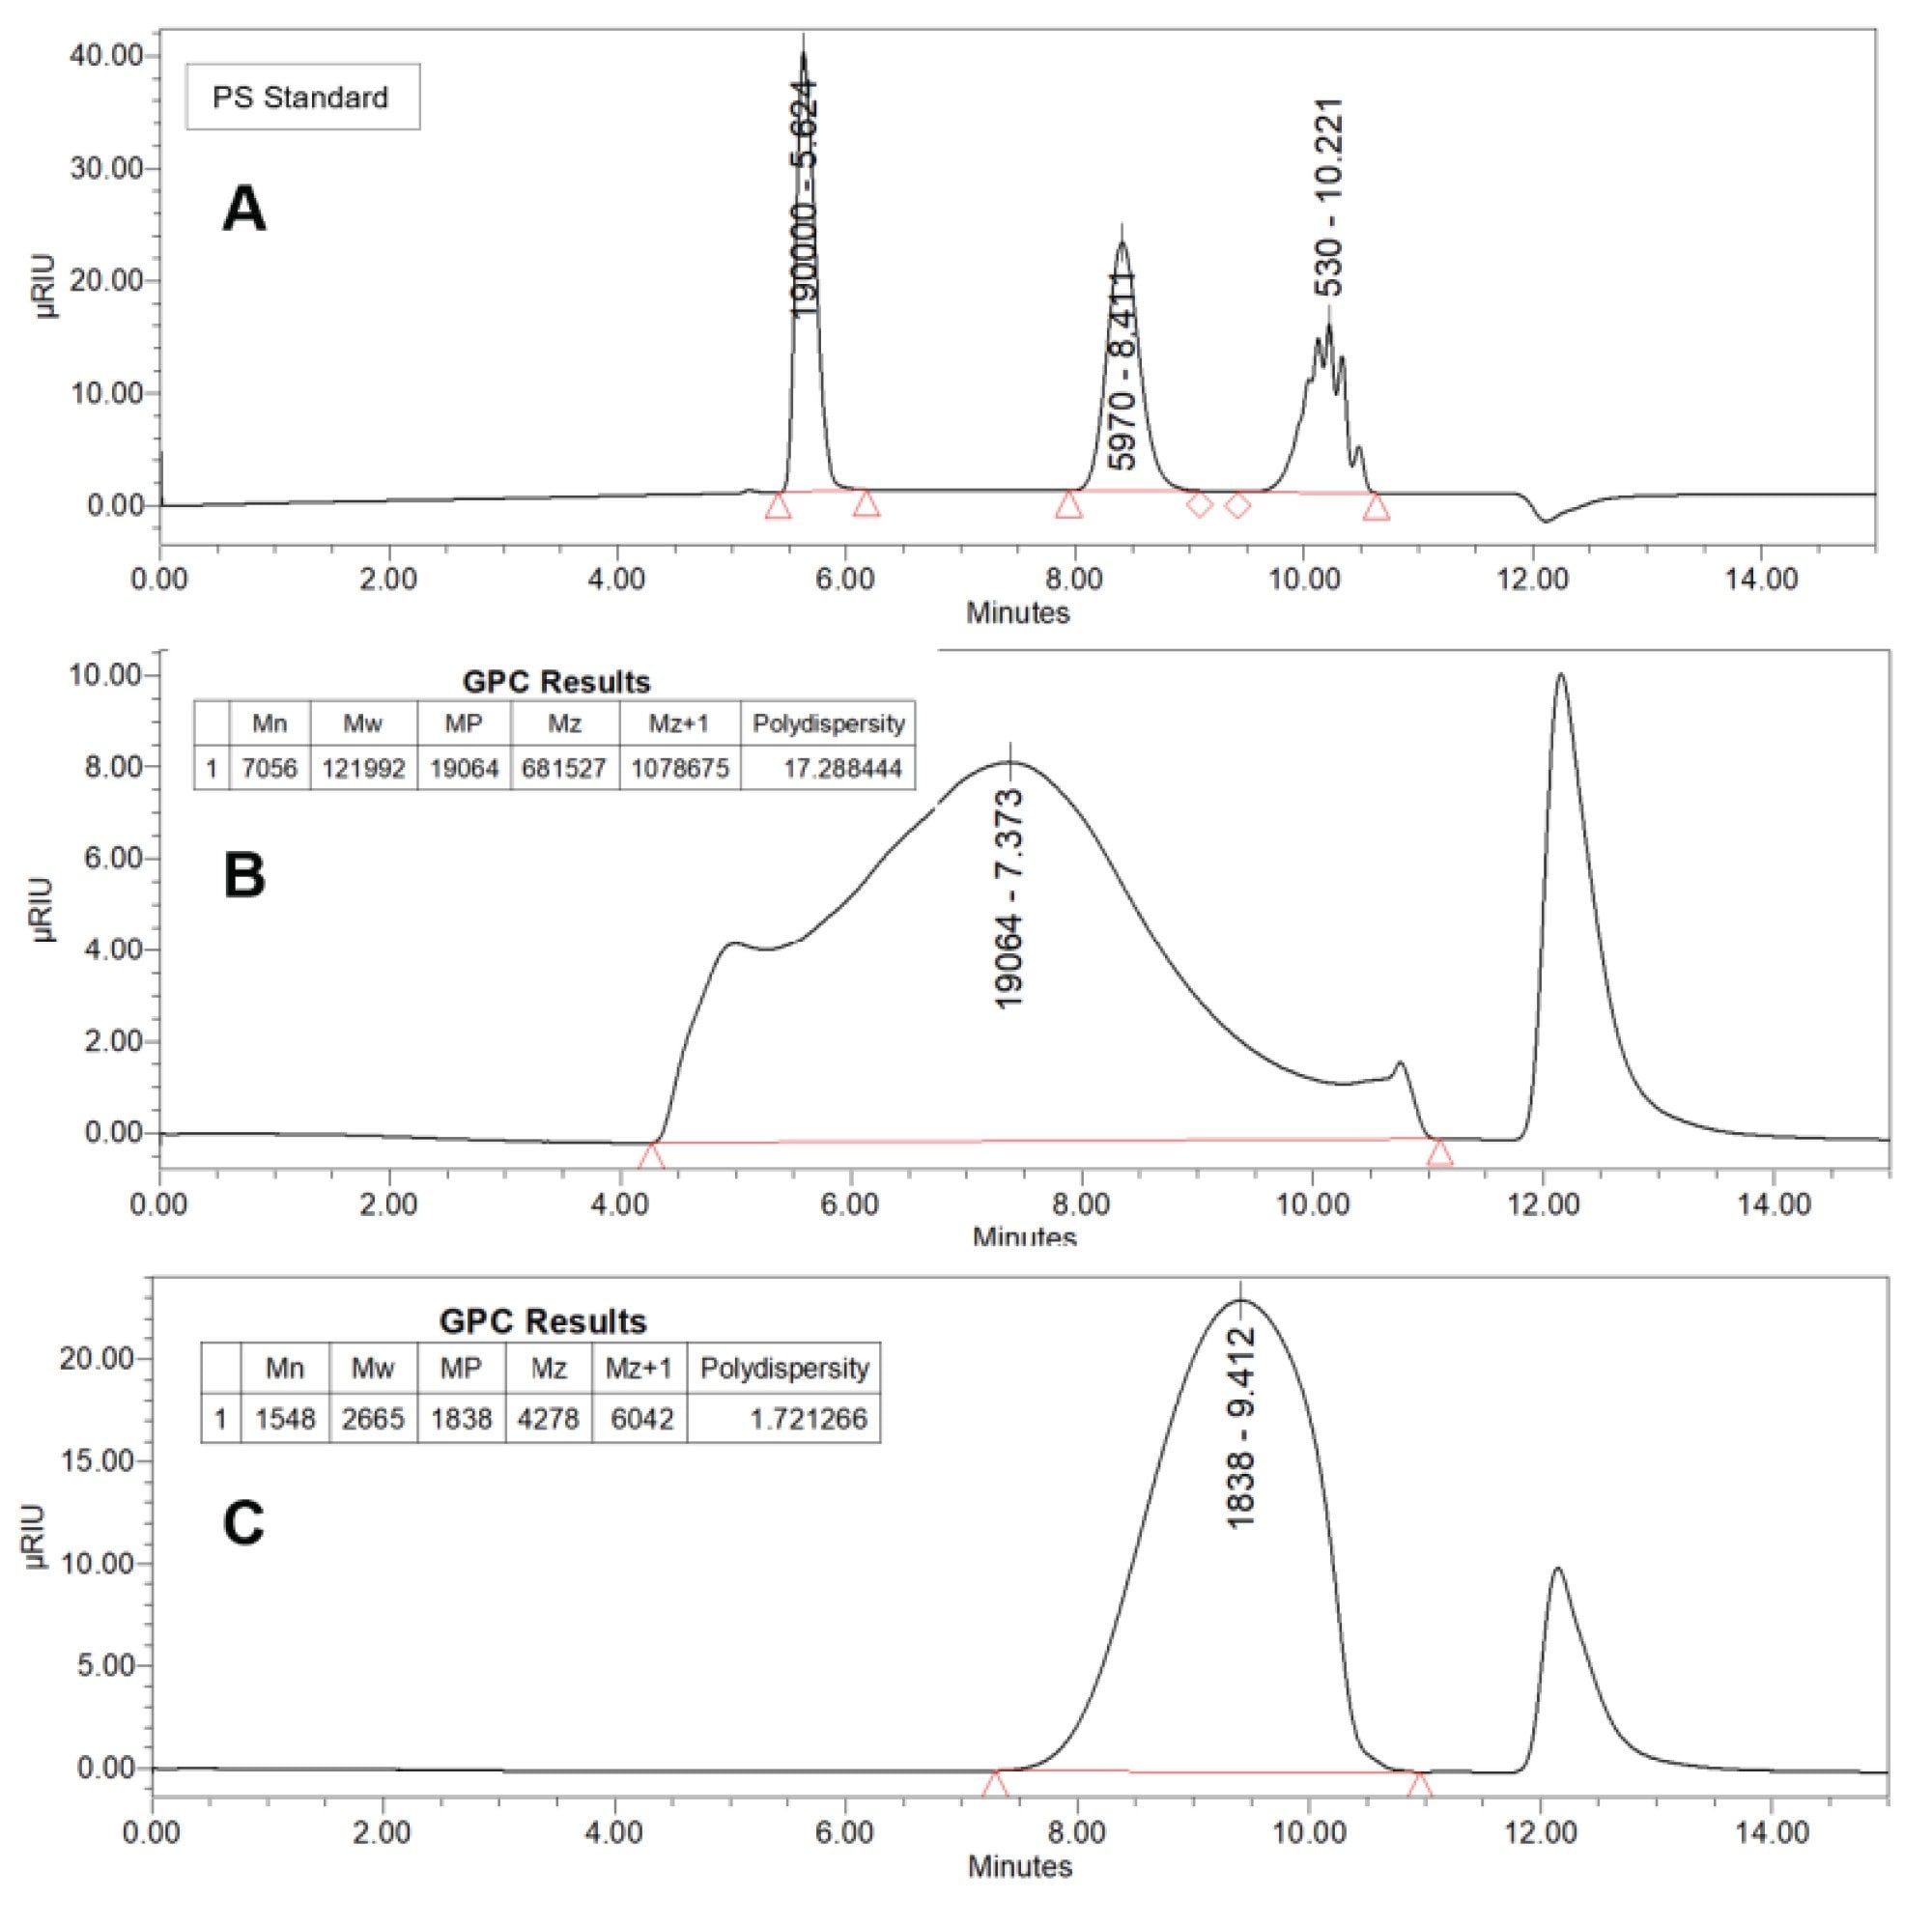
The chromatograms of the low MW calibration standard and the PDMS samples below 20K and 2K are displayed in figures seven through nine. The manufacturer reported PDI of the PS standards is very close to a value of one, which is nearly perfect. The 20K MP PDMS sample has a very large PDI of 17, which is associated with a broad distribution of MW: hence the very broad peak. The 2K MP PDMS peak has a PDI of 1.7, which is a value greater than the PS standards, but a very narrow distribution compared to the 20K MP peak. These are examples of the performance range of the APC System with APC XT Columns.
Conclusion
The results of the PDMS analysis in toluene successfully illustrates the fast and high-resolution advantages of the APC System, XT columns, and Empower 3 Software. The low volume APC System and small-pore/high-strength silica particle APC XT columns enable sample analysis in fifteen minutes, within one sample set, using one column bank, and achieving a calibration curve with R2 values >0.999.
With conventional GPC columns, pressure limits of the fragile gel packing and changing solvents would take up to a day while potentially damaging the column bed. The APC System analysis is four times faster than traditional SEC while obtaining superior quality data, especially in the low MW range demonstrated in the PS calibration standards APC ten low MW peaks vs. the GPC six peaks.
Analyzing PDMS samples in toluene enables faster turnaround times, data confidence with daily calibration curves in less than one hour and protecting corporate intellectual property by using in-house analysis versus an outside contracting laboratory. The combination of UPLC instrumentation, columns, and software is a cost-effective option for lowering solvent use and waste disposal costs, sample analysis, and increased sample throughput.
References
- A CRO Advances Polymer Characterization with Ultra High Performance Size Exclusion Chromatography, Waters Case Study, 720005566EN, 2016.
- M. Summers, J. Shia, K.J. Fountain, Solvent Flexibility for Size-Based Polymer Analysis Using the Advanced Polymer Chromatography (APC) System, 2013. Waters Applicaion Note, 720004628, 2013.
- ACQUITY APC: Increase the Sophistication of Your Research by Adding p-QSM Technology. https://videos.waters.com/detail/video/6098455761001/acquity-apc:-increase-the-sophistication-of-your-research-by-adding-p-qsm-technology.
- "Linear Polydimethylsiloxanes" Joint Assessment of Commodity Chemicals, September 1994 (Report No. 26) ISSN 0773-6339-26.
- Wolf, M.P., G.B. Salieb-Beugelaar, and P. Hunziker, PDMS with Designer Functionalities-Properties, Modifications Strategies, and Applications. Progress in Polymer Science, 2018. 83: p. 97–134 https://doi.org/10.1016/j.progpolymsci.2018.06.001.
- Polymer Properties Database, 2015–2021, https://polymerdatabase.com/home.html.
- Ensuring Quality Through Compliance, Waters Brochures, 72000522EN, 2015.
- Suresh Seethapathy, Tadeusz Górecki, Applications of Polydimethylsiloxane in Analytical Chemistry: A review, Analytica Chimica Acta, Volume 750, 2012, Pages 48–62, ISSN 0003–2670, https://doi.org/10.1016/j.aca.2012.05.004.
- Janco, M., Alexander, J.N., IV, Bouvier, E.S.P. and Morrison, D. (2013), Ultra-High Performance Size-Exclusion Chromatography of Synthetic Polymers. J. Sep. Science, 36: 2718–2727. https://doi.org/10.1002/jssc.201300444.
720007658, June 2022