• Note d'application

Identification and Characterization of Key Chemical Constituents for The Authentication of Hoodia Gordonii Using UPLC/oaTOF MSE

Identification and Characterization of Key Chemical Constituents for The Authentication of Hoodia Gordonii Using UPLC/oaTOF MSE

  • Bharathi Avula
  • Kate Yu
  • Yan-Hong Wang
  • Alan L. Millar
  • Ikhlas A. Khan
  • National Center for Natural Products Research, School of Pharmacy, University of Mississippi
  • Waters Corporation
  • Department of Pharmacognosy, School of Pharmacy, University of Mississippi
  • Department of Pharmacognosy, College of Pharmacy, King Saud University

Abstract

This application note demonstrates to develop a practical workflow that allows quick authentication of any botanical or commercially packaged product claiming to contain Hoodia gordonii.

Benefits

Allows for rapid characterization of the key chemical constituents from the authentic H. gordonii, provides easy generic workflow to authenticate dietary supplements that claim to contain H. gordonii.

Introduction

Hoodia gordonii, from the family Asclepiadaceae, is a slow growing succulent plant that is traditionally used in South Africa as an appetite suppressant.1,2 Over the past 5 to 10 years, the Hoodia plant and the preparations of Hoodia have become increasingly popular. These dietary supplements are promoted for weight reduction. Previously published Hoodia-related phytochemical papers focused on two species: H. gordonii and H. pilifera. These species had about 40 different pregnane glycosides reported as being isolated and structurally elucidated. They were comprised of a few aglycones, such as hoodigogenin A, calogenin, hoodistanal, and dehydrohoodistanal. The aglycon hoodigogenin A is unique for Hoodia.3

The limited availability of the Hoodia plant material and its increasing popularity has opened the possibility of adulteration by other botanicals. One possible adulterant may be the Opuntia species, which grows quickly. There have been no appetite-suppressing properties associated with these species. Consequently, analytical methods have been developed based on the acquired knowledge of the plants composition in order to detect adulteration.3 Previous screening results have prompted serious concerns about the safety of commercial products that claim to be Hoodia, as a considerable amount of these products seem to lack Hoodia.

In this application note, we present a novel UPLC/oaTOF-MSE/multivariate statistical analysis (MSA) workflow for the holistic characterization of the chemical constituents from H. gordonii and to authenticate the dietary supplements that claim to contain H. gordonii. This workflow provides a new method for the fast generation, and the automated analysis of information-rich data.

Experimental

For each commercial Hoodia sample, five capsules were weighed and opened, and the contents were emptied. The content of the capsules were mixed and triturated using a mortar and pestle.

Dry plant sample (0.3 g) and an adequate amount of powdered capsule content (average wt of five capsules) were sonicated in 2.5 mL of methanol for 25 min, respectively followed by centrifugation for 15 min at 3300 rpm. The supernatant was transferred to a 10 mL volumetric flask. The procedure was repeated three times, and then the respective supernatants were combined. The final volume was adjusted to 10.0 mL with methanol and mixed thoroughly. Prior to injection, an adequate volume (ca. 2.0 mL) of the extracted solution was passed through a 0.45 μm nylon membrane filter.

The first 1.0 mL was discarded, and the remaining volume was collected in an LC sample vial. Each sample solution was injected in triplicate.

UPLC conditions

LC system:

ACQUITY UPLC

Column:

ACQUITY UPLC HSS T3 Column, 2.1 x 100 mm, 1.8 μm

Column temp.:

60˚C

Flow rate:

500 μL/min.

Mobile phase:

A: Water + 0.1% formic acid

B. Methanol

Injection volume:

5 mL

Gradient:

98% A to 80% A in 1 min; then to 5% A linear to 25 min. At 25 min, step to 0% A and hold at 0% A till 30 min. Equilibrate for 4 min.

Total run time:

34 min.

MS conditions

MS System:

SYNAPT G2 Mass Spectrometer

Ionization mode:

ESI- and ESI+

Acquisition range:

50 to 1600 m/z

Capillary V:

3 kV

Cone V:

40 V

Desolvation temp.:

500 ˚C

Desolvation gas:

900 L/Hr

Source temp.:

120 °C

CE:

Low: 4 eV

High: 20 to 50 eV

Results and Discussion

The UPLC/oaTOF MSE analysis was performed for multiple samples, as shown in Table 1, in both positive and negative ionization modes. Here, we mainly focus on results obtained in negative ion mode. To ensure data integrity, all samples were pooled into a single vial and used as the QC run. For each individual sample, six replicates of injection were performed with the sequence of the injections randomized.

Table 1. Samples analyzed for this project. Sample 2925 is H. gordonii obtained from South Africa. It was used as the benchmark to authenticate samples throughout this project.

Figure 1A shows the UPLC/oaTOF MSE/MSA workflow used for this project. Figure 1B shows the Base Peak Ion (BPI) chromatogram that was obtained for the authentic H. gordonii extract (Sample 2925). For these types of complex samples, the priority is to maximize the separation resolution with sufficient peak capacity. This resulted in a 100 mm column with a 30 min runtime being adapted for the analysis.

Figure 1. Metabolomics workflow and example of the UPLC/oaTOF base peak ion chromatogram (BPI). 1A. The UPLC/oaTOF MSE/MSA analysis workflow. 1B. Example BPI for an authentic H. gordonii extract (Sample 2925).

The initial stage of the data mining was to perform the Principal Component Analysis (PCA) for the entire dataset. The Scores Plot of the PCA analysis is shown in Figure 2. Of the five H. gordonii samples analyzed, four were grouped closely together. However, Sample 2821 from the Missouri Botanical Garden clearly grouped closer to the other two Missouri Botanical Garden Hoodia spp samples. This indicated that the plant location has a profound influence on the chemical content. Further chemical investigation about plant location is not within the scope of this application note, and will be presented elsewhere.

Figure 2. PCA Scores Plot of the entire data set obtained from negative ion mode.

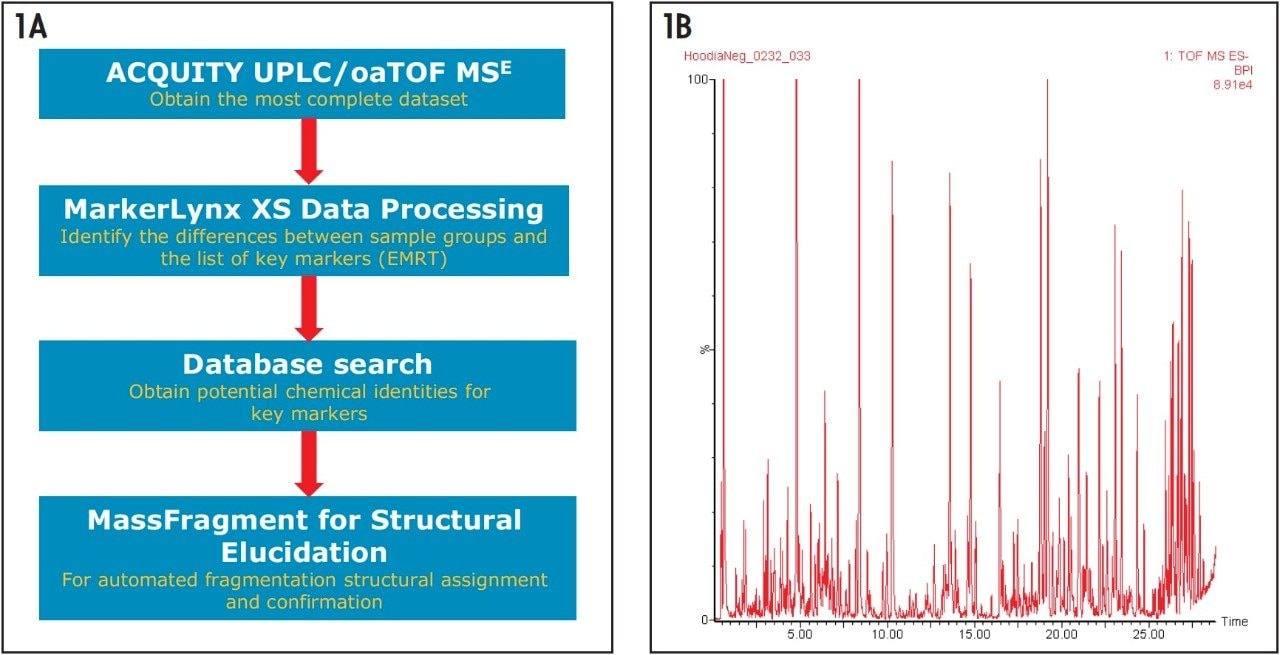
The data mining strategy steps were as follows:

  1. Obtain the total PCA based on the entire dataset.
  2. Perform OPLS-SA for five groups of samples.
  3. Obtain lists of key markers from the S-Plot (five lists obtained).
  4. Obtain a master list of key markers that consistently showed as key markers for H. gordonii based on the five comparisons.
  5. Obtain chemical identities of the key markers.
  6. Use MSE high energy fragment ions to perform structural elucidation and confirm the chemical identities.
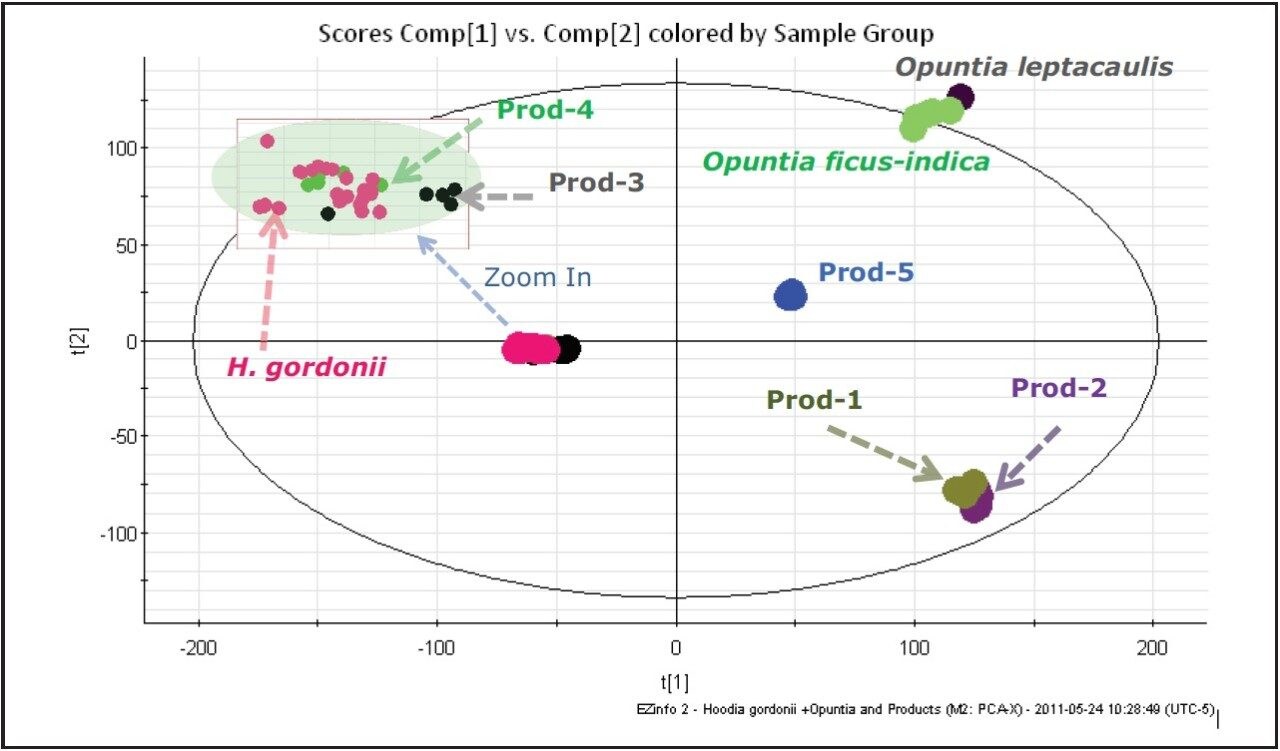
  7. Reprocess the dataset using only the key markers to obtain the PCA S-Plot of key markers. The key marker PCA S-Plot provides a visual display of the authentication of the commercial samples.

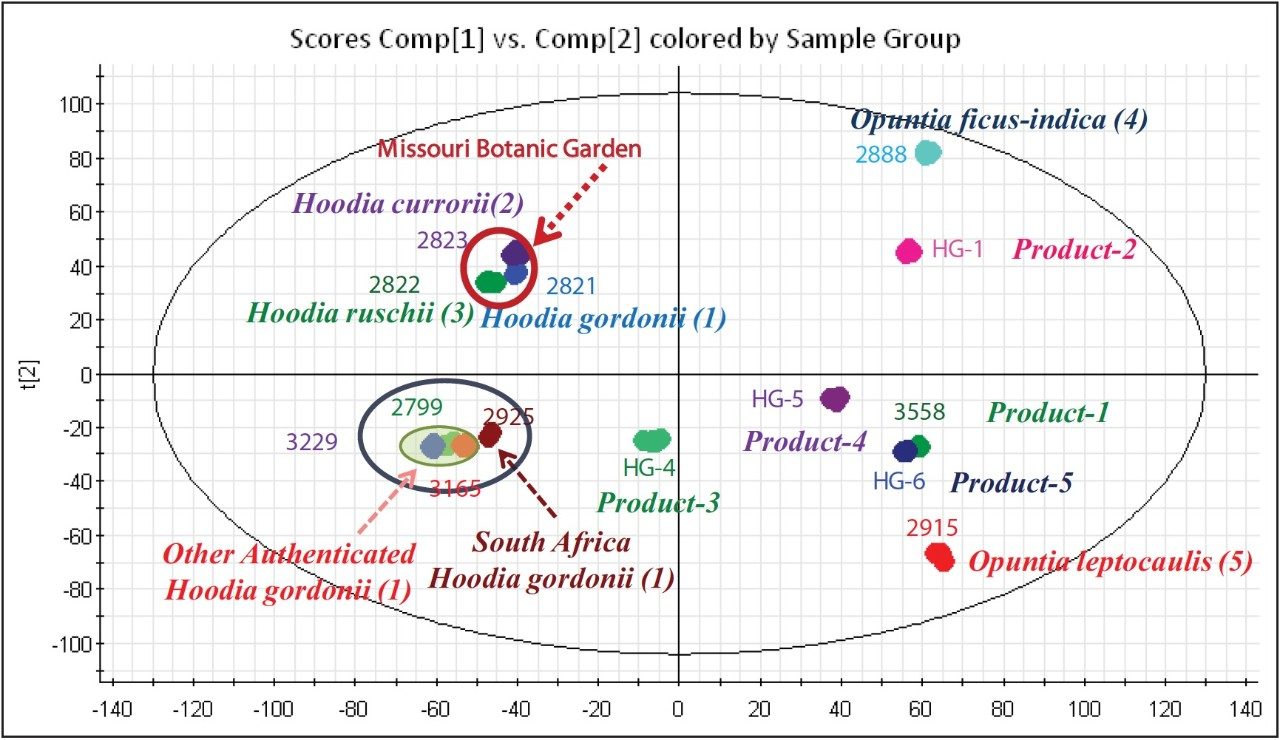
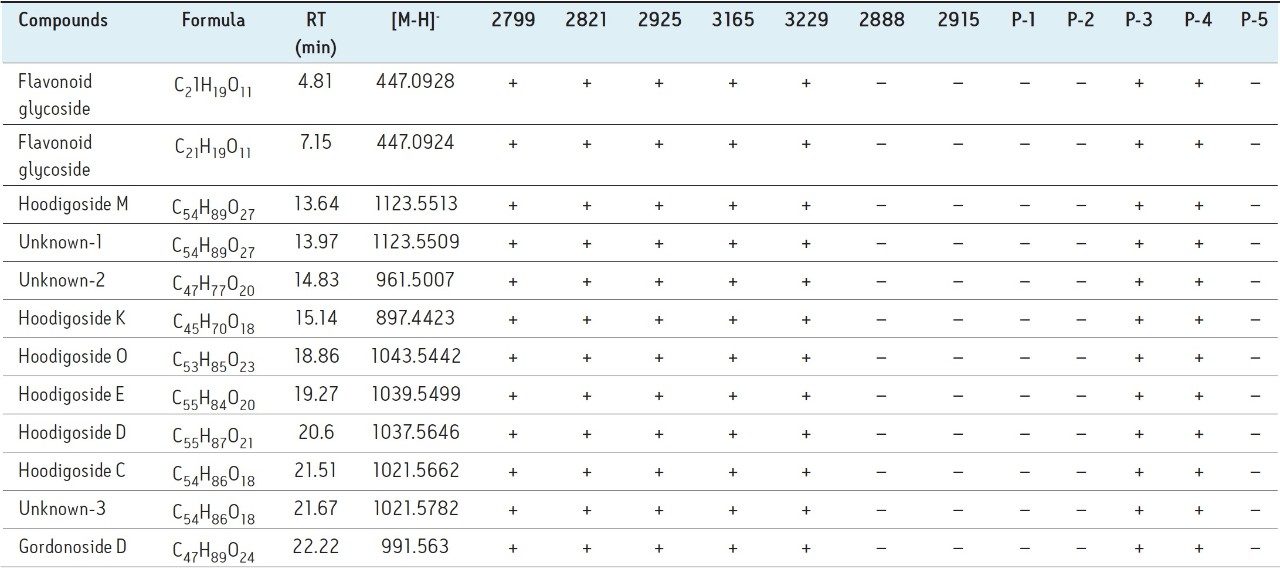
For the OPLS-DA analysis, we used all five H. gordonii samples collectively as Group 1, and used the commercial Hoodia product as Group 2. As there are five Hoodia products, the comparison was performed five times, each with a different Hoodia product as Group 2. The S-Plot generated by OPLS-DA for each of the group comparisons allowed leading markers to be obtained. Five S-Plots were obtained; hence five lists of leading markers were obtained, each showing the key markers that have major contributions of differentiating the two sample groups. From the five key marker lists, a group of twelve (12) markers were commonly shown in all lists indicating their positive existence in the H. gordonii samples.

The identification of the key markers was obtained by an elemental composition search, that matched the results with components reported from H. gordonii in literature references.4 This was further confirmed with fragment analysis from the high-energy MSE data obtained from the same injection.

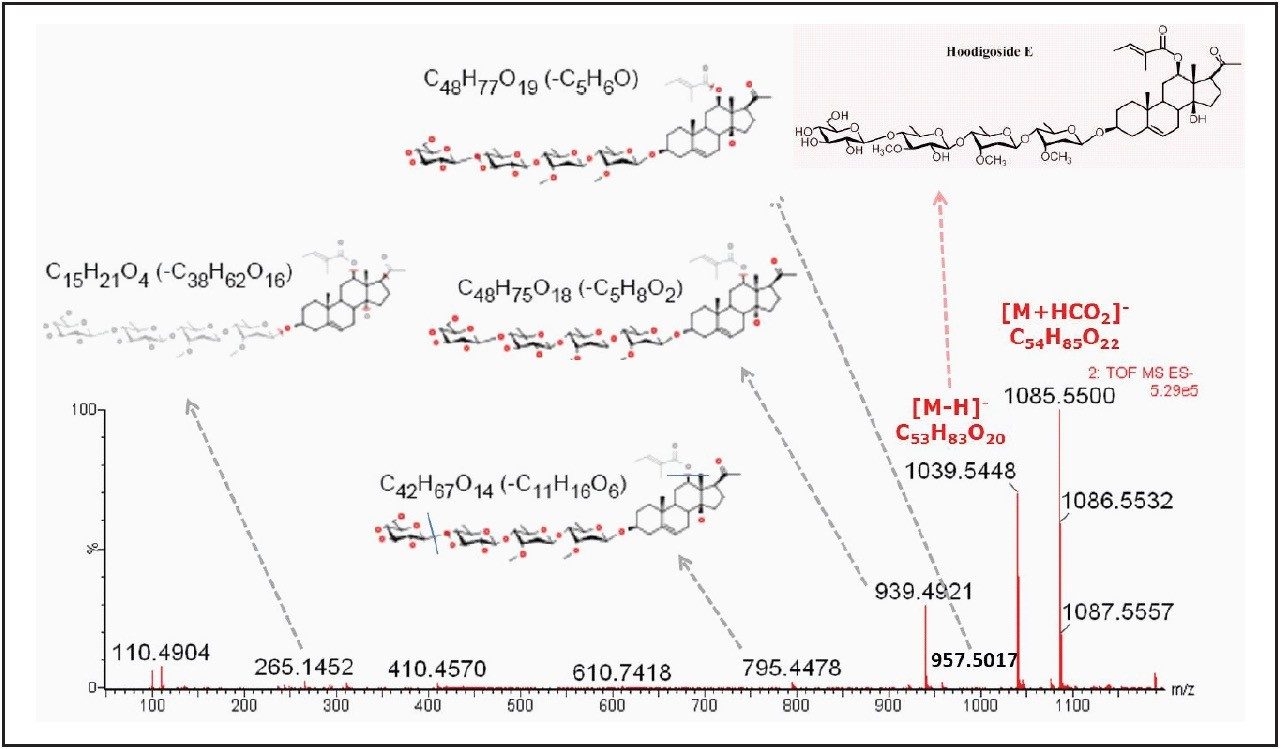
H. gordonii is a rich source of pregnane glycosides. In each of these steroidal glycosides there is always a sugar moiety linked to position C-3, and often there is a second moiety attached to C-20. The steroidal glycosides in Hoodia gordonii have been classified into two major core groups: hoodigogenin A and calogenin. The hoodigosides E, K, D, C, Unknown-2, Unknown-3, and gordonoside D have structures similar to hoodigogenin A . The hoodigosides M, O, and Unknown-1 have a structure similar to calogenin. In hoodigogenin-type compounds, the sugar moiety is substituted on the C-3 of aglycone for hoodigogenin compounds (the aglycone was characterized as 12-O-b-tigloyl-3b,14b-dihydroxy-pregn-5-ene-20-one) and tigloyl moiety attached to C-20. In calogenin-type compounds, a tigloyl moiety and the sugar linkage were present at C-3, and an attachment of (1 to 6) linked b-D-glucopyranoside units to C-20 of calogenin.

With the TOF MSE data acquisition strategy, the proposed structure of the key marker was confirmed by checking the fragment ions obtained at the high energy scan (obtained within the same LC injection). MassFragment Application Manager (imbedded in MassLynx Software) was used for automatic structural elucidation. In Figure 3, the the MSE spectrum provides the structural characterization of hoodigoside E, one of the key markers listed in Table 2. The structures of the fragments were automatically assigned if the intact parent structure was available as a mol file.

Figure 3. Structural characterization for Hoodigoside E automatically performed by MassFragment using the high energy spectrum.
Table 2. Key markers identified for H. gordonii as a result of the MSA analysis using the UPLC/oaTOF MSE analysis workflow.

Table 2 provides a summary of the twelve (12) key markers that were identified using the workflow specified above. Figure 4 shows the key marker generated by PCA for the dataset using only the key markers as the inclusion list.

Figure 4. The Scores Plot of the key marker PCA analysis result, which was obtained by processing the dataset with only the markers identified.

Conclusion

This application note demonstrated a simple UPLC/oaTOF MSE coupled with Multi Variate Statistical Analysis workflow to allow a list of key markers for H. gordonii to be identified. As a result, specific data analysis method was created. It contains identified key markers for H. gordonii so that authentication of commercial products, or their herbal extracts, can be easily accomplished with confidence.

References

  1. S A. National Biodiversity Institute, www.plantzafrica.com
  2. MacLean DB, Luo LG. Brain Research (2004) 1020, 1–11. 
  3. Avula B, Wang YH, Pawar R S, Shukla Y J Smillie T J, Khan I A, J. Pharm. Biomed. Anal. 2008, 48, 722–731.
  4. Sabine G. Schweiz. Zschr GanzheitsMedizin. 21(5), 300–306, 2009.

720004038, July 2011

Haut de la page Haut de la page