For research use only. Not for use in diagnostic procedures.
This is an Application Brief and does not contain a detailed Experimental section.
This application brief demonstrates the advantages of using ion mobility separation (IMS) in conjunction with a DESI imaging experiment on a mouse brain tissue section.
Desorption Electrospray Ionization (DESI) imaging directly from tissue section, followed by gas phase separation of molecules using ion mobility mass spectrometer.
Desorption electrospray ionization is a powerful and versatile direct ambient ionization technique for lipid imaging that requires minimal sample preparation and no matrix deposition. DESI can be utilized as a spatially resolved imaging technique by rastering a surface under an electrospray probe using a high precision XY stage. As the droplets from the electrospray source impact upon the sample surface, chemical constituents are desorbed and are directed towards the atmospheric inlet of the mass spectrometer. Ionization of various analytes occurs due to the charge imparted onto the droplets. The class of molecules that ionized preferentially by DESI directly from tissue is lipid related. Lipids are often closely related in structure and therefore can be potentially isobaric. An additional separation technique, orthogonal to the m/z separation technique in a mass spectrometer, can be necessary to add specificity to the DESI imaging experiment and therefore give true distribution of endogenous molecules within the tissue section.
Here we demonstrate that DESI imaging can be coupled with ion mobility separation (IMS), providing separation of ions in the gas phase based on their size, shape and charge. This capability provides evidence that DESI ionizes multiple classes of lipids directly from the surface of a mouse brain tissue section and the lipid ions are present in different charge states.
Snap frozen tissue of mouse brain was sectioned on a cryo-microtome to 20 µm thickness and thaw-mounted onto glass slides. The samples were stored at -80°C. Immediately prior to analysis the samples were brought to room temperature and placed onto the stage, with no further sample preparation required.
The Prosolia 2D DESI source was mounted onto a SYNAPT G2-Si HDMS DESI spray conditions were set at 3 µL/min, 90:10 MeOH: water, 120psi N2 gas pressure and a voltage of 5kV for both polarities. Images were acquired at 100 µm spatial resolution with the pixel size determined in the X-direction by the speed of the stage movement (100 µm/s) and acquisition rate of mass spectra (1s). The Y-direction was defined by the distance of 100 µm between two lines of acquisition.
Ion mobility separation occurred in the high-efficiency T-Wave IMS cell, filled with nitrogen gas at a pressure of 3 mbar. IMS provides an additional dimension of separation based on molecular size, shape and charge.
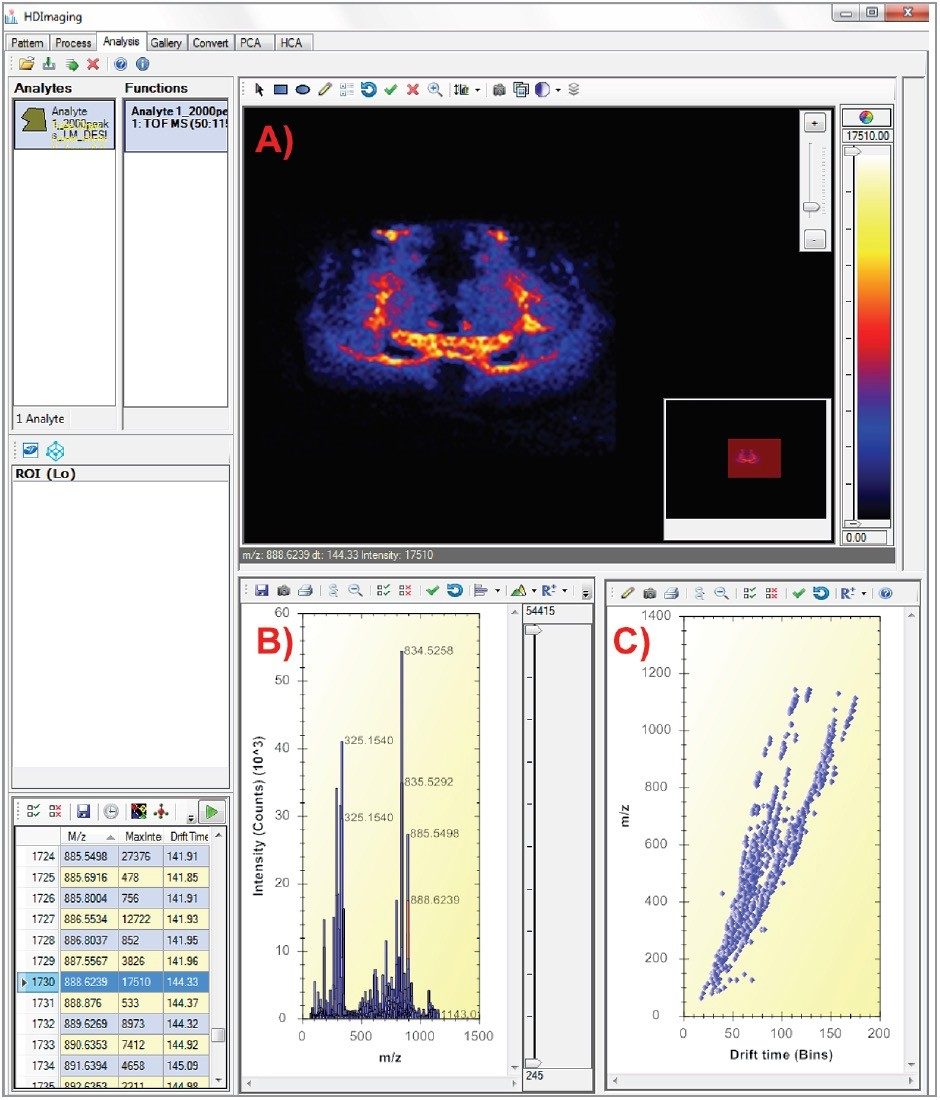
Following the DESI imaging acquisition, raw data were processed using the Waters High Definition Imaging (HDI) Software, with peak picking of the continuum raw data performed using the Apex 3D algorithm. Each subsequent component is described with a m/z and drift time (bin) value.
Figure 1A) displays the ion image of m/z 888.624, drift time 7.81 ms (identified as C24:1 Sulfatide sphingolipid) in the mouse brain. The HDI informatics fully integrates the ion mobility dimension by displaying the data in a 2D-plot fashion where the Y axis represents the m/z range and the X-axis represents the drift time (bins) as seen in figure 1C. Several nested trendlines of m/z and drift time can be observed in the DESI imaging data. These features are due to either different charge states, or different classes of molecules being present in the collected DESI data.
Further investigation of the different trendlines was performed by analyzing the continuum raw data using Waters Driftscope Software (figure 2). This enabled the detailed analysis of the raw data associated to specific m/z and drift time regions. From this analysis, it could be seen that there were triply charged species highlighted in the green trendline in figure 2A. Using lipid maps database (www.lipidmaps.org/), the species were identified as being from the gangliosides lipid family (figure 2B). Some of these also ionized as doubly charged ions and were observed in the red trendline in figure 2A. Further doubly charged ions at a lower m/z were identified as being acidic glycosphingolipids (figure 2C). Several trendlines of singly charged ions (blue) were also observed, representing different classes of lipids: fatty acids, lysolipids (figure 2D), and monomer glycerphospholipds (figure 2E).
Further experimental investigation was undertaken by selecting the doubly charged species at m/z 917.4 for a DESI MS-MS experiment to generate a collision-indiced dissociation (CID) fragmentation pattern for structural elucidation (Figure 3). The ion at m/z 1545.88 indicates the loss of charged Sialic acid from the precursor ion. There is also the fragment at m/z 153.00 of glycerol-3-phosphate ion with loss of H2O. Based on molecular mass, fragmentation pattern and comparison with literature, it was identified as the ganglioside GD1 (d18:1/18:0), however it was not possible to define the order of the glycan headgroups.
We thank Prof. Ron M.A. Heeren and Karolina Skraskova from Maastricht University for providing the mouse brain sample.
720005525, April 2017