Optimized Method Conditions for mRNA Characterization by SEC-MALS With GTxResolve™ Premier SEC 1000 Å 3 µm Columns
Abstract
Detailed characterization of the therapeutic drug substance, such as mRNA payload, is essential to ensure the safety and efficacy of gene therapy products. In this application note, we evaluated the efficiency of GTxResolve Premier SEC 1000 Å 3 µm Columns for size-exclusion chromatography coupled with multi-angle light scattering (SEC-MALS) to assess critical quality attributes of mRNAs. The hydrophilic MaxPeak™ High-Performance Surfaces (h-HPS) column hardware and high efficiency packed beds consisting of 3 µm bridged ethylene polyethylene oxide (BE-PEO) surface-modified silica exhibited enhanced sensitivity and low MALS noise with little to no particle shedding.1
Accurately assessing key quality attributes such as molar mass, size, and aggregation is essential for mRNA drug substances.2 This application note demonstrates the benefits of method development through systematic design of experiments (DoE) to ensure appropriate separation and accurate quantitation of molar mass, size, and aggregation of mRNA drug substances. The optimized SEC-MALS method employed in current investigations can yield quality molar mass measurements, aggregation profiling, structural, and conformational insights with robust, reproducible analyses.
Benefits
- The 1000 Å pores offer appropriate and well-matched fractionation range for a wide range of mRNA sizes
- Bridged Ethylene Polyethylene Oxide (BE-PEO) surface-modified silica provides low MALS noise suitable for high-confidence biophysical measurements of mRNA
- The particle size (3 µm) is suitable for resolving smaller and larger components of complex dsDNA ladder
- Low absorption surfaces provide flexible and expedient method development
Introduction
Significant interest has been shown in advancing and utilizing messenger ribonucleic acid (mRNA) technologies for therapeutic products, particularly highlighted by the development of COVID-19 vaccines. mRNA molecules are transient biopolymers that convert genetic information into functional proteins.3 This mRNA technology has proven to be faster in development and manufacturing than other vaccine platforms, making it a promising solution for addressing future pandemics and other infectious diseases like rabies, Zika virus, and cytomegalovirus infections.4 The theoretical risk of integrating the target gene into the host genome is minimized when using mRNA-based vaccines, relative to viral vectors, due to their transient nature and their degradation after protein translation. On the other hand, stability and storage concerns can be problematic for mRNA therapeutics requiring ultra-cold conditions. Thus, it is essential to quantify key quality and stability-indicating attributes that potentially affect potency and efficacy.
Size-exclusion chromatography coupled with multi-angled light scattering (SEC-MALS) with an optimized method has been shown to effectively measure biophysical attributes of mRNA, such as molar mass, aggregate percentage, radius of gyration (Rg), hydrodynamic radius (Rh), and Rg/Rh ratios, for comprehensive insights into the size, conformation, and purity of mRNA molecules. These attributes are critical not only during the development process but also in the final therapeutic product. In this application note, we demonstrate the utility of systematic optimization (DoE) of mobile phase composition for improved separation of a typical mRNA (Cas9) molecule using a GTxResolve Premier SEC 1000 Å 3 µm 4.6 x 150 mm Column. The high-efficiency column was also used to highlight the size-based separation of a dsDNA ladder and mRNA products and to demonstrate the necessity of molar mass quantitation by MALS in order to provide the identity of peaks that differ in conformation and elution properties.
Experimental
The mobile phase for all SEC separations was 50 mM Tris-HCl, 150 mM NH4Cl pH 7.5, filtered to 0.1 µm.
Waters dsDNA 50 to 1350 Ladder was prepared by reconstituting the lyophilized sample with 100 µL of 18.2 MΩ water and gently aspirating up and down with a 100 µL pipette to obtain a 1 mg/mL working solution.
Porcine thyroglobulin (PTG) (Sigma, p/n: T1126–100 mg) was prepared by dissolving in PBS at a 1.0 mg/mL concentration and filtered to 0.1 µm.
eSpCas9 mRNA (N1-Methylpseudouridine/m1Ψ) (Cas9-mRNA) (Neat) was obtained from GenScript and stored at -80 °C. The sample was thawed to room temperature and placed in an LC sample manager maintained at 6 °C.
eSpCas9 mRNA (N1-Methylpseudouridine/m1Ψ) (Cas9-mRNA) was annealed by incubating the thawed sample in a 1.5 mL microcentrifuge™ tube for 2 minutes at 75 °C. The sample was reannealed by immediately cooling at 6 °C in an LC instrument sample manager maintained at 6 °C.
TriLink™ CleanCap® FLuc (5 moU) 100 µg (p/n: L-7202–100) was obtained from TriLink BioTechnologies and stored at -80 °C. The sample was thawed to room temperature and placed in an LC sample manager at 6 °C.
TriLink™ CleanCap® EPO-mRNA (5 moU) 100 µg (p/n: L-7209–100) was obtained from TriLink BioTechnologies and stored at -80 °C. The sample was thawed to room temperature and placed in the LC sample manager at 6 °C.
LC Conditions
|
LC system: |
Arc Premier™ with Quaternary Solvent Manager (QSM) and Flow Through Needle Sample Manager (SM-FTN) |
|
Vials: |
Max Recovery Vials and Caps (Waters p/n: 186000327C) and Waters 300 µL polypropylene screw neck vial (Waters p/n: 186004112) |
|
Column(s): |
• GTxResolve Premier SEC 1000 Å, 3 µm, 7.8 x 300 mm Column (Waters p/n: 186010738) • GTxResolve Premier SEC 1000 Å, 3 µm, 4.6 x 150 mm Column (Waters p/n: 186010735) |
|
Column temperature: |
40 °C |
|
Sample temperature: |
6 °C |
|
Sample manager washes: |
18.2 MΩ water |
|
Seal wash: |
10 % HPLC grade methanol / 90% 18.2 MΩ water (v/v) |
|
Samples and injection volume: |
• Porcine thyroglobulin (PTg): 50 µL • Waters dsDNA 50 to 1350 Ladder: 8 µL • TriLink CleanCap™ FLuc mRNA: 8 µL • TriLink CleanCap EPO-mRNA: 8 µL • GenScript™ eSPCas9 mRNA (N1-Methylpseudouridine/m1Ψ): 8 µL) |
|
Flow rate: |
0.30 mL/min |
|
Mobile phase A: |
50 mM Tris, 150 mM NH4Cl pH 7.5 |
|
Sample(s): |
Porcine thyroglobulin (PTg) (Sigma, p/n: T1126–100 mg); Waters dsDNA 50 to 1350 Ladder (Waters p/n: 186010778); TriLink CleanCap FLuc (5moU) 100 µg (p/n: L-7202–100); TriLink CleanCap EPO-mRNA (5moU) 100 µg (p/n: L-7209–100); GenScript eSpCas9(N1) mRNA 1 mg/mL (p/n: SC2325–1 mg) |
|
Gradient: |
Isocratic |
|
LC system control: |
HPLC CONNECT™ 4 Software |
Detector conditions
|
Multi-angle light scattering (MALS): |
Wyatt DAWN™ MALS Detector with a WyattQELS ™ embedded online Dynamic Light Scattering (DLS) Module |
|
UV/Vis: |
Arc Premier W2998 PDA Detector Channel 1: 280 nm with a resolution at 4.8 nm; Channel 2: 260 nm with a resolution at 4.8 nm |
|
Refractive Index (dRI): |
Wyatt Optilab™ dRI Detector |
|
Data Acquisition and analysis: |
ASTRA™ 8 Software |
Results and Discussion
Exploring method conditions
Taking full advantage of SEC requires method optimization. This is because the entropy-based distribution of solute between internal pores and interstitial column volume is often influenced by unwanted secondary interactions (electrostatic, H-bonding, hydrophobic), which adversely impact analyte solubility, retention, and structure and compromise the separation quality and component recovery of the drug substance. Factorial designs involving rational Design of Experiments (DoEs) can help identify the effects of different variables and help optimize the most influential factors to understand the relationship between mobile phase input variables and the observed responses.4 A 2-level design for the screening phase followed by 23 full factorial designs were run to screen for both quantitative and categorical factors. The individual blocks examined the effect of co-solvent (organic modifier), ionic strength, and temperature of the mobile phase (quantitative factors). The effect of categorical factors (type of buffer and additives, including PBS and Tris buffers and ammonium and magnesium salts) was studied in separate experimental blocks. The monitored responses include (1) pre-peak area % (high molecular weight-HMW amount), (2) total peak area (recovery), (3) the elution time of the monomer peak, (4) the width of elution window (including all observed peaks), and (5) the width of the monomer peak. Cas9 mRNA was used as test species because of the presence of a significant amount of HMW species.
We hypothesized that the routine analysis adopted for proteins is not suitable for nucleic acids because of the differences in physicochemical properties. After evaluation of the input factor effects, three influential mobile phase factors were identified as affecting the separation performance: (1) the nature of the additive (chaotropic or "water structure breaking" vs. kosmotropic or "water structure forming"), (2) the ionic strength, and (3) the column temperature. Organic co-solvents showed no significant effects. Interestingly, the cation of the additive seemed to have a greater effect than the anion. Ammonium salts were found to be beneficial. It is worth mentioning that MgCl2 as an additive may result in high selectivity and resolution at 10 mM concentration, but a huge negative effect was always observed on mRNA recovery. Therefore, we decided to avoid the use of magnesium salts. In general, separation improved up to 200–250 mM mobile phase total ionic strength, but further increases did not result in separation improvement. Increased temperature also significantly improved selectivity and resolution.
To conclude, ammonium chloride or ammonium sulfate as an additive in combination with Tris buffer and elevated temperature were found to be good conditions for high resolution separation and high recovery. Our recommendation is to start with mobile phase consisting of 50 mM Tris (pH 7.5) and 250 mM NH4Cl, and column temperature of 40–50 °C. Figure 1 illustrates our DoE approach and shows a comparison between a historically set (non-ideal) condition and optimized condition when injecting Cas9 mRNA sample.
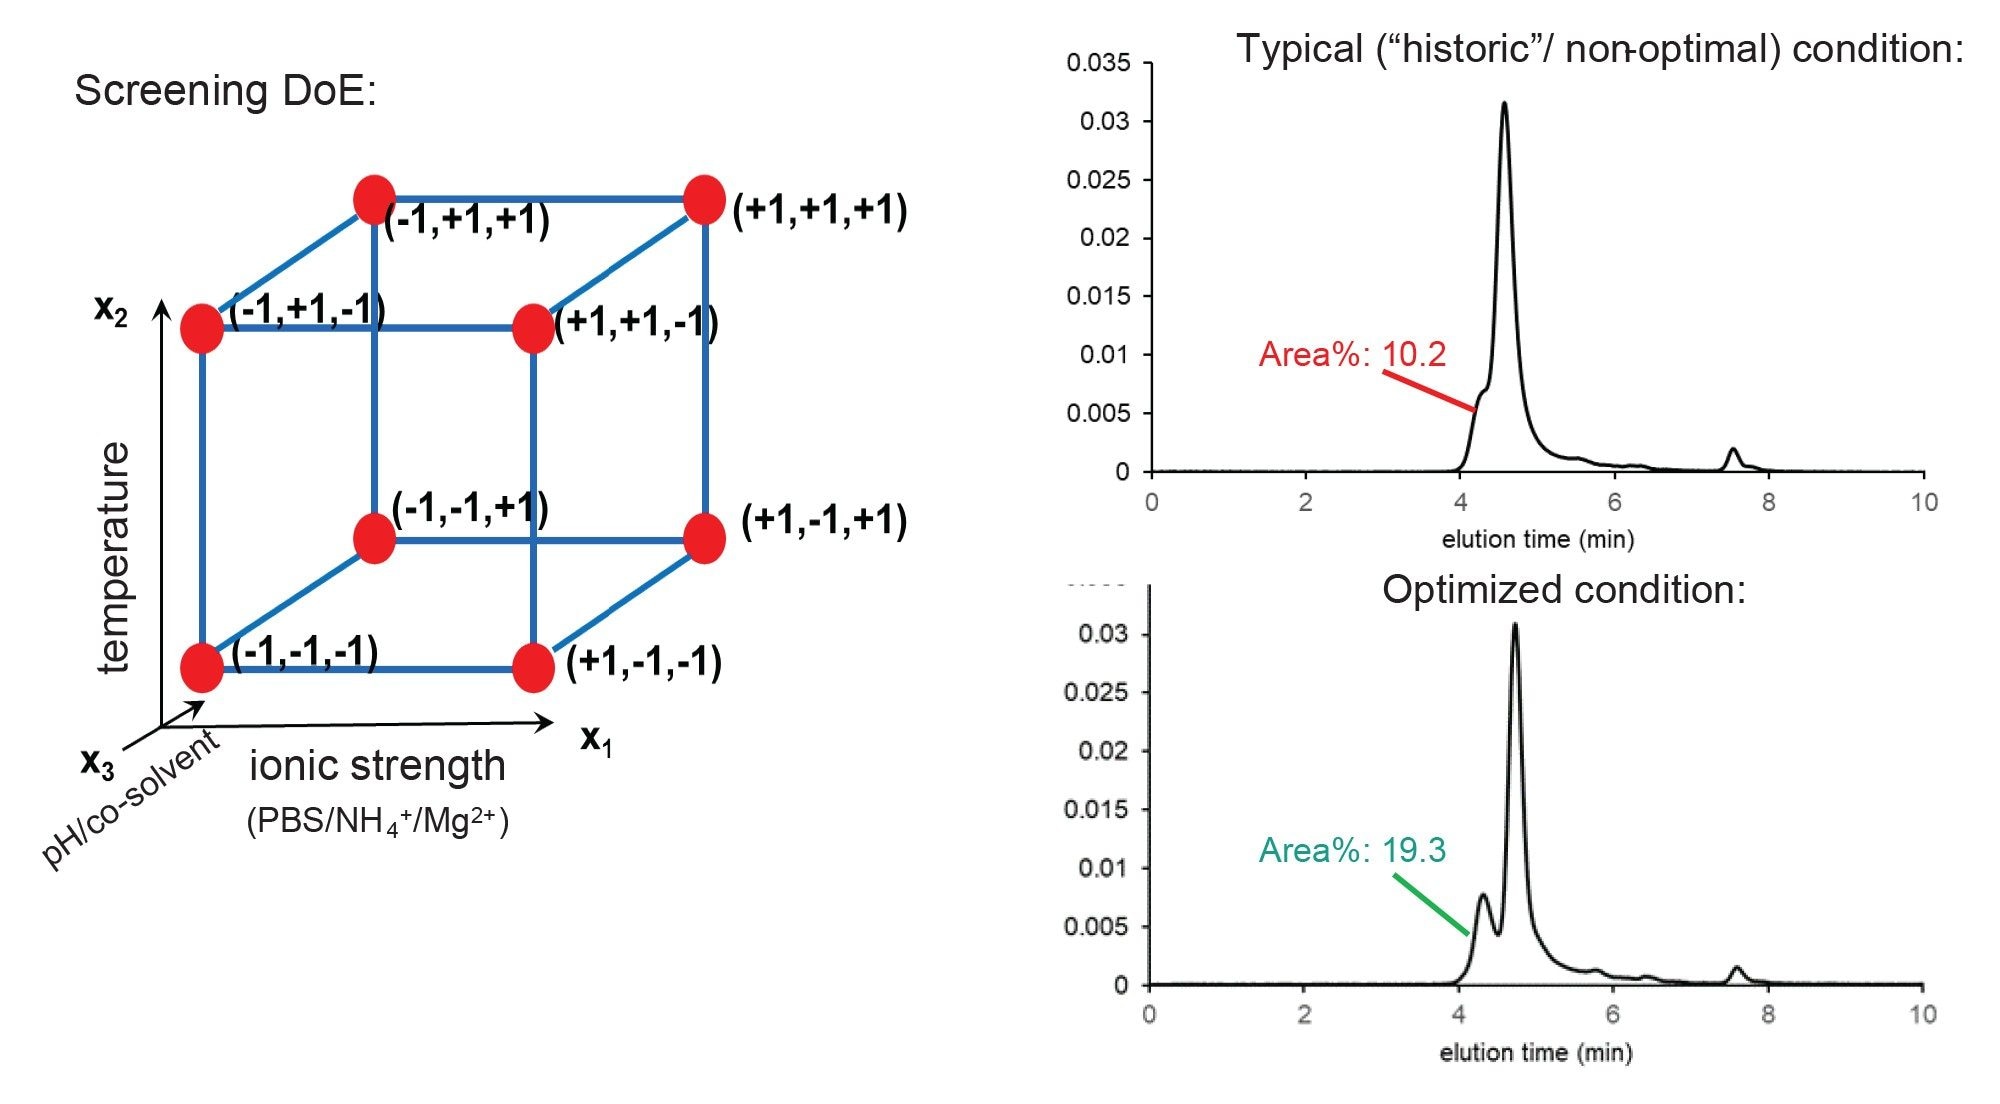 Figure 1. Schematic illustration of screening DoE approach (left) and comparison of Cas9 mRNA chromatograms obtained using non-optimized and optimized conditions (right). The optimized condition corresponds to: Mobile phase: 50 mM TRIS (pH 7.5) + 250 mM NH4Cl, Temperature: 50 °C, F=0.25 mL/min, Column: GTxResolve Premier SEC 1000 Å, 3 µm, 4.6 x 150 mm Column (Waters p/n: 186010735).
SEC-MALS Analysis of mRNA using Optimized Method Conditions
Using the DoE method conditions established in the previous section, multi-attribute quantitation of several mRNAs and a dsDNA ladder were performed by size-exclusion chromatography coupled with UV, MALS, and dRI detection (SEC-MALS). SEC-MALS was performed using 50 mM TRIS (pH 7.5) +250 mM NH4Cl with temperature set at 40 °C and column flow rate set at 0.30 mL/min. HPLC CONNECT software was developed to run synergistically with Arc™ Premier system and ASTRA software for SEC-MALS method development, data acquisitions, and processing. Porcine thyroglobulin was used to determine system parameters, including normalization, band broadening, and alignment, (results not shown here) before mRNA evaluations.
In addition to characterizations that standard SEC-UV methods provide, simultaneously collecting UV, MALS, and RI signals in an SEC method enables the absolute measurement of molar mass, Rg and Rh, and UV extinction coefficients, providing a simple and efficient workflow for elucidating multiple quality attributes simultaneously. This combination of information enables researchers to identify each eluting peak, independent of elution time. In addition, evaluating size (via Rg and/or Rh) with molar mass provides key conformational information about each eluting peak and can inform whether an unexpected elution time is the result of column interactions or differences in molecular structure relative to a traditional size standard. Finally, the directly measured extinction coefficient can be used in orthogonal offline measurements and is critical for routine quantitative analyses, quality control, and dosing.
Waters 50–1350 dsDNA standard was used for system suitability to validate column performance for SEC-MALS (Figure 2). The Waters dsDNA ladder is a mixture of 17 double-stranded DNA species ranging from 50 to 1350 base pairs and is designed and certified for use with SEC columns of pore size greater than 450 Å. Figure 2A shows the UV chromatogram for dsDNA ladder (8 µL) acquired on GTxResolve Premier SEC 1000 Å, 3 µm, 7.8 x 300 mm Column, with an overlay of the measured molar mass for each species as determined by MALS. All 17 species are well-distinguishable with some fully separated, with the peak profile corresponding to the relative abundance provided for the ladder. The measured weight-averaged molar masses (Mw) for each peak were in excellent agreement with the expected molar masses for each DNA species, as shown in Fig. 2B, where linear regression analysis yields a slope of 1.03 with 95% confidence interval between 1.00 and 1.05.
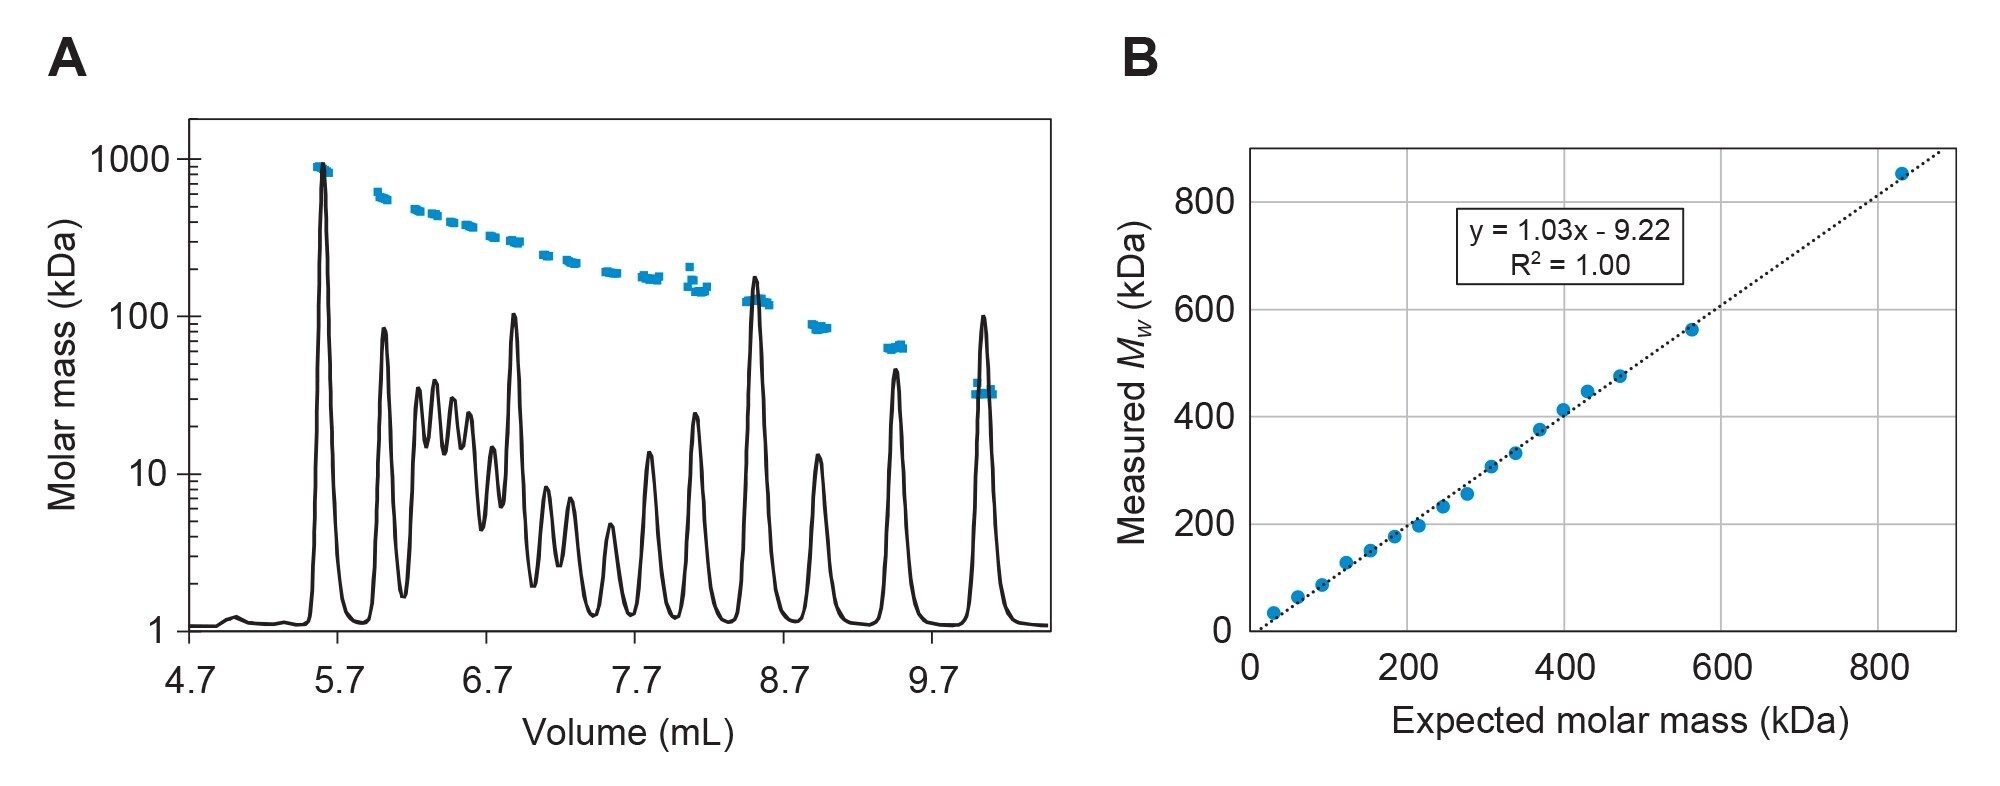 Figure 2. The molar mass of dsDNA Ladder superimposed on UV chromatograms acquired at 260 nm (A) and plot of weight-averaged molar mass for each eluting dsDNA species against expected molar mass for each species (B). Separation was performed using a GTxResolve Premier SEC 1000 Å, 3 µm, 7.8 x 300 mm Column (Waters p/n: 186010738) using 50 mM TRIS (pH 7.5) +250 mM NH4Cl, Temperature: 40 °C, Flow rate=0.30 mL/min.
SEC-MALS can provide key insights on the identity of complex and coeluting mixtures, which cannot be provided by SEC-UV alone. To demonstrate this, we analyzed two Cas9 mRNA samples with varying degrees of high molecular weight species (HMWS) and low molecular weight species (LMWS) using the same conditions discussed in the DoE experiments above. Figure 3 shows the measured molar mass overlaid onto the UV chromatograms for the two Cas9 mRNA samples. As expected, the UV chromatogram for the “neat” Cas9 mRNA sample (black curve), where the sample was thawed on ice from storage conditions and placed directly into the sample manager, shows significant UV absorption ahead of the main elution peak, indicating the presence of multiple high molecular weight species (HMWS). The weight-averaged molar masses (Mw) measured for the first and second HMWS peaks correspond roughly to trimer and dimer Cas9 mRNA species, respectively (Mw=4690 kDa and 3050 kDa, respectively). The Mw measured across the main peak (1530 kDa) is in agreement with theoretical monomer molar mass (1460 kDa) but is slightly elevated due to the coelution of HMWS. Denaturing aggregates with a short heat treatment followed by re-annealing removes nearly all the HMWS. Although the identity of the HMWS remains the same (mostly dimer and trimer), the mass fraction decreases from ~33% to ~2% (Table 1). Similarly, the decrease in coeluting HMWS results in the measured Mw of the monomer peak (1470 kDa) to within 1% of the theoretical monomer molar mass. Absolute identification of each eluting species can potentially provide insights into molecular interactions leading to the formation of high- and low-molecular weight molecules, sample integrity, and sample purity.
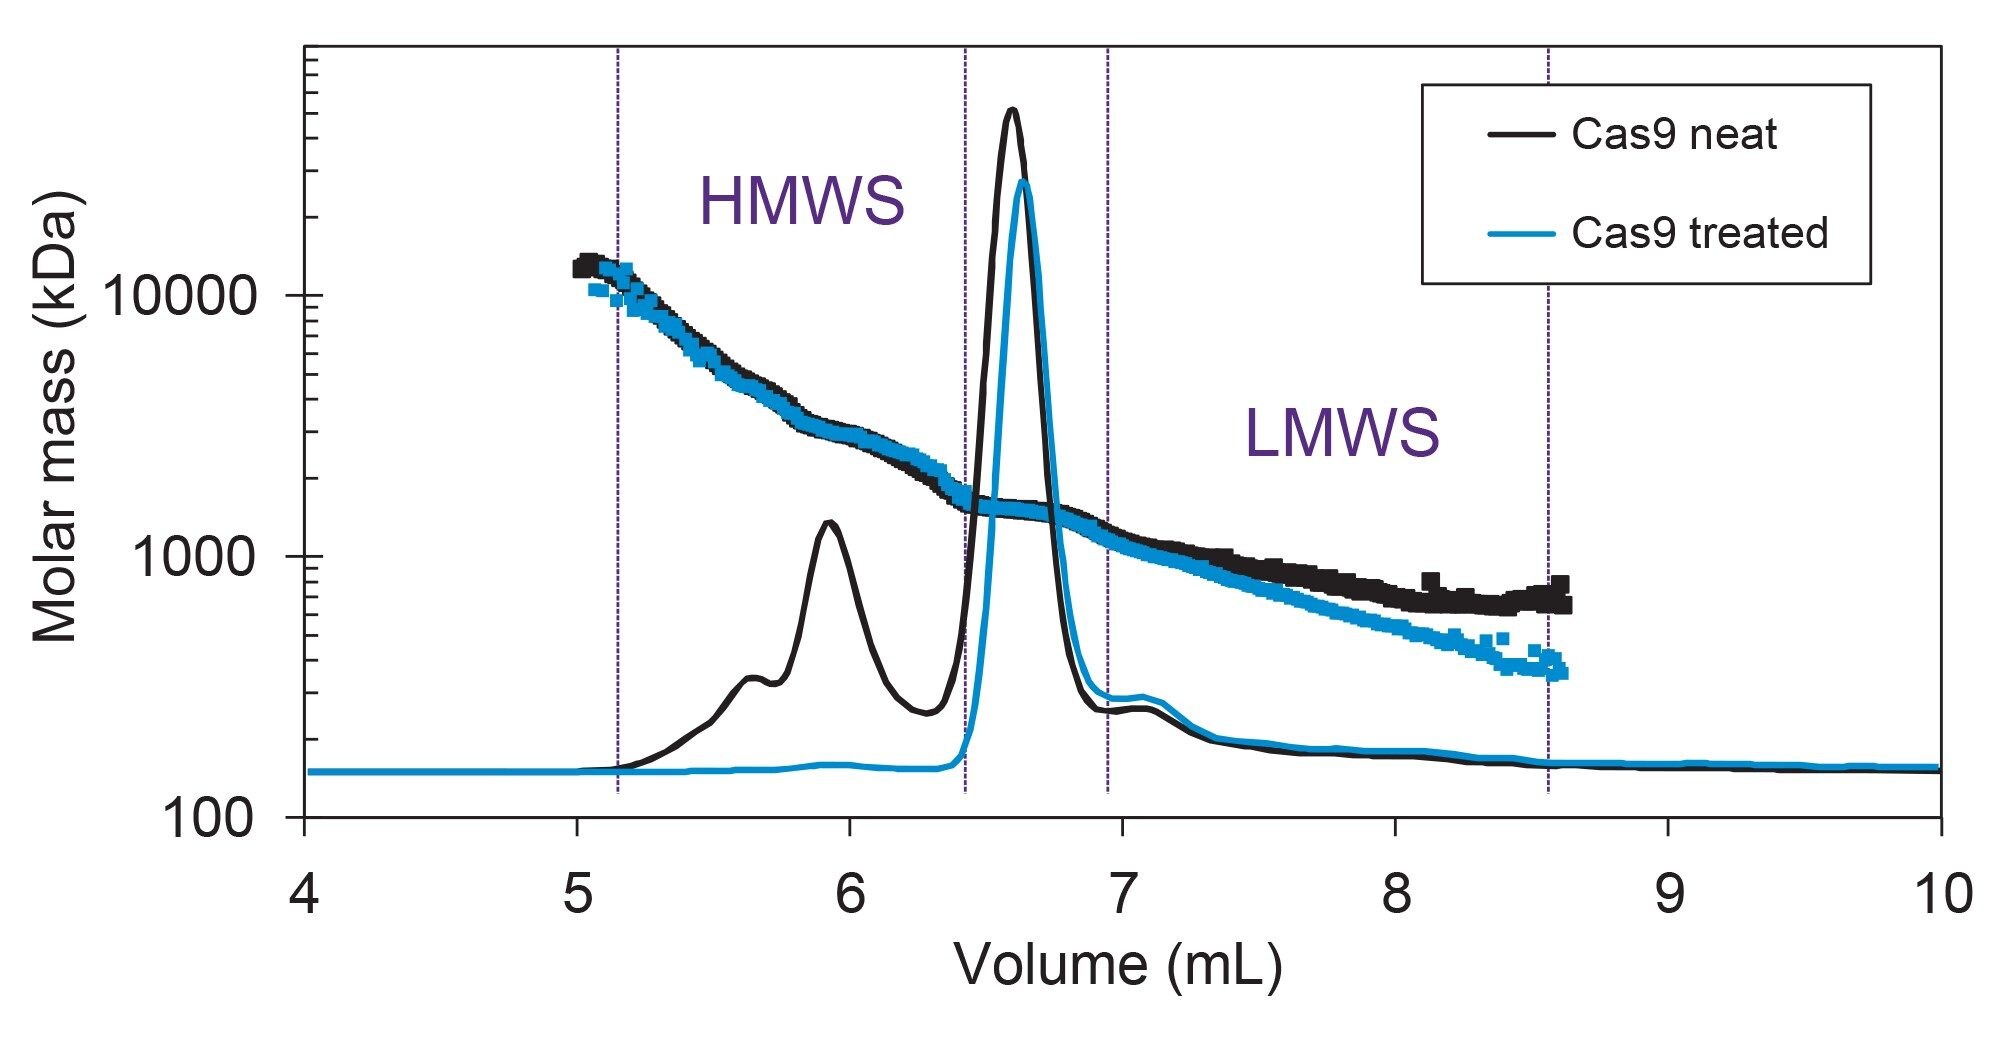 Figure 3. Molar mass of Cas9 mRNA samples injected neat (black) and after denaturing and reannealing (blue), superimposed on UV chromatograms acquired at 260 nm. Separation performed with a GTxResolve Premier SEC 1000 Å, 3 µm, 7.8 x 300 mm Column (Waters p/n: 186010738) using 50 mM TRIS (pH 7.5) +250 mM NH4Cl, Temperature: 40 °C, F=0.30 mL/min.
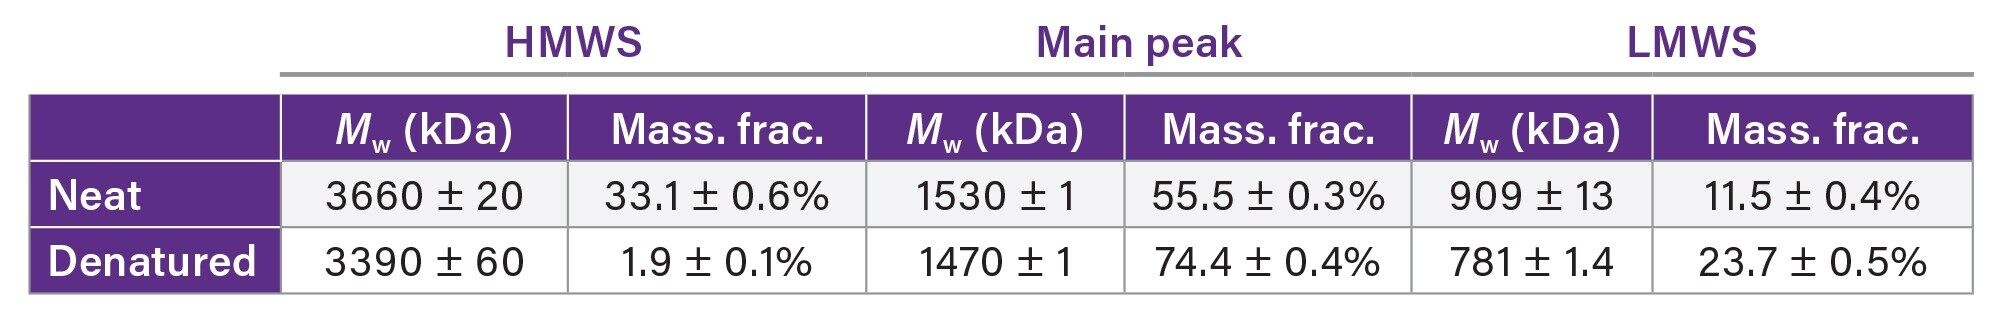 Table 1. Weight-averaged molar mass (Mw) and mass fraction, measured for three elution regions corresponding to high-molecular weight species (HMWS), mRNA monomer, and low-molecular weight species (LMWS). All values are average and standard deviation of three replicate injections.
Finally, we analyzed the elution time and measured molar mass for three mRNA samples compared to the dsDNA ladder: heat-treated and re-annealed Cas9 mRNA, firefly luciferase mRNA (FLuc), and erythropoietin mRNA (EPO). Figure 4 shows the measured molar masses overlaid onto the UV chromatograms for three different mRNA species run on the same HPLC setup and same conditions as the dsDNA ladder. Again, the absolute measurement of molar mass by MALS detector allows us to identify mRNA products with measured Mw values of Cas9 (blue), FLuc (green), and EPO (magenta) in excellent agreement with expected molar masses (summarized in Table 2).
In addition to molar masses and mass fractions, online UV-MALS-RI detection enables the measurement of other biophysical properties and sample attributes like size, UV extinction coefficient, and mRNA purity (A260/A280) with excellent reproducibility. Table 2 summarizes some of these measurements for each of the different mRNA samples used (n=3). Extinction coefficients measured at 260 nm are in near-perfect agreement with expected values for single-stranded RNA (~25 mL mg-1 cm-1, which corresponds to a conversion factor of 40 µg/mL). Similarly, A260/A280 measurements match the expected ratio of 2.1 for pure RNA (1.86–1.88 for dsDNA).5
The relationship between size—either hydrodynamic radius or radius of gyration—and molar mass is correlated with the conformation of the analyte. For large biomolecules, like mRNA, the molecular conformation can be assessed by plotting Rg versus molar mass on a log-log plot and evaluating the slope of line of best fit. For highly compact molecules, that slope is expected to be close to 1/3, for a random coil polymer 1/2, and for a rigid rod 1. Doing this conformation analysis for the dsDNA ladder and three mRNA produces slopes of 0.75 and 0.43, respectively, suggesting that the dsDNA forms a long, extended structure whereas the mRNA exists as a compact linear coil. These observations are in good agreement with the known structure of these molecules, whereby the double-helix of dsDNA locks the molecule into an extended structure that grows with a prescribed geometry, as compared to mRNA which is more flexible.
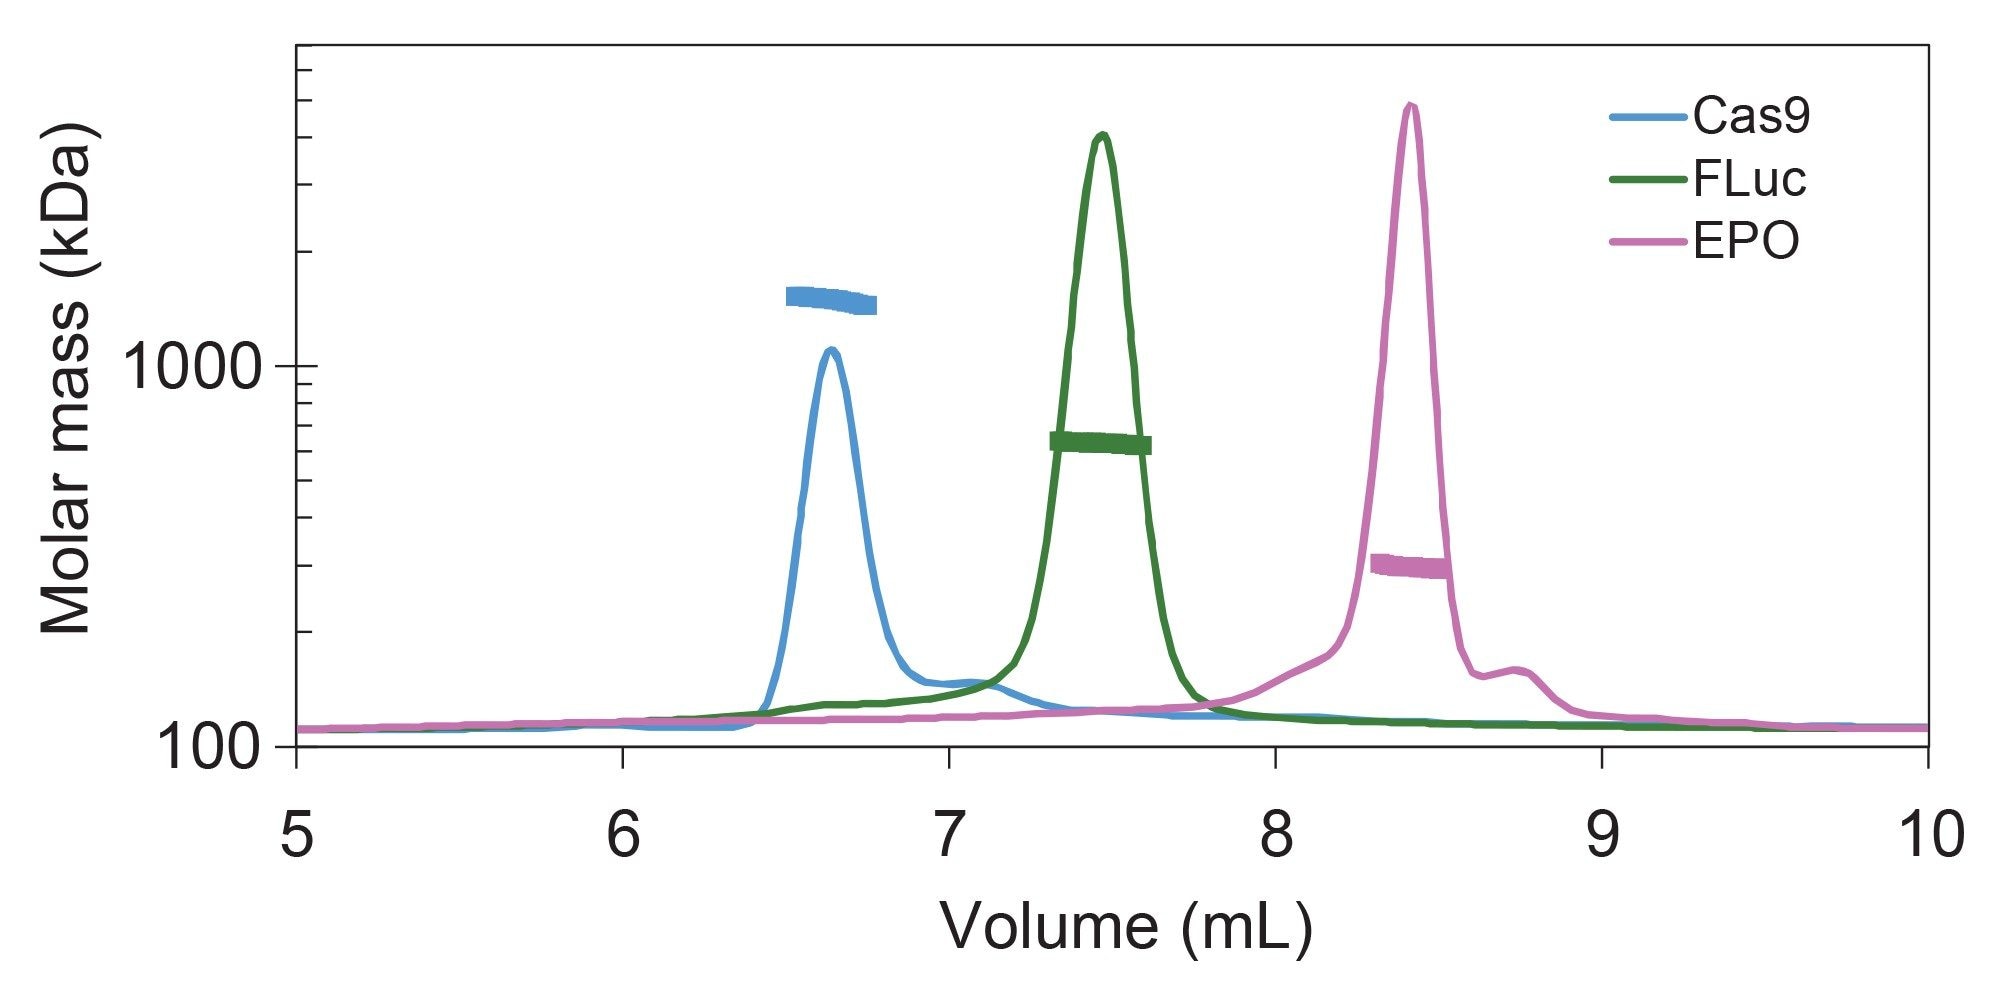 Figure 4. Molar mass of Cas9 (blue), Firefly Luciferase (FLuc) (green), and erythropoietin (EPO) (magenta), superimposed on UV chromatograms acquired at 260 nm. Separation performed using GTxResolve Premier SEC 1000 Å, 3 µm, 7.8 x 300 mm Column (Waters p/n: 186010738) using 50 mM TRIS (pH 7.5) +250 mM NH4Cl, Temperature: 40 °C, F=0.30 mL/min.
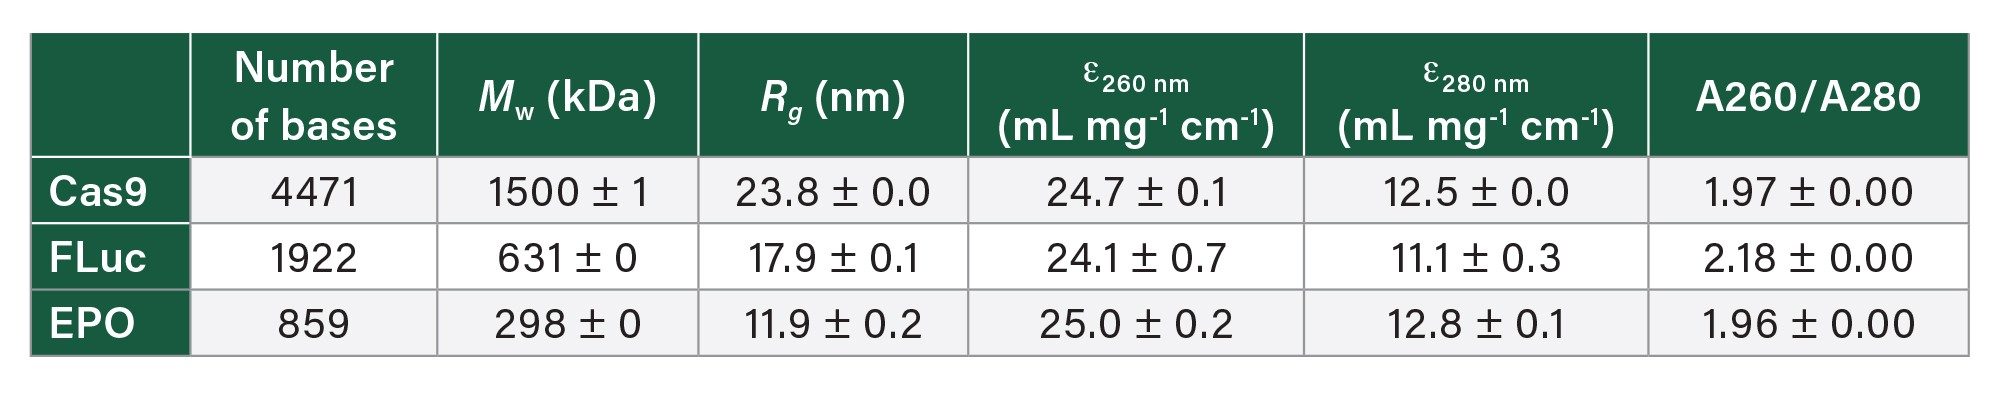 Table 2. Summary of measured attributes of Cas9, FLuc, and EPO mRNA. ɛ is the measured extinction coefficient for each sample and wavelength, and A is the UV peak area (AU min) for each sample and wavelength, calculated across the monomer peak in the sample. All results are average and standard deviation of three injections.
The molecular conformation insights provided by the MALS quantitation support for absolute measurements like SEC-MALS over a traditional calibration curve method with SEC-UV alone. The applicability of calibration curves is heavily impacted by differences in chemical and structural properties between calibration standards and user samples. Indeed, Figure 5B shows a typical calibration plot with measured Mw as a function of elution volume for both the dsDNA samples and the mRNA samples, illustrating the potential shortcomings of using a calibration curve for mass or size determination. (Scaling the y-axis in Fig. 5B to number of nucleotides does not improve the estimation of mRNA size, data not shown.) While the calibration curve indicates that all 17 dsDNA species are well-separated and elute in the linear range of the column, indicating great column performance and suitability, the use of dsDNA as a calibrant would have led to significant underestimation of the length and molar mass of the mRNA samples.
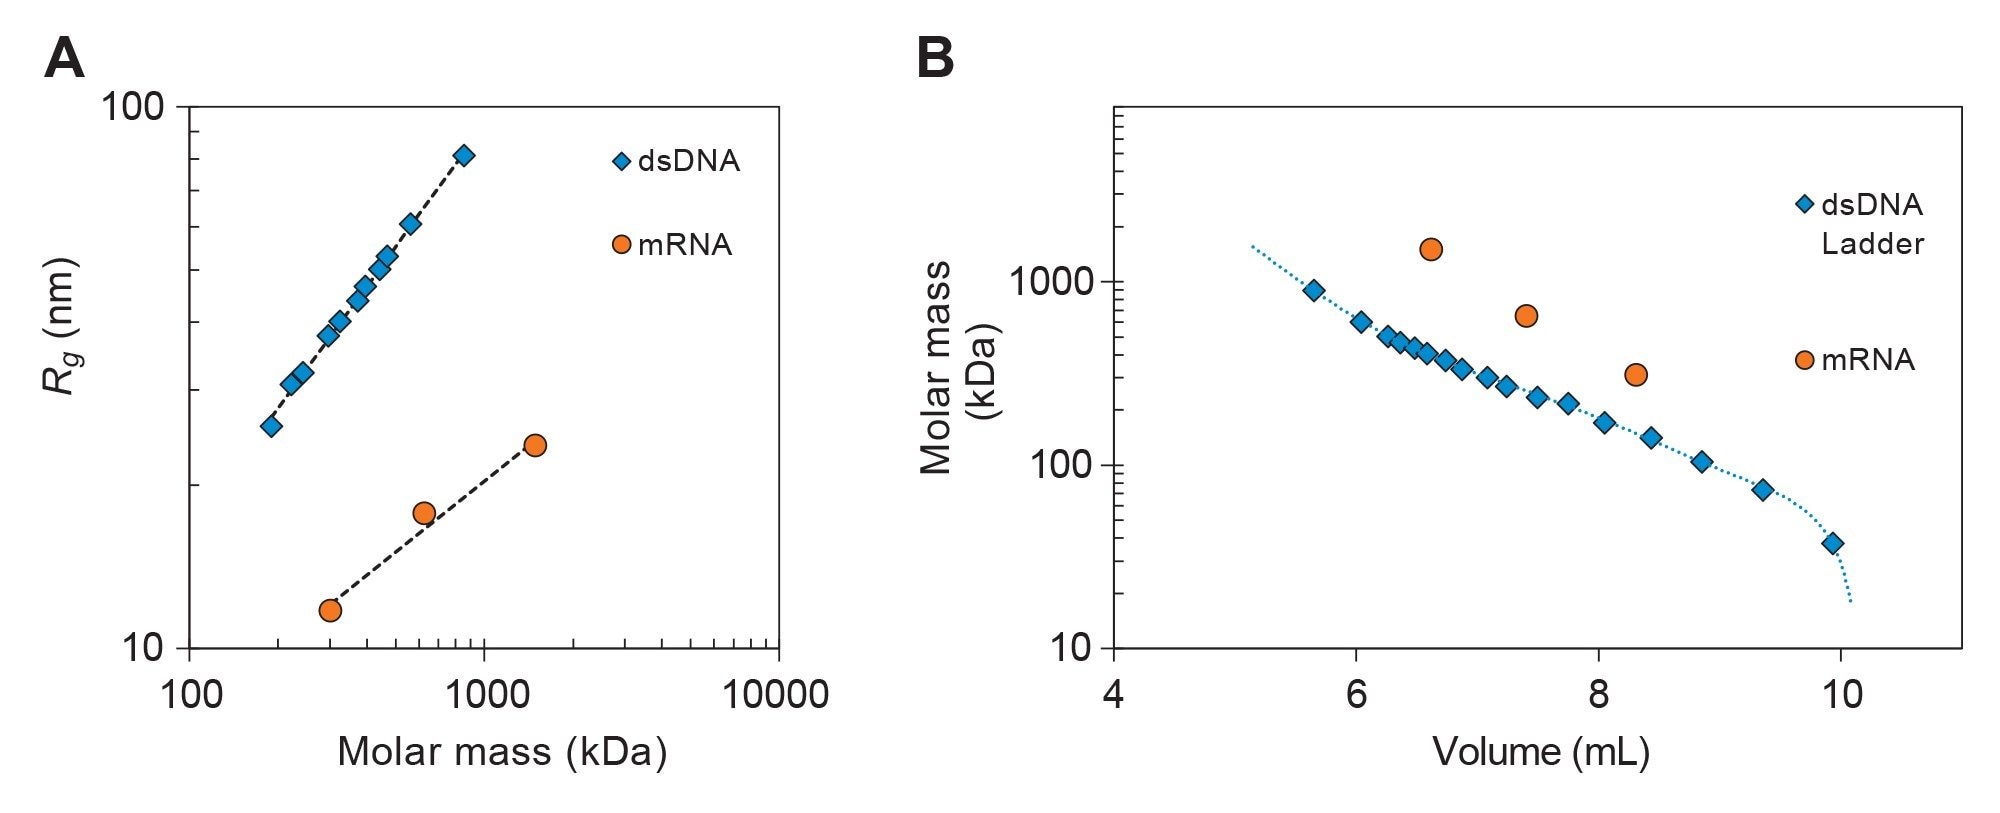 Figure 5. (A) Rg versus molar mass for select peaks from the dsDNA ladder and from the monomer peak of the Cas9, FLuc, and EPO mRNA samples. The position and slope of the data reflect the difference in conformation between dsDNA and mRNA. (B) Plot of measured weight-averaged molar masses of dsDNA ladder and mRNAs to show varying elution behavior.
Conclusion
In this application note, we illustrate the utilization of GTxResolve Premier SEC 1000 Å 3 µm Column technology, and the significance of optimized method conditions to give excellent resolution of mRNA biomolecules and quality MALS analysis for adequate biophysical attribute characterization. The appropriately matched pore size and inert particle of the packing material efficiently separated mRNA aggregates and fragments from monomer and dsDNA Ladder resolution to enable mRNA integrity analysis to ensure purity, identity, safety, and the efficacy of mRNA drug therapeutics.
References
- Camacho, K. J., Tchoul, O., Xu, Y., Finny, A. S., Kizekai, L., Byrd, S., Addepalli, B., Xu, M., Lauber, M., & McLaughlin, J. (2024). Bridged Ethylene Polyethylene Oxide Surfaces To Improve Packing Materials For Widepore Size Exclusion Chromatography. Journal of Separation Science, 47(20). https://doi.org/10.1002/jssc.202400541
- Wang, P., Akula, R., Chen, M., & Legaspi, K. (2023). SEC-MALS Method for Characterizing mRNA Biophysical Attributes. AN1616. Wyatt Technology Corporation.
- USP. (2023). Draft Guidelines: 3rd Edition Analytical Procedures for Quality of mRNA Vaccines and Therapeutics. United States Pharmacopeia. Retrieved from https://www.usp.org/sites/default/files/usp/document/about/usp-commitment-to-confidentiality.pdf
- S. Fekete, M.A. Lauber, A Systematic Quick Method Development Approach to Optimize Protein Size Exclusion Chromatography, Waters application note. 720007790, November, 2022.
- Giron Koetsier, Ph.D., and Eric Cantor, Ph.D. A Practical Guide to Analyzing Nucleic Acid Concentration and Purity with Microvolume Spectrophotometers. New England Biolabs. 2019.
GTxResolve, MaxPeak, HPLC CONNECT, DAWN, WyattQELS, ACQUITY, Arc, Optilab and ASTRA are trademarks of Waters Technologies Corporation. Millex is a trademark of Merck KGAA. TriLink and Clearcap are trademarks of TriLink Biotechnologies, LLC. Eppendorf is a trademark of Eppendorf SE. GenScript is a trademark of Nanjing Genscript Biotech Co. Ltd. All other trademarks are the property of their respective owners.
Featured Products
720008669, January 2025