• 应用纪要

TargetLynx Application Manager

TargetLynx Application Manager

  • Waters Corporation

This is an Application Brief and does not contain a detailed Experimental section.

Abstract

This application brief demonstrates about TargetLynx Application Manager.

Introduction

Environmental, human health, legal, and financial implications of quantitative MS analyses has lead to regulatory requirements for confirmatory and quality control checks on analytical results. Regulatory or statutory methods often require specific data processing, including the monitoring of multiple structurally specific fragment ions, evaluation of chromatographic peak quality (width, area, shape and/or retention time) against predefined windows. To manually evaluate data sets against these requirements is both labor intensive and expensive. Data has typically been evaluated as exported data utilizing macros in spreadsheet programs; a major disadvantage of this procedure was no interactivity between data evaluation results and the original data. The Waters TargetLynx Application Manager automates data acquisition, processing and reporting, incorporating a wide range of confirmatory checks that identify samples falling outside user-specified or regulatory thresholds, providing confidence in quantitative results. A diagram of the workflow is shown in Figure 1.

Figure 1. TargetLynx Application Manager Workflow.

The TargetLynx Application Manager, an option with Waters MassLynx Software, provides accurate quantitative results from LC-MS and GC-MS data. The program operates on groups of data files to generate quantitative results sets. Results sets may be reviewed electronically, exported to LIMS or printed. TargetLynx quickly generates results from acquired data sets permitting accurate quantification and review of results, including evaluation of data quality and analyte confirmation. Any required reprocessing is accomplished within the standalone results file.

Results and Discussion

Regulatory Requirements

TargetLynx provides confirmatory and QC checks for a wide range of analyses. Such checks are often mandatory as legislation covering quantitative analysis using mass spectrometry is in place in a variety of application areas, including:

  • Food Safety Analysis
  • Pharmaceutical Analysis
  • Clinical Analysis
  • Sports Doping
  • Environmental Analysis

The MassLynx data security model extends to TargetLynx. The electronic TargetLynx results file includes an internal audit trail, and allows the use of electronic signatures.

How TargetLynx Works

TargetLynx methods define the processing parameters necessary to create a results set from the samples included in a MassLynx Sample List. Processing methods may be applied to GC-MS, LC-MS or LC-MS/MS data in any acquisition mode (e.g. full scan, selected ion recording or multiple reaction monitoring). Data may be processed when acquired or at a later time. The method editor is used to create a quantification and confirmation method for all compounds assayed in a sample set. It allows the user to define quantification parameters (for peak location and detection, calibration curves etc.) and criteria for QC and confirmatory checks. Results are then presented in the browser. The browser enables online review and re-processing of calculated results. A variety of sample flags allows easy location and review of samples that fail defined QC and confirmatory criteria.

Creating A TargetLynx Method

The TargetLynx Method Editor (Figure 2) has a range of user-settable parameters to optimize integration, calibration, quantification, reporting and data export to other systems such as LIMS.

Figure 2. TargetLynx Method Editor - Customizable selection of relevant parameters for display.

The editor permits users to define a full range of functionality as required. Configurable views optimize the editor for particular applications. The views include:

  • All Parameters – customizable to allow all parameters of interest to e viewed in a single pane
  • Compound Properties – includes compound name, retention time, quantification trace and maximum concentration limit
  • Calibration Properties – includes calibration reference (internal standard), polynomial type and linearity threshold
  • Integration Properties – includes smoothing, peak detection, thresholding, and peak quality parameters
  • Targeting Properties – confirmatory transitions, target ratios and tolerances
  • Calculation Factors – toxic equivalence (for dioxin analysis) and detection limits

Suitability of chromatographic data is automatically evaluated using Peak Quality criteria. Regulatory methods specify strict criteria for ion ratio tolerances. TargetLynx automatically updates ion ratios for variations that occur due to changes in instrument tuning or environmental conditions using one or more reference standards in the sample sequence. Method Editor parameters can be stored for all compounds of interest to build up a ‘compound library’ of parameters to simplify method creation for compounds previously used.

Quantifying Samples

When processing from the MassLynx Sample List, settable processing options (Figure 3) include:

  • Acquire data
  • Integrate samples
  • Calibrate standards
  • Quantify samples
  • Report results
  • Export results
Figure 3. TargetLynx Processing Options.

Peak integration is accomplished with ApexTrack, an advanced peak detection algorithm. The ApexTrack algorithm automates chromatographic peak detection and baseline determination (including tailing, skew, shoulders) and avoids manual optimization of integration for individual peaks where chromatography is not ideal.

After integration, TargetLynx develops calibration curves for sample components from samples defined as standards in the sample list. A variety of polynomial curve fitting routines with or without internal standards and with or without sample weighting are available. 

Following calibration, samples with unknown concentrations are quantified from the fitted calibration curves and the integrated responses in the unknown samples. Following quantification, all results are evaluated against quality criteria defined in the method. 

During results review, it is possible to manually adjust integration of peaks and recalculate the results.

Reviewing Results

Processed results are presented in the TargetLynx Browser (Figure 4). The Browser consists of several configurable panes to display information related to particular samples or compounds. The panes are:

  • Sample summary table
  • Overview panel
  • Calibration curve with Residuals plot
  • Chromatogram display
  • Data security record [Audit trail] where required
Figure 4. TargetLynx Browser Window.

Data can be reviewed and reprocessed without access to the raw data. The result file contains all method parameters, which can be changed and saved within the file, and permitting recalculation of results. All changes are logged to the encrypted audit trail.

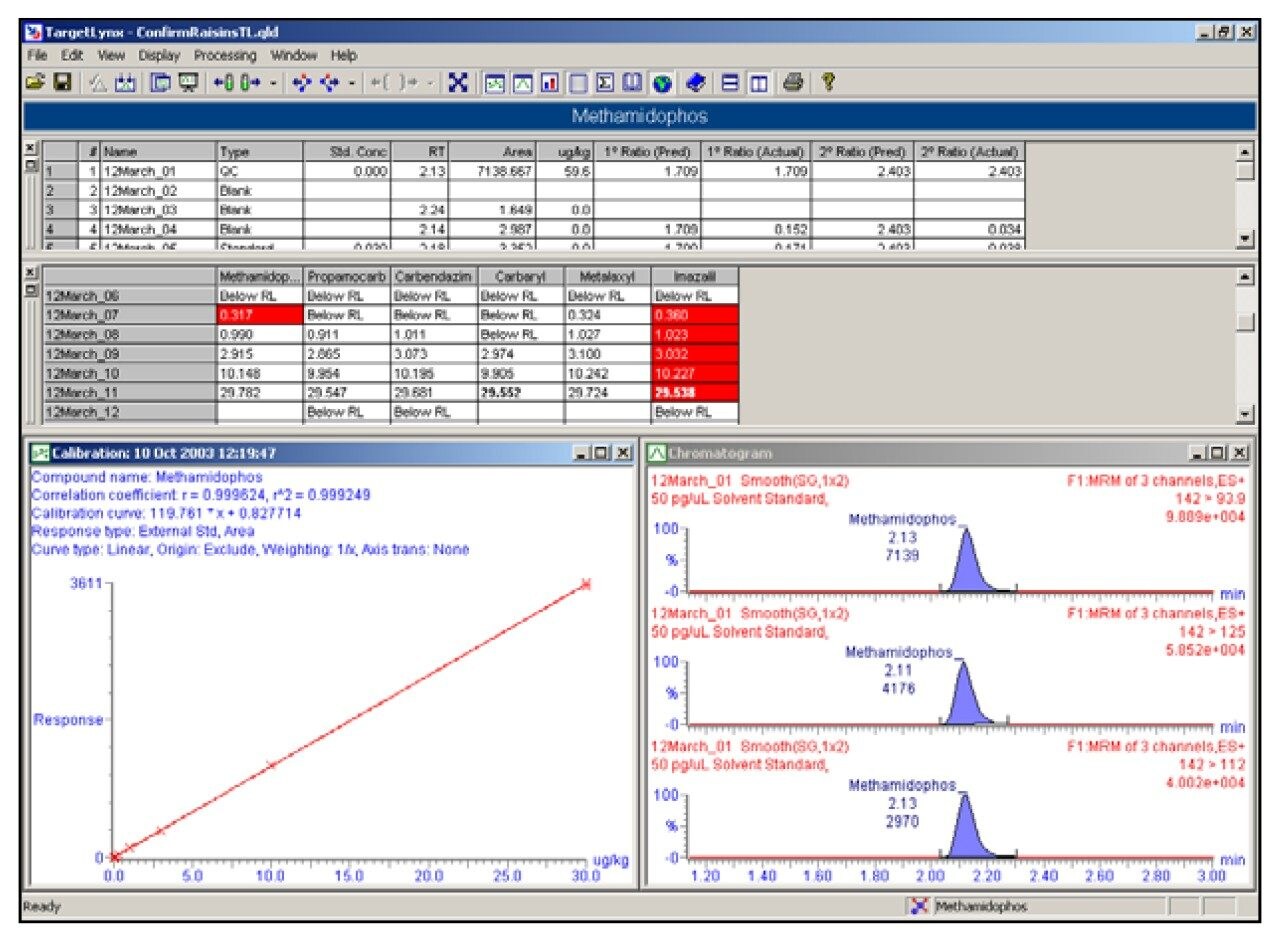
As samples are selected in the summary pane, related data displays in the chromatogram pane. The chromatogram and calibration panes are interactive, allowing users to manually optimize peak integration and exclude inappropriate calibration points.

To speed up the peak integration review, an automated slideshow presents each sample in sample list order. The show may be paused as necessary to allow manual integration and recalculation of results.

The Summary Table presents information from the acquisition Sample List plus the related quantification results. The display can be filtered by sample, or by compound. Data reported includes:

  • Calculated concentration (in user defined units)
  • Peak area/height
  • Response
  • Internal standard area
  • Retention time
  • Quality flags (e.g., concentration out of tolerance)
  • % Deviation

Additional results fields may be added to the table.

The TargetLynx Overview pane flags samples where:

  • Analytes are above a specified concentration (Maximum Reporting Level)
  • Analyte confirmatory ion ratios are outside specified limits
  • Signal-to-noise ratios are below a defined value
  • Analyte retention time or relative retention time is outside limits
  • The coefficient of determination (r2) of the calibration curve exceeds a defined value
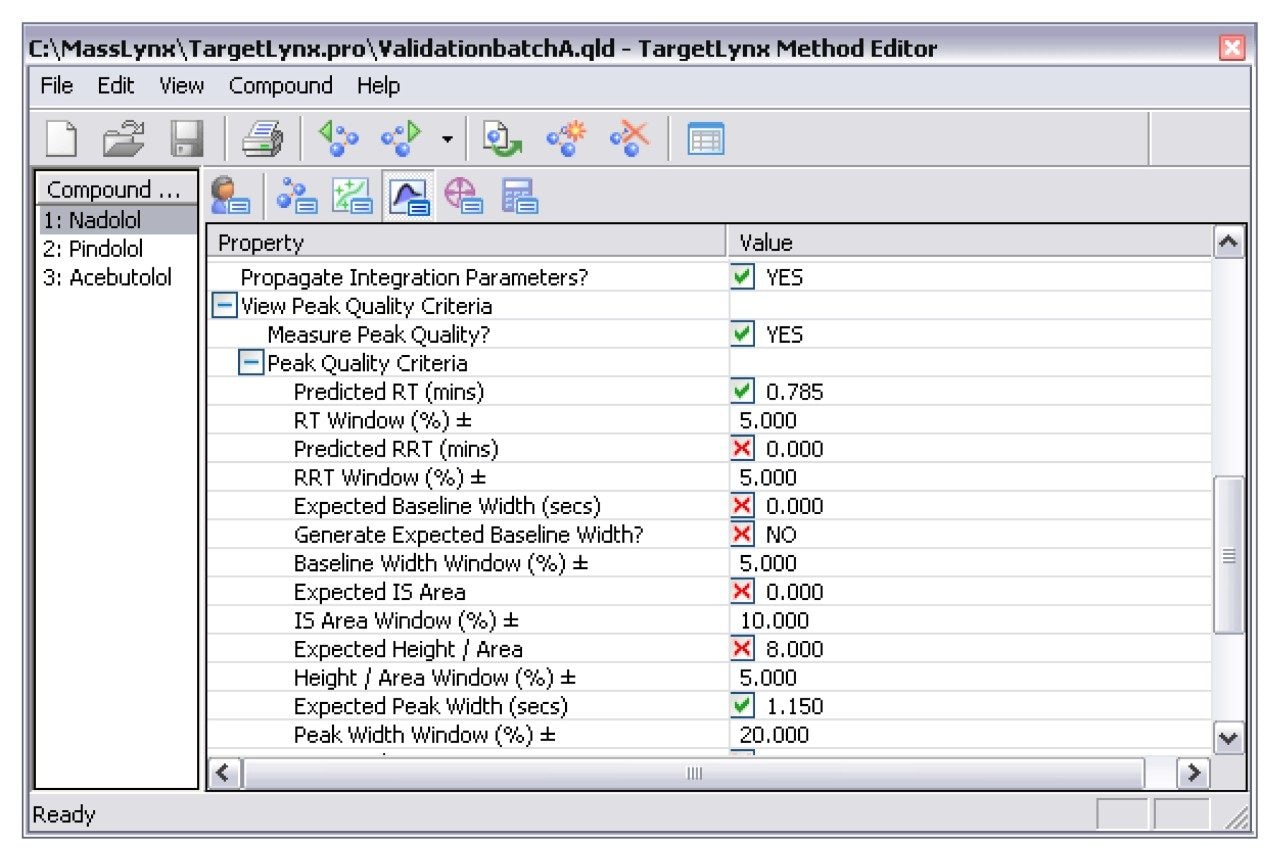
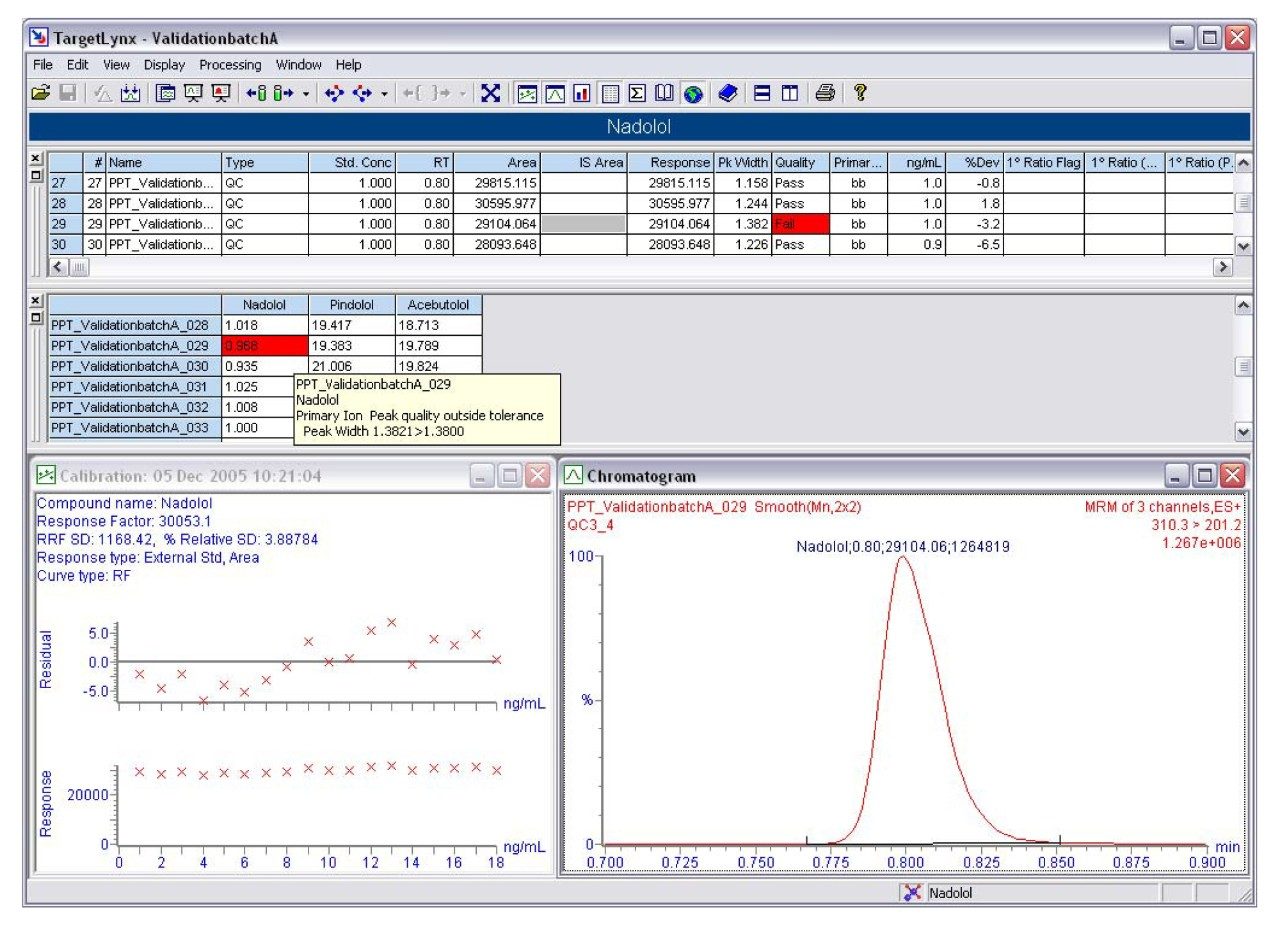
  • Peak Quality criteria are outside predefined limits, indicating a failure in the chromatography

Placing the cursor over a sample field displays the reason the sample was flagged.

Shown below are the editor for Peak Quality (Figure 5) and a TargetLynx Browser showing the results of failed peak quality criteria (Figure 6).

Figure 5. TargetLynx Editor - Peak Quality Parameters.
Figure 6. TargetLynx Browser - Peak Quality Flags.

Data Integrity

Regulations applicable to many quantitative assays require data integrity, including documented evidence of changes to results. The TargetLynx Browser documents the creation of a results file and all changes to the file in a secure audit trail. The audit trail includes the who, what, when, and why of changes. Changes are permitted based on permissions defined in the MassLynx Security Manager, supporting GxP and other regulatory requirements. Electronic signature capability is available whenever necessary. It is implemented according to local standard operating procedures.

Reporting

TargetLynx results are stored in a secure, independent results file. Configurable printed report formats permit output to paper. Configurable reports (Figure 7), either per sample or per compound, include:

  • Calibration
  • Compound Summary
  • Sample Summary
  • Totals
  • Samples
  • Audit Report
Figure 7. TargetLynx Report – Flagged Recovery, Target Ions not found.

Electronic export files in a variety of formats (*.txt, *.CSV, *.XML, etc.). enable transfer to other software applications. Direct export to LIMS is also available for immediate results transfer and distribution.

Productivity Through Targetlynx

QuanOptimize

Coupling TargetLynx and QuanOptimize permits fully automated method development of complete quantitative assays for LC-MS or LC-MS/MS methods. QuanOptimize automatically optimizes instrument parameters for every individual compound required in a sample set by injecting a series of standards. The resulting method files may be used to acquire and quantify a data set. The result is an automated workflow from sample submission, to method development, data acquisition and data processing. The final output is the TargetLynx results file.

Open Access Quantification

For non-expert users that require access to quantitative analysis, TargetLynx can be coupled with OpenLynx Open Access Login to create a ‘walk-up’ system. Employing pre-defined LC-MS/MS methods for known compounds the system allows users to submit samples via a login PC, without interacting with MassLynx. The result is a simple interface that allows chemists to submit a sample and later receive the results as the TargetLynx Browser report via email, or as a printed report.

Conclusion

TargetLynx automates data acquisition, processing and reporting. TargetLynx incorporates a wide range of confirmatory checks, easily identifying samples that fall outside user-specified or regulatory thresholds, and provides high confidence in quantitative results.

Manual calculation and checking results is a labor-intensive, time-consuming and costly task. TargetLynx eliminates all manual checking and provides an easy to use and flexible solution to increase laboratory productivity.

Featured Products

720001733, April 2006

返回顶部 返回顶部