• 应用纪要

The Analysis of Multimeric Monoclonal Antibody Aggregates by Size-Exclusion UPLC

The Analysis of Multimeric Monoclonal Antibody Aggregates by Size-Exclusion UPLC

  • Stephan M. Koza
  • Matthew A. Lauber
  • Kenneth J. Fountain
  • Waters Corporation

Abstract

The application note demonstrate the advantages of a UPLC-based, size-exclusion separation compared to an HPLC-based, size-exclusion analysis for the separation of macromolecular protein complexes. In addition, data are presented showing the benefits of combined ACQUITY UPLC BEH SEC columns of 200Å and 450Å pores for the analysis of an mAb sample that contains high valency multimeric mAb aggregates.

Benefits

  • ACQUITY UPLC SEC Technology delivers increased high molecular weight protein (up to 1.8 MDa) component resolution compared to traditional, HPLC-based SEC separations.
  • Size separation range increased with the BEH450 SE-UPLC Column used in series with the BEH200 SE-UPLC Column for the analysis of dimer through multivalent mAb aggregates by SE-UPLC.

Introduction

Monoclonal antibodies (mAb) have become one of the predominant protein classes in the biotherapeutic landscape. Both the level and valency of soluble protein aggregation are critical quality attributes (CQA) that require monitoring for mAb preparations intended for human use. Protein aggregation, which may occur throughout the manufacturing process from cell culture through drug product shelf-life, may be indicative of partial denaturation or other perturbations of protein structure which can deleteriously effect the safety and efficacy of the protein biotherapeutic.1 While it is important to quantitatively assess low valency (e.g. dimer) aggregate levels as a measure of process and product stability, as well as product safety, it is also critical to elucidate the distribution of high valency multimeric soluble aggregate forms in protein biotherapeutic preparations. These multimeric aggregate forms may be more effective in eliciting an immune response, due to their ability to trigger an immunological pathway independent of T-cell involvement.2

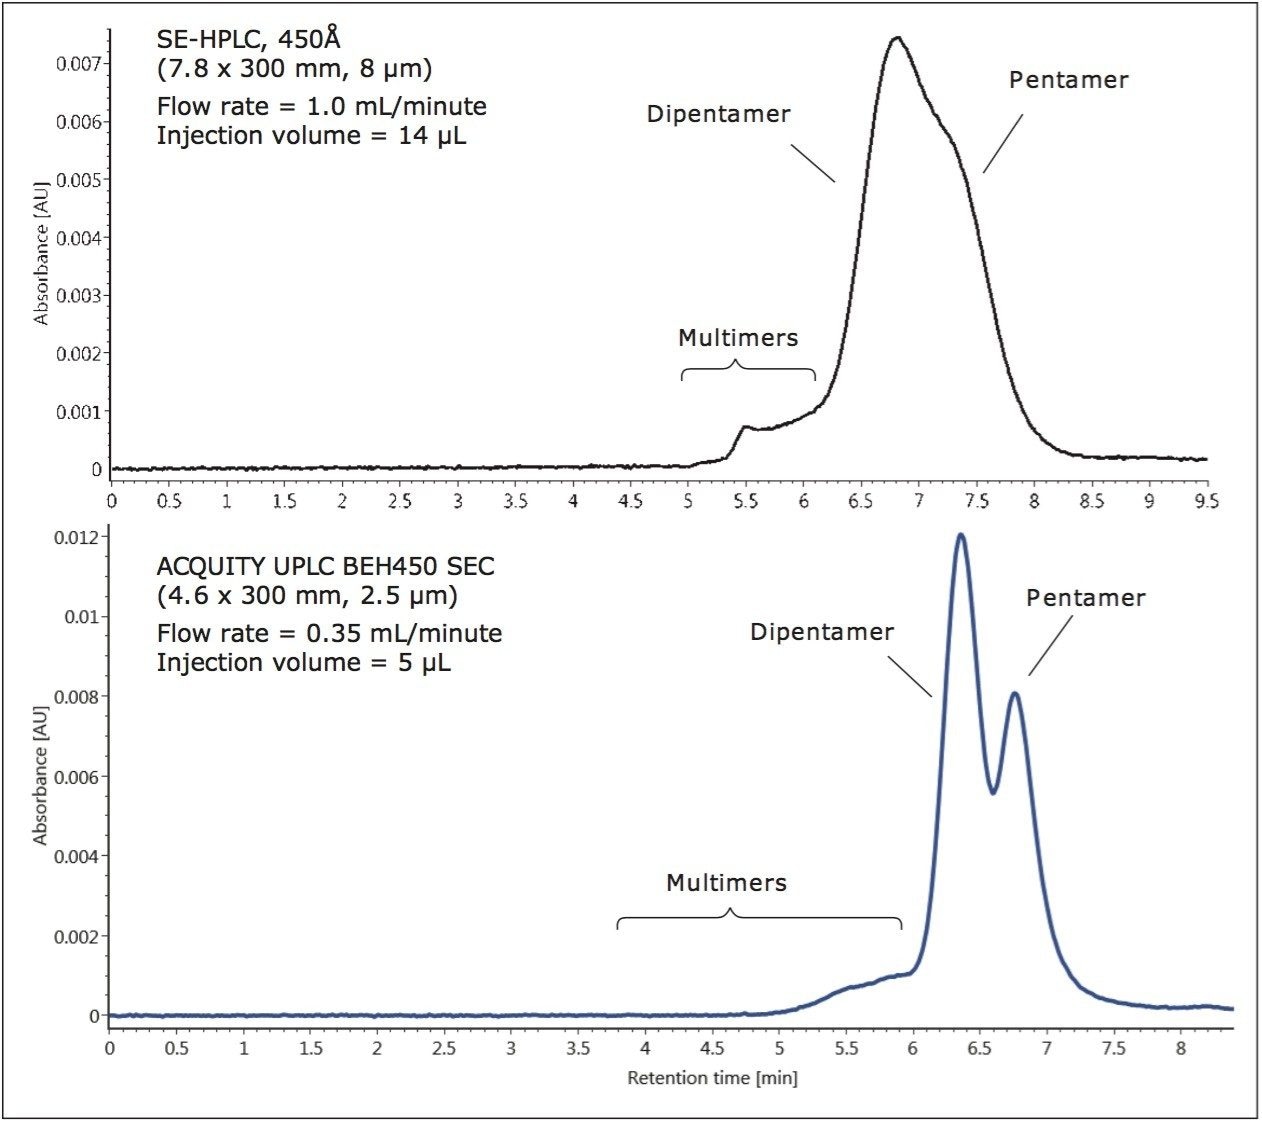
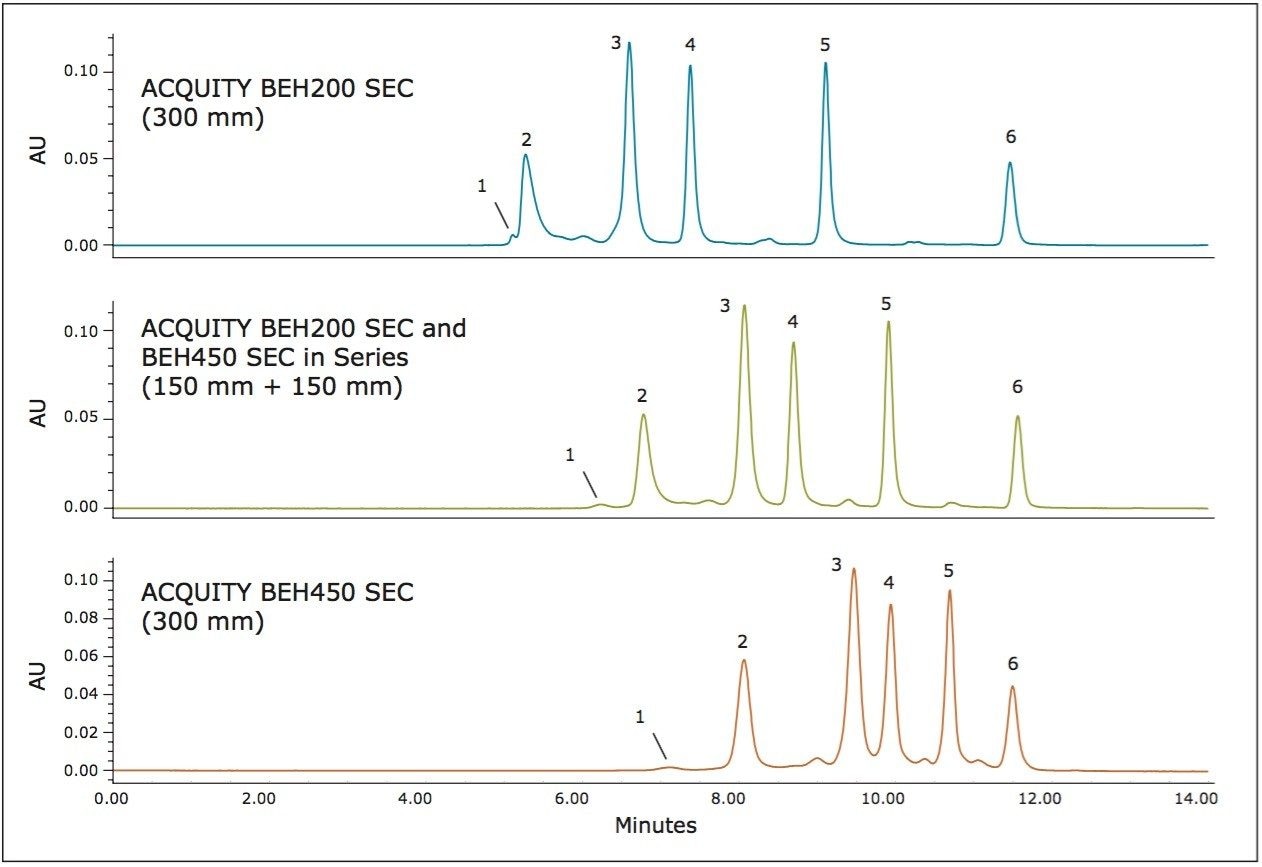
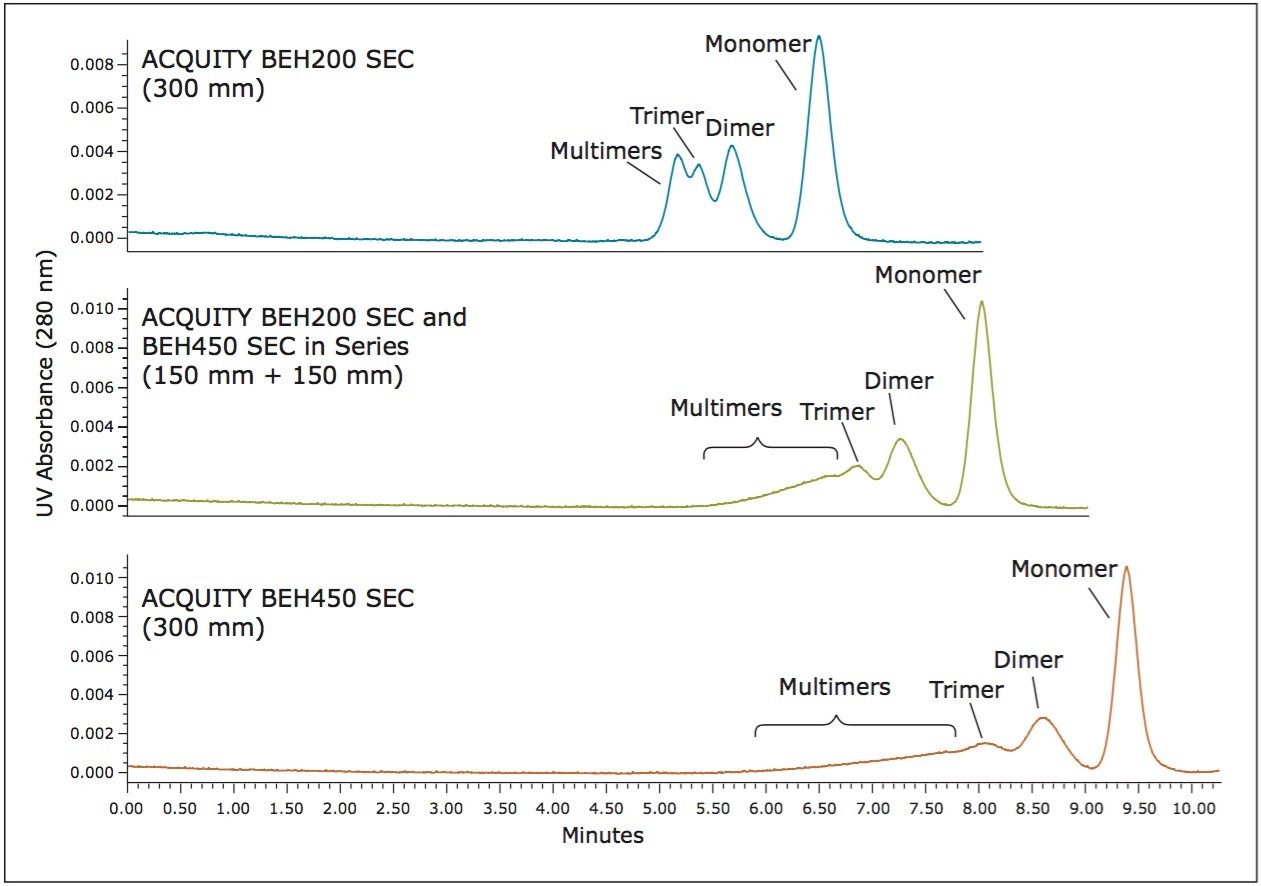
The recently introduced BEH 450Å pore size, sub-3-μm packing material has been designed to expand the molecular weight range of size-exclusion UPLC (SE-UPLC) separations to include biological macromolecules with large radii of hydration (Rh ), such as IgM and multimeric self-associated proteins3. In this study, a 450Å pore sub-3-μm packing material (BEH450) was evaluated for the analysis of an mAb. The data demonstrate the advantages of a UPLC-based, size-exclusion separation compared to an HPLC-based, size-exclusion analysis for the separation of macromolecular protein complexes. In addition, data are presented showing the benefits of combined ACQUITY UPLC BEH SEC columns of 200Å and 450Å pores for the analysis of an mAb sample that contains high valency multimeric mAb aggregates.

Experimental

Sample description

All samples were diluted in mobile phase unless otherwise noted. Proteins were purchased as individual standards or as mixtures. The IgG1 mAb sample was biotherapeutic trastuzumab that was analyzed past expiry. Sample concentrations were 1.0 mg/mL (nominal) unless otherwise noted.

Method conditions (unless otherwise noted)

LC conditions

System:

ACQUITY UPLC H-Class Bio with 30-cm Column Heater

Detection:

Waters ACQUITY UPLC TUV Detector with 5-mm Titanium flow cell Wyatt miniDAWN TREOS light scattering detector

Wavelength:

280 or 214 nm

Columns:

ACQUITY UPLC PrST SEC, 450Å, 2.5 μm, 4.6 x 150 mm (p/n 176002996) and 4.6 x 300 mm (p/n 176002997) ACQUITY UPLC PrST SEC, 200Å, 1.7 μm, 4.6 x 150 mm (p/n 186005225) and 4.6 x 300 mm (p/n 186005226)

HPLC column:

Silica-based, diol bonded 450Å, 8 μm, 7.8 x 300 mm

Column temp.:

Ambient

Sample temp.:

10 °C

Injection volume:

5 μL

Flow rate:

0.35 mL/min

Mobile phases:

5 mM sodium phosphate, 250 mM sodium chloride, pH 6.8 (prepared using Auto•Blend Plus Technology)

Gradient:

Isocratic

Standard:

BEH450 SEC Protein Standard Mix (p/n 186006842)

Sample vials:

Deactivated Clear Glass 12 x 32 mm Screw Neck Total Recovery Vial, with Cap and Preslit PTFE/Silicone Septa, 1 mL (p/n 186000385DV)

Data management

Waters Empower 3 Software
Waters UNIFI Information System
Wyatt Astra Software

Cross-linking experimental detail

Covalent high molecular weight IgG aggregates were prepared using the Waters Intact mAb Standard (p/n 186006552), and the lysine-specific cross-linking agent, BS3 (Pierce, Rockford, IL). Reactions were performed with the antibody at a final concentration of 10 mg/mL and reagent-to-protein molar ratio of approximately 5:1 for 30 minutes.

Results and Discussion

Comparison of SE-UPLC and SE-HPLC of IgM and IgM dimer

The BEH450 UPLC Column was compared to a silica-based 8-μm particle size HPLC column for the separation of IgM, a pentameric immunoglobulin with a molecular weight of 900 KDa, and the di-pentamer form of IgM with a molecular weight of 1.8 MDa (Figure 1). The sample loads and flow rates were adjusted for the column geometries used, and both analyses were performed on the same ACQUITY UPLC H-Class Bio System. The BEH450 column produced significantly better separation between the di-pentamer and pentamer forms, and improved sensitivity with peak height greater than 50% compared to the HPLC column. This remarkable improvement in separation efficiency is principally due to decreased particle size. Additionally, it can be observed that the molecular weight range of the BEH450 column extends above that of di-pentamer based on the observation of multimeric dimer forms eluting earliest in the chromatogram.

Figure 1. Comparison of an HPLC silica-based, 8-μm particle-size, 450Å SEC column (300-mm length) to an ACQUITY UPLC BEH450 SEC Column (300-mm length) for the separation of IgM pentamer (900 Kda) and IgM dipentamer (1.8 MDa). Sample injection volumes and flow rates were normalized for column geometry. The identities of the peaks were confirmed by SEC-MALS analysis.

Expanding the molecular weight range of mAb aggregation analysis

The outstanding efficiency provided by the BEH450 column for the separation of proteins above the upper molecular weight range of the BEH200 (approximately 450 KDa) suggests that using the two columns in series can provide some advantages for SE-UPLC separations over a broad molecular weight range. A  comparison of the separation achieved on the BEH200 and BEH450 columns alone (each 300 mm in length) and the 150-mm length version of both columns connected in series (BEH200 followed by BEH450) for the Waters BEH200 SEC Protein Standard Mix (p/n 186006518) is shown in Figure 2. As the back pressure generated by the 1.7-μm particle size BEH200 column is greater than that of the 2.6-μm particle size BEH450 column, the BEH200 column was placed first in the series for this study. The result of this two-column configuration is shown in the center panel of Figure 2. By using both columns in series, the functional upper molecular weight range of the separation is increased as noted by the improved separation of thyroglobulin and its dimer compared to the separation using the 200Å column alone. Additionally, for the lower molecular weight forms, there is an improvement in resolution compared to the use of the 450Å column alone, as  proven by the improved separation between IgG and BSA.

Figure 2. Comparison of the ACQUITY UPLC BEH450 SEC Column to the ACQUITY UPLC BEH200 SEC Column (300-mm lengths). The center panel was generated using both a BEH200 and BEH450 column in series. Columns were connected using Waters part number 186006613. Compounds included the following: 1. Thyroglobulin dimer (1340 KDa), 2. Thyroglobulin (667 KDa), 3. IgG (150 KDa), 4. BSA (66 KDa), 5. Myoglobin (17 KDa), and 6. Uracil (112 Da).

The use of two SEC columns of different pore size can provide separations over a broader molecular weight range. One example of such a separation is the multivalent aggregate, trimer, dimer, and monomeric forms of an mAb. To demonstrate this, a sample of IgG (p/n 186006552) was then cross-linked to generate covalent dimeric and multimeric forms in order to generate a stable sample with an abundant level of mAb multimeric species. This sample was then used to define the molecular weight range of aggregated mAb species that can be separated by the BEH200 and BEH450 columns. The cross linking chemistry produced high levels of multimeric species that were easily characterized by multi-angle laser light scattering (MALS) measurements; however, the polydispersity of the peaks increased due to the nature of the cross-linker reaction, also resulting in non-crossed linked additions of the reagent to the proteins. These chromatograms, shown in Figure 3, along with the peak assignments based on the MALS data, demonstrate the advantages of using the BEH200 and BEH450 columns in series. For the separation using only the BEH200 column, excellent resolution is obtained between the monomer and dimer forms. However, when compared to the separation observed on the BEH450 column, the distribution of aggregate forms larger than trimer elute near the total exclusion volume of the BEH200 column. By using the two columns in series (middle chromatogram in  Figure 3), the distribution of higher aggregate forms can be observed while better resolution between the monomer and dimer is achieved compared to using the BEH450 column alone.

Figure 3. Comparison of the ACQUITY UPLC BEH450 SEC Column to the ACQUITY UPLC BEH200 SEC Column (300-mm lengths), and both a BEH200 and BEH450 column (150-mm lengths) in series for the separation of covalently cross-linked antibody sample. Columns were connected using Waters part number 186006613. The identities of the peaks were confirmed by SEC-MALS analysis.

Application of the BEH200 and BEH450 columns in series for the SE-UPLC analysis of a biotherapeutic IgG1 mAb (trastuzumab) was then investigated. In order to generate a more relevant sample for this study, the trastuzumab sample was subjected to a series of freeze-thaw events to increase the levels of non-covalent aggregates in the sample. The aggregate levels were then evaluated using the BEH200 column (300-mm length) or the BEH200 and BEH450 columns in series (each 150-mm length). These results (Figure 4) show that the use of the two columns in series provides a separation in which the distribution of multimeric aggregate forms can be observed along with an improved separation between the dimeric and trimeric aggregate species when compared to the BEH200 column alone. Conversely, use of the BEH200 column alone provides a better separation of the mAb fragments that result from cleavage in the hinge region of the mAb.4

Figure 4. Comparison of a 300-mm length BEH200 column (A) versus a BEH200 and a BEH450 column (150-mm each) in series (B) for the separation of trastuzumab (IgG1) aggregation generated by increasing freeze-thaw cycles (0, 5, 10, and 15). Low-level peak identities are predicted based on elution position and previous monoclonal antibody assignments from Figure 3.

By evaluating the change in this profile over the course of the freeze-thaw study, it can be visually observed for both column configurations that the overall level of soluble trimer and multimeric aggregate is increasing. Both column configurations also provided comparable results for the determination of the relative levels of dimer, as well as the pooled trimer and multimer aggregate (Figure 5). This quantitative comparison required pooling the trimer and multimeric peak areas, as the resolution between the trimer and larger multimeric forms using the BEH200 column alone did not allow for accurate integration. However, the use of the BEH200 and BEH450 columns in series provides a significant benefit for this application in that the trimer and tetramer forms are more resolved compared to use of the BEH200 column alone. Additionally, the distribution of aggregate forms greater in valency than trimer and tetramer can be monitored better. These results are consistent with those presented previously (Figure 2), which demonstrate that  the upper molecular weight range for the BEH200 column for a globular protein is approximately that of thyroglobulin (667 KDa), nearly the molecular weight of IgG tetramer (600 KDa). By comparison, the upper molecular weight range for the BEH450 column is approximately that of IgM dipentamer (1.8 MDa) which is the molecular weight of an IgG 12-mer. This additional information provided by the larger pore-size BEH450 column may be beneficial in characterizing a biotherapeutic protein, since in addition to the level of protein aggregation, the valency of that aggregation may potentially alter immunogenicity.

Figure 5. Comparison of relative peak areas observed in trastuzumab (IgG1) as a result of aggregation generated by freeze-thaw cycles (0, 5, 10, and 15). Integrated results were determined from chromatograms presented in Figure 4.

Conclusion

Both the levels and the nature of soluble aggregates are important CQA for biotherapeutic protein preparations. The introduction of the BEH450 SEC column provides an extended upper molecular weight range for SE-UPLC analyses, and significantly improves resolution compared to a 450Å pore-size HPLC-based size-exclusion column. The use of the BEH450 SE-UPLC Column in series with the 200Å pore-size BEH200 column provides an expanded molecular weight range that can be used for the analysis of both dimeric and multimeric aggregates of an mAb, while taking advantage of the sensitivity, resolution, and throughput of SE-UPLC.

The ACQUITY UPLC BEH450, 2.5 μm SEC Column in combination with the ACQUITY UPLC BEH200, 1.7 μm SEC Column, and the ACQUITY UPLC H Class Bio System provide the following benefits:

  • Greater resolution and sample throughput compared to traditional SE-HPLC packing materials
  • An extended useful SE-UPLC molecular weight range (approximately 10 KDa to 1800 KDa)
  • Ability to observe the distribution of multivalent mAb aggregate forms while maintaining excellent resolution between the dimeric aggregate and monomeric mAb species

References

  1. Cromwell ME, Hilario E, Jacobson F. Protein aggregation and bioprocessing. AAPS J. 2006; 8:E572-9.
  2. Rosenberg AS. Effects of protein aggregates: an immunologic perspective. The AAPS Journal. 2006; 8:501-7.
  3. Koza S, Fountain KJ. Advances in Size Exclusion Chromatography for the Analysis of Macromolecular Proteins. Waters Application Note 720004618EN. 2013 February.
  4. Hong P, Koza S, Fountain KJ. Analysis of Proteins by Size-Exclusion Chromatography Coupled with Mass Spectrometry Under Non-Denaturing Conditions. Waters Application Note 720004254EN. 2012 March.

720004713, May 2013

返回顶部 返回顶部