• 应用纪要

Absolute Quantification of Yeast Kinases by LC-MS/MS using QconCAT and MRM Technologies

Absolute Quantification of Yeast Kinases by LC-MS/MS using QconCAT and MRM Technologies

  • Philip J Brownridge
  • Victoria Harman
  • Simon Cubbon
  • Johannes P.C. Vissers
  • Craig Lawless
  • Simon J Hubbard
  • Robert J. Beynon
  • Protein Function Group, Institute of Integrative Biology, University of Liverpool
  • Waters Corporation
  • Faculty of Life Sciences, University of Manchester

For research use only. Not for use in diagnostic procedures.

Abstract

This application note presents the application of label-mediated targeted mass spectrometry to quantify a range of kinases from yeast, spanning a five-order dynamic range.

Benefits

Nanoscale separations are combined with quantitative MRM mass spectrometry to accurately determine absolute yeast protein amounts over a wide dynamic range using isotopically labelled standards. More peptides and proteins are more easily quantified and data analysis is more straightforward using elevated analyzer resolution settings and a high sensitivity triple quadrupole mass spectrometer.

Introduction

Absolute protein quantification by LC-MS/MS is an important tool in assay development and creating data for systems modeling. Enabling predictive biology is one of the primary goals of many system biology studies, achieving detailed knowledge of the cellular constituents, their quantities, dynamics, and interactions. This information can be subsequently embedded in mathematical models that permit simulation of cellular state changes, testable by experiment, and leading to biological process definitions.1 However, this requires accurate baseline values for the cellular quantities of proteins. The large dynamic range of a proteome is the most challenging barrier to LC-MS/MS-based protein quantification.

This application note presents the application of label-mediated targeted mass spectrometry to quantify a range of kinases from yeast, spanning a five-order dynamic range. QconCAT2 technology was used to create isotopically-labeled internal standard peptides for 138 target proteins and quantification was performed by time-scheduled MRM tandem quadrupole mass spectrometry, investigating the sensitivity of different platforms, assay specificity, and quantitation dynamic range.

Experimental

Sample preparation

Several yeast kinase QconCATs were designed to contain two isotopically labelled peptides for each of the targeted proteins and tryptically codigested with a native yeast strain as shown in Figures 1 and 2, respectively. Figure 1 illustrates the QconCAT principle whereby a synthetic gene is designed to encode proteotypic peptides of the sample protein mixture. Summarized in Figure 2 are the design of a quantitation concatamer and the high-throughput MRM quantitation workflow. Yeast kinases, as shown in Figure 3, span the complete yeast abundance distribution range in terms of number of copies/cell.

Figure 1. The principle of QconCAT technology.
Figure 2. Design of a quantitation concatamer (QconCAT) and high-throughput MRM quantitation workflow.
Figure 3. Yeast kinases span the complete abundance distribution range.

LC-MS/MS conditions

Time-scheduled MRM experiments were conducted with a nanoACQUITY UPLC System interfaced to either a Xevo TQ or a Xevo TQ-S3 tandem quadrupole mass spectrometer.

A 60-min reversed phase gradient from 3 to 40% acetonitrile (0.1% formic acid) was employed using a vented trap-configuration comprising a 5-μm Symmetry C18 2 cm x 180 μm trap column and a 1.7-μm ACQUITY UPLC HSS T3 C18 15 cm x 75 μm analytical column. Quadrupole resolution settings of 0.7 Da and 0.4 Da FWHM were employed, balancing the sensitivity of the two mass spectrometers, respectively. Elevated resolution settings for Xevo TQ-S were considered to investigate MRM assay specificity.

Informatics

The quantitative LC-MS peptide data were processed and quantified with the TargetLynx Application Manager for MassLynx Software version 4.1, Skyline4 version 1.44 (MacCoss Lab, University of Washington, Seattle, Washington, U.S.), and/or mProphet (Biognosys AG, Schlieren, Switzerland).5

Results and Discussion

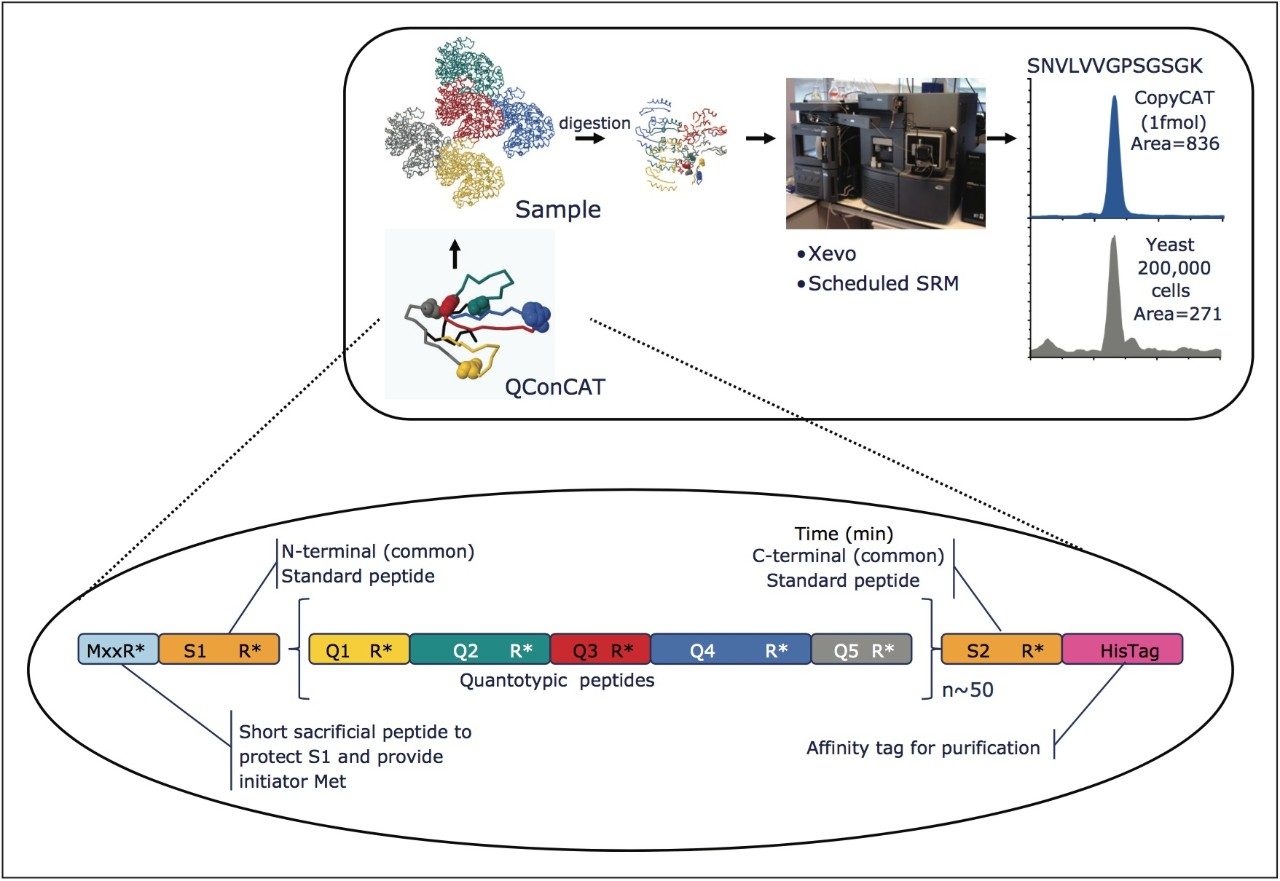
The design and quantification workflow of yeast kinases using QconCAT technology in high-throughput MRM mode is summarized in Figure 2. The top pane illustrates the design of a QconCAT internal standard protein and the bottom pane the workflow. The workflow comprised: i) digestion, ii) digestion performance check, iii) discovery LC-MS plus database searching, iv) creation spectral library, v) preliminary MRM quantitation, vi) transition validation, vii) experiment optimization, viii) serial dilutions, and ix) final quantitation.

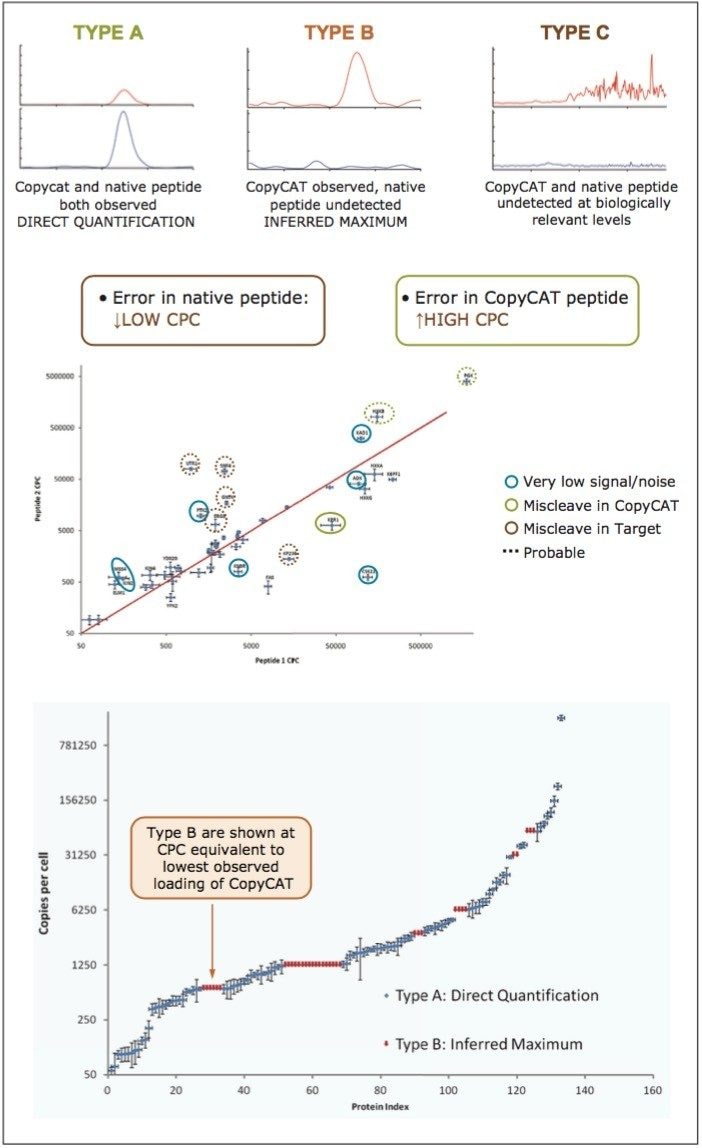
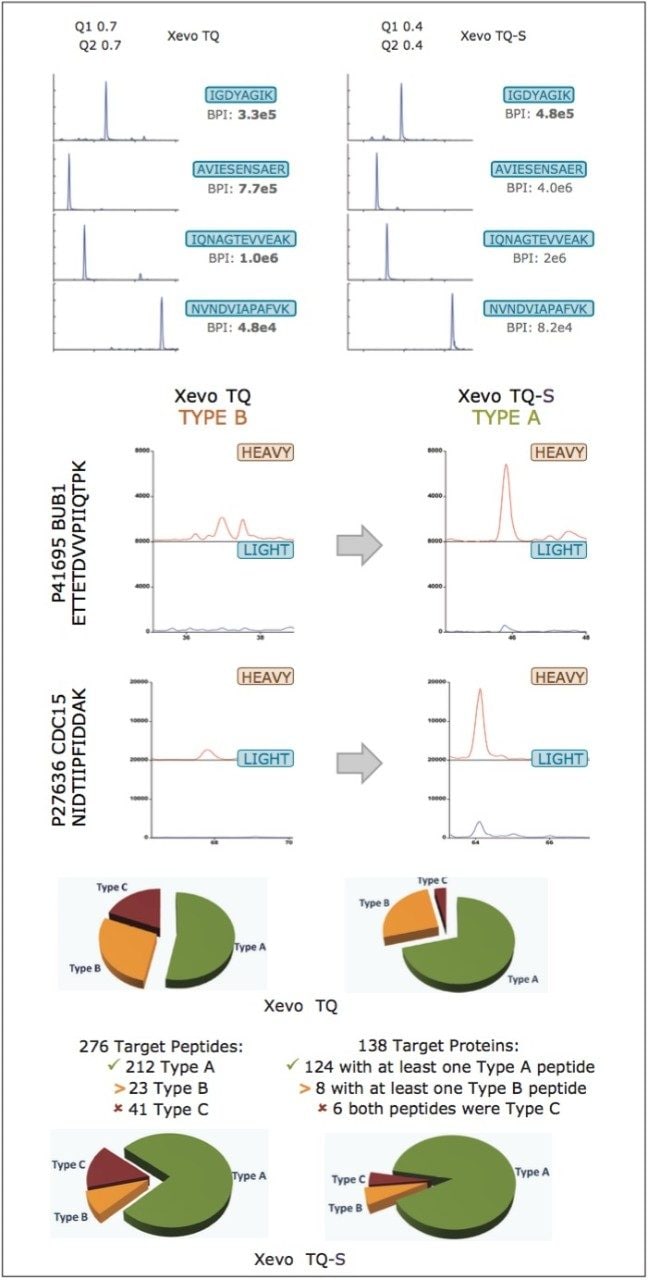
Peptides were qualified as either type A, B, or C, as illustrated in the top panel of Figure 4. A Type A identification infers unambiguous observation of both the QconCAT and native peptide. In the instance of Type B identifications, only the QconCAT peptide is observed and for Type C identifications both the QconCAT and native peptide were both not detected. The correlation between the selected peptides for Xevo TQ quantitation is illustrated in the middle pane of Figure 4. The majority of the peptides show good quantitative agreement; however, due to either low signal or missed tryptic cleavages, certain peptides cannot be used for quantitation, which are highlighted with blue, green, and red circles.

Figure 4. Peptide detection/quantification type (top panel), quantification challenges (middle panel) and quantified proteins with nominal quadrupole resolution settings (Xevo TQ) (bottom panel).

The proteins were indexed based on determined amounts and correlated with the copies per cell number (CPC) values available from pax-db (http://pax-db.org) for type A and type B quantified peptides, shown in the lower pane of Figure 4. Type B quantified peptides are shown at CPC equivalent to the lowest observed loading of the CopyCAT protein. As can be seen, the protein amounts are distributed reasonably well over the expected CPC/abundance values/dynamic range.

Next, MRM assay specificity was investigated by running the same yeast sample on a Xevo TQ-S Mass Spectrometer. The top pane of Figure 5 compares the mass extracted chromatograms for a number of QconCAT peptides, illustrating the same chromatographic behavior/profile for both MS platforms. The middle pane of Figure 5 shows the benefits of improved specificity afforded by running Xevo TQ-S at elevated resolution, while maintaining the same sensitivity provided by Xevo TQ, annotating peptides as type A that were previously qualified as type B using Xevo TQ. The number of quantifiable type A peptides increased from 147 to 212 out of a possible 276 peptides (44% increase) and type A proteins from 98 to 124 out of a possible 138 proteins (26% increase), respectively, illustrated in the bottom pane of Figure 5.

Figure 5. MRM chromatograms of selected peptides contrasting nominal and elevated quadrupole resolution settings acquired with Xevo TQ at and Xevo TQ-S, respectively (top pane), increased confidence in peptide detection with improved MRM acquisition specificity (left middle panel (Q1 and Q2 at 0.7 Da FWHM) vs. right middle panel (Q1 and Q2 at 0.4 Da FWHM)) and contrasting the peptide detection types for the two applied LC-MS platforms (two bottom panes), illustrating a marked increase in Type A detections vs. the results shown in the middle pane of Figure 4.

The MRM transitions were visually inspected with Skyline and statistically validated with mProphet prior to final quantitation of the yeast kinases. The top pane of Figure 6 illustrates a comparison based on the Skyline results of the relative intensities of the transitions of a number of native and QconCAT peptides, showing great similarity between the two peptide types. The bottom pane of Figure 6 illustrates, in general, the increased statistical confidence in the ability to quantify peptides and proteins by using quadrupole resolution settings of 0.4 Da vs. 0.7 Da.

Figure 6. Skyline processed relative intensities evaluation of the three selected transition of QconCAT and native peptides (top) and mProphet probabilistic scoring (bottom) of the Xevo TQ and Xevo TQ-S transitions (blue = pass; grey = fail).

The results in Figure 7 show a comparison between the quantitative data obtained with both LC-MS/MS platforms, i.e. Xevo TQ operated at 0.7 Da resolution vs. Xevo TQ-S operated at 0.4 Da resolution, with molar amounts converted to CPC values for both platforms, illustrating good quantitative agreement. Shown inset is the increased number of quantifiable proteins by MRM using elevated resolution settings in combination with Xevo TQ-S whereby it was feasible to balance specificity due to the increased sensitivity afforded by the StepWave source of the instrument.

Figure 7. Quantitative comparison of the results obtained at nominal (x-axis) vs. elevated (y-axis) quadrupole resolution MRM measurements. The inset demonstrates the number of quantifiable proteins at elevated quadrupole resolution.

The quality of quantification was assessed by contrasting the elevated quadrupole resolution Xevo TQ-S MRM results with the number of protein copies per cell, shown in Figure 8, illustrating reasonable agreement. Moreover, the combination of QconCAT and elevated resolution MRM afforded the detection and quantitation of 20 yeast kinases that have not been previously quantified.

Figure 8. Quantitative comparison elevated quadrupole MRM results vs. number of copies/cell according to Pax-db.

Conclusion

  • A combination of QconCAT and MRM with the Xevo TQ-S can quantify proteins across the dynamic range of yeast
    • Equivalent mammalian range would be to 1000 to 35,000,000 CPC
  • Deciding factor in quantification success is peptide choice
    • Still unpredictable parameters
  • If predicting quantotypic peptides, use multiple peptides to infer protein abundance (at least N=3)
    • Many ways for a peptide to produce incorrect protein quantification
  • Xevo TQ-S shows a significant increase in performance over Xevo TQ
    • More and better quantifications, more straightforward data analysis

References

  1. Brownridge P et al. Global absolute quantification of a proteome: Challenges in the deployment of a QconCAT strategy. Brownridge P et al. Proteomics. 2011 Aug;11(15):2957-70.
  2. Beynon RJ, Doherty MK, Pratt JM, Gaskell SJ. Multiplexed absolute quantification in proteomics using artificial QCAT proteins of concatenated signature peptides. Nat Methods. 2005 Aug;2(8):587-9.
  3. Giles K and Gordon D. A new conjoined RF ion guide for enhanced ion transmission. ASMS 2010 poster (described in Travelling Wave ion mobility, Int J Ion Mobility Spectrom, 2013; 16(1):1-3.
  4. MacLean B et al. Skyline: an open source document editor for creating and analyzing targeted proteomics experiments. Bioinformatics. 2010 Apr 1;26(7):966-8.
  5. Reiter L et al. mProphet: automated data processing and statistical validation for large-scale SRM experiments. Nat Methods. 2011 May;8(5):430-5.

Acknowledgement

This work was supported by BBSRC grants BB/G009112/1 (Liverpool) and BB/G009058/1 (Manchester). The authors are grateful to Dr. Karin Lanthaler for provision of chemostat-grown yeast cell preparations.

720004925, January 2014

返回顶部 返回顶部