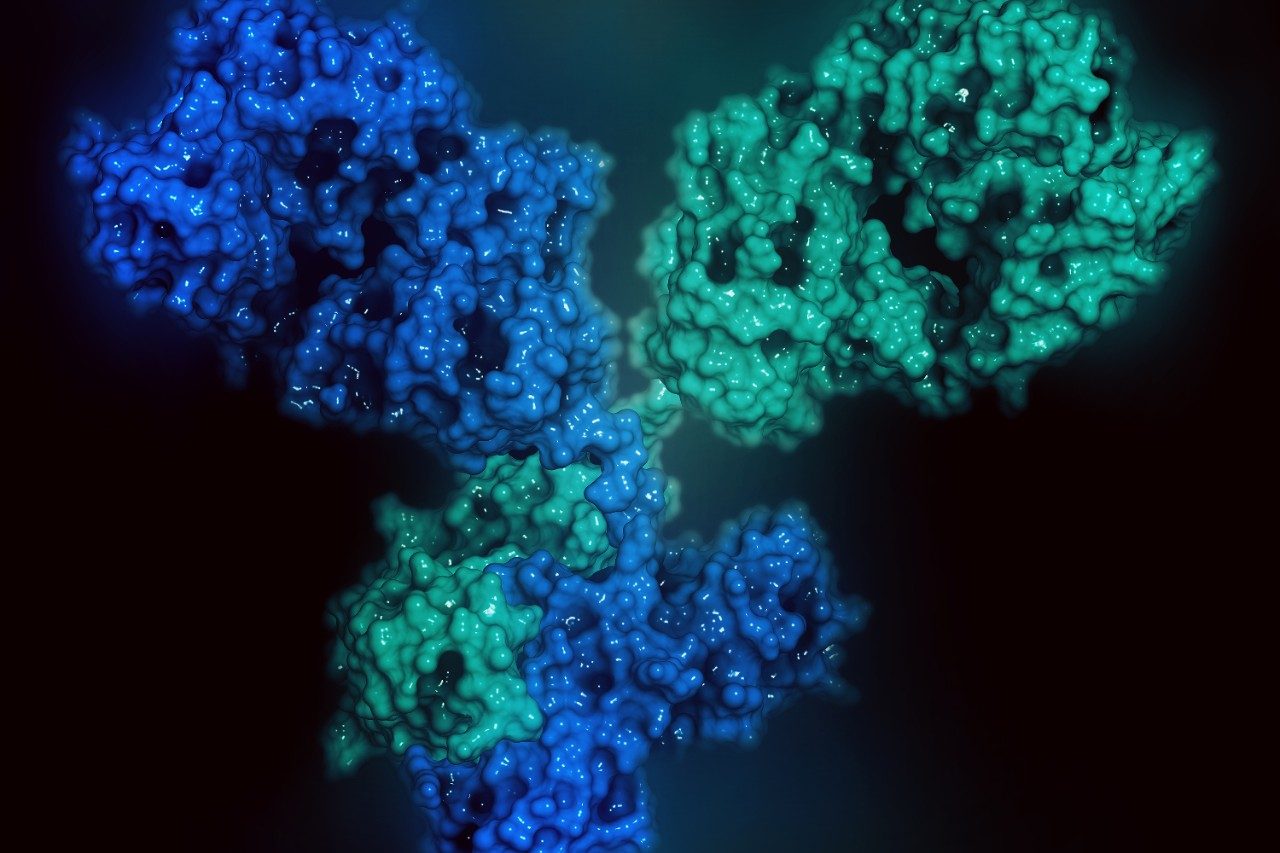
Antibody drug conjugates (ADCs) represent a rapidly growing class of biotherapeutic drugs for the treatment of cancer. ADCs offer the selectivity of an therapeutic antibody with the potency of a cytotoxic agent such as a synthetic drug. ADC design, in part, relies on predictable conjugation chemistry that preserves antibody binding activity while facilitating reproducible characteristics that can be used as metrics for assessing critical quality attributes (CQAs) to ensure a safe and effective ADC product. Interest from pharmaceutical companies to deliver ADC biotherapeutics to market is intensifying.
To support this, characterization methods that are efficient and adaptable to evaluate CQAs associated with this novel class of biotherapeutic drug are needed.
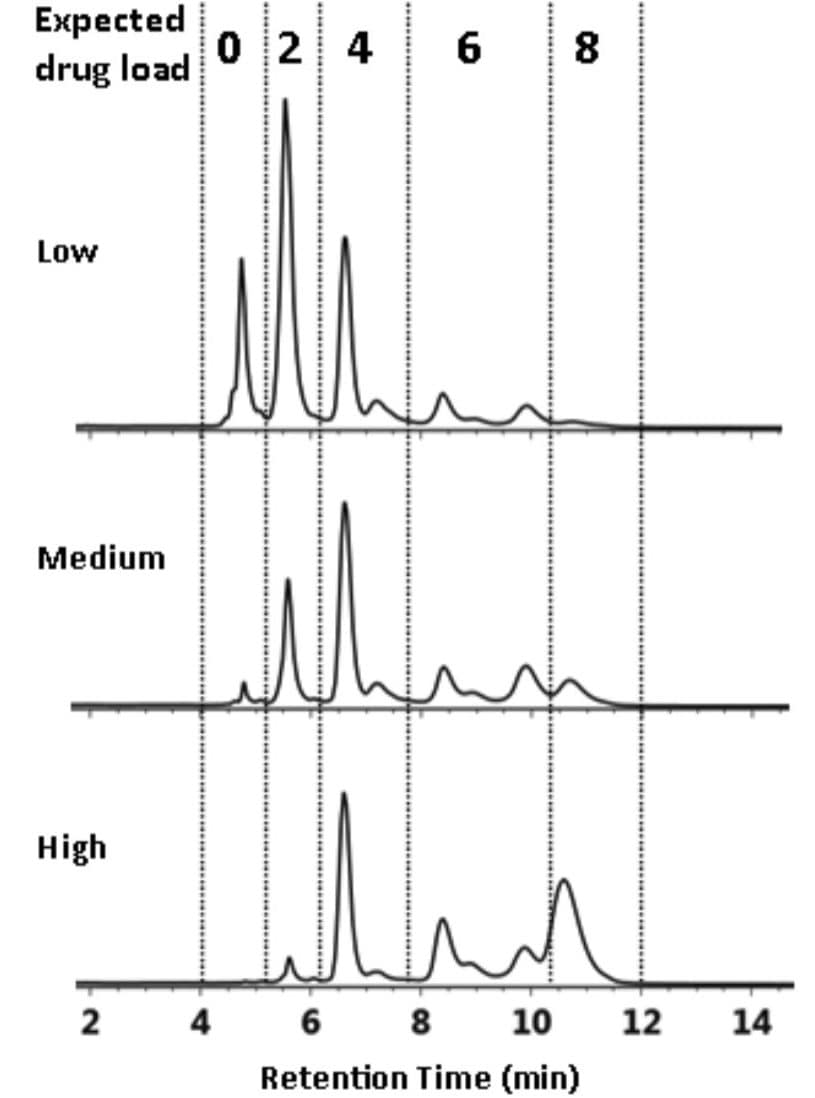
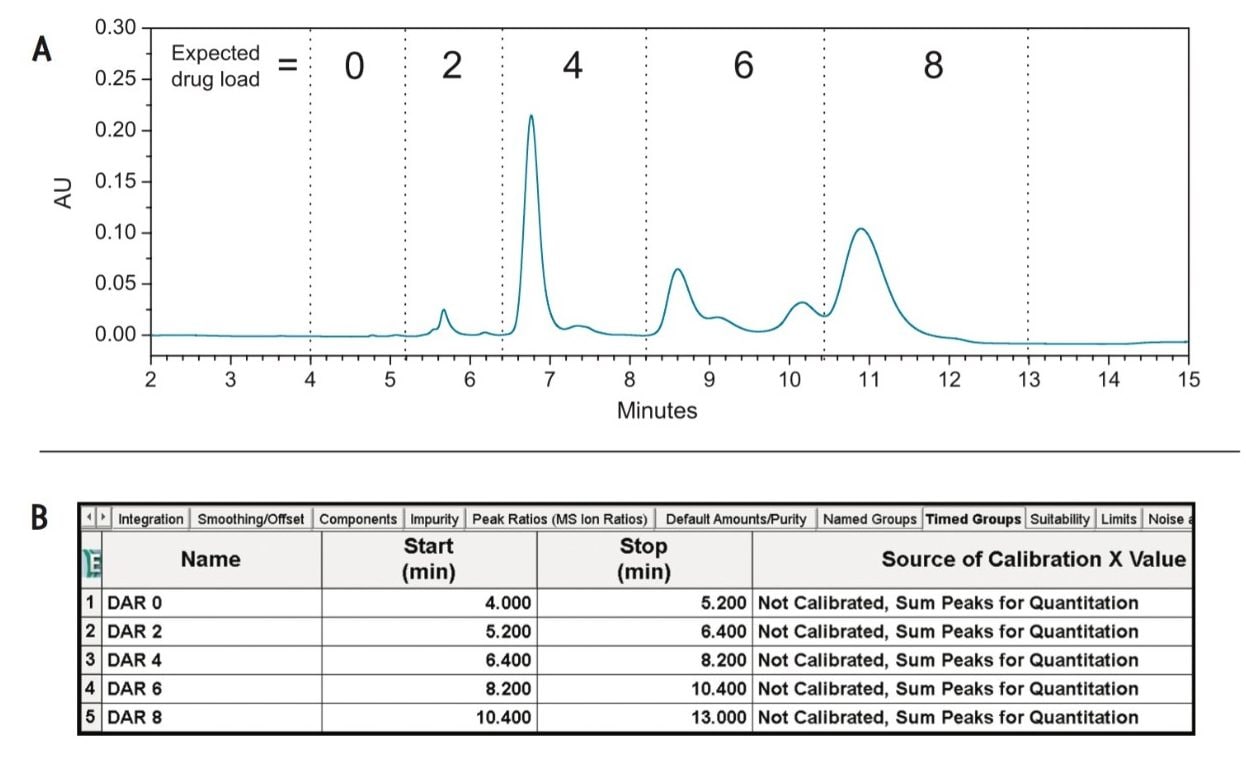
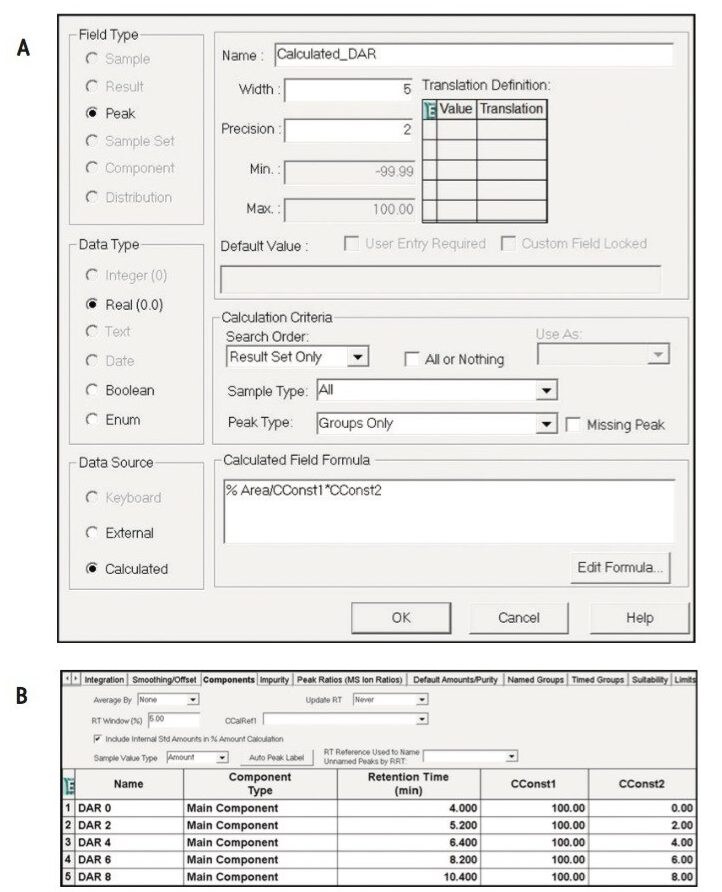
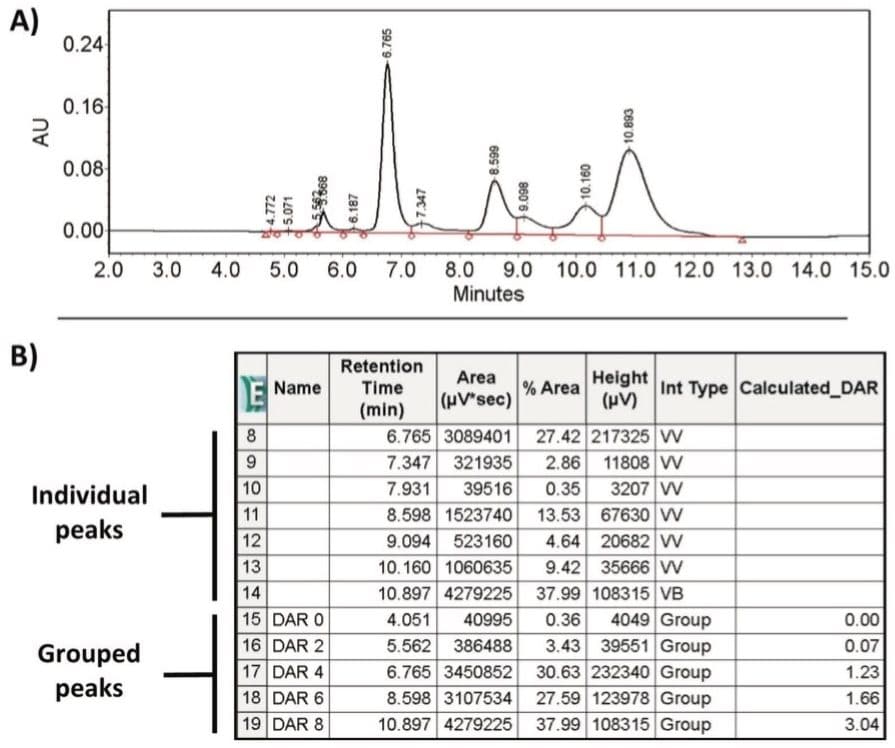
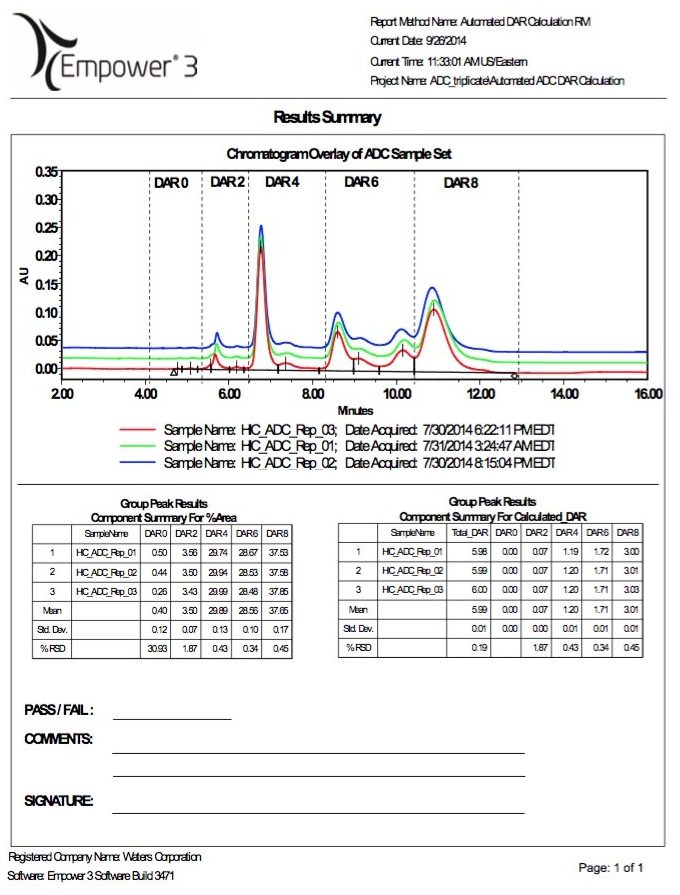
Empower 3 Software represents one of Waters’ solutions to challenges in understanding ADCs. This chromatographic data system can be used to streamline the analytical workflow through an integrated approach to data acquisition, processing, and reporting of experimental results. As one part of its integrated informatics toolset, Empower's custom field calculations are seamlessly incorporated into the ADC data analysis workflow to help analysts readily determine drug-to-antibody ratio (DAR) that corresponds to drug load distribution.
In this application note, learn about Waters' end-to-end and automatable workflow that takes advantage of our integrated UPLC/QTof-MS analytical technologies. We demonstrate that, by using our efficient method deployment approach, this workflow can help you maintain high productivity in ADC characterization.
Learn more about Waters' solutions for ADC characterization.