• 应用纪要

Advantages of Ion Mobility for MALDI Imaging of N-glycans from Tumor Bearing FFPE Tissue in Clinical Research

Advantages of Ion Mobility for MALDI Imaging of N-glycans from Tumor Bearing FFPE Tissue in Clinical Research

  • Emmanuelle Claude
  • Peggi M. Angel
  • Richard R. Drake
  • Waters Corporation
  • Department of Cell and Molecular Pharmacology and Experimental Therapeutics and MUSC Proteomics Center, Medical University of South Carolina

For research use only. Not for use in diagnostic procedures.

This is an Application Brief and does not contain a detailed Experimental section.

Abstract

This application brief describes the separation of N-glycans isobaric species by ion mobility directly ionized from a Formalin-Fixed Paraffin- Embedded (FFPE) tissue section showing different localizations within the tumor and non-tumor tissue types for clinical research.

Benefits

Visualize isobaric N-glycans in FFPE tissue samples to highlight potential differences in isomer abundance.

Introduction

Research studies have reported extensive alterations in protein glycosylation patterns in cancer tissues including colon cancer, the third most common cancer in the United States.1 However, during these studies, tissues are homogenized prior to the release of the glycans by digestion before LC-ESI analysis. Consequently, any information regarding the localization of the glycans, which may have biological significance, is lost.

Mass spectrometry imaging (MSI) is an established analytical tool for biomolecular research which can accurately determine the spatial location of molecules directly from the surface of a tissue section. Recently, methods have been developed to determine released N-glycans directly from both fresh frozen and FFPE tissues.2 

A major challenge in the analysis of N-glycans is the large number of isobaric glycans resulting from their complex structures, including branched chains and multiple additions of fucose and sialic acid residues. In the case of MSI analysis, by nature there is no form of separation of the ionized molecules during the imaging analysis prior to the mass measurements, the identification of these isobaric glycans could be problematic.

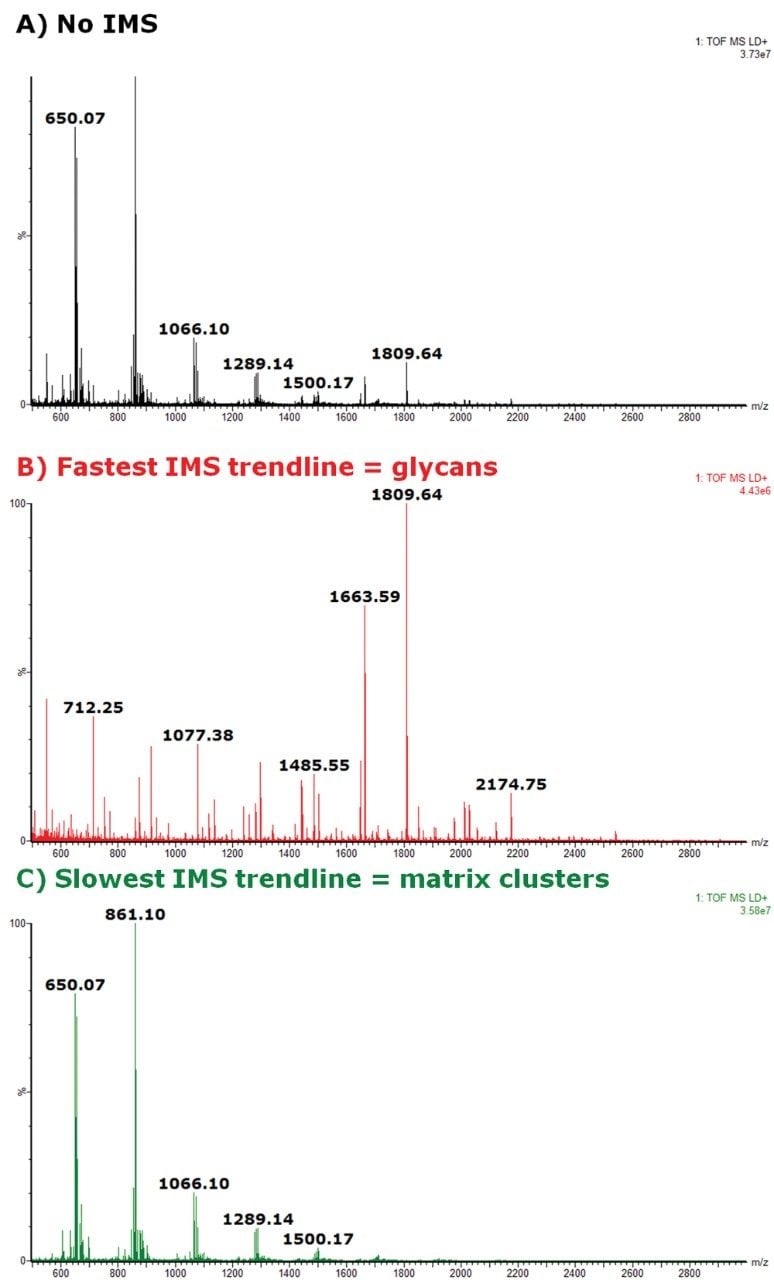
Here we report the use and advantages of ion mobility separation (IMS) to help differentiate these glycans in a MALDI MSI workflow for the clinical research analysis of human FFPE colon cancer tissue.

Results and Discussion

FFPE tissues were sectioned at 5 µm and mounted on standard glass slides. After incubation for one hour at 60° C, the tissue sections were deparaffinized with two washes in xylene, and rehydrated through a series of ethanol/water solutions. This was followed by antigen retrieval in citraconic anhydride for 25 min and slides were then water washed five times. To release the N-glycans from their proteins, a recombinant PNGaseF (Bulldog Bio) solution was sprayed on the tissue before incubating at 37° C for two hours at high humidity. A solution of MALDI matrix (a-Cyano-4-hydroxycinnamic acid) was sprayed onto the tissue prior to the MALDI imaging experiment. 

The experiment was carried out on a MALDI SYNAPT HDMS G2-Si where the Triwave separated ions according to their ion mobility in the gas phase. Analysis was carried out in positive mode with a mass range up to 3,000 Da, and a pixel size of 90 µm. MSI data were processed and visualized using Waters High Definition Imaging (HDI) version 1.4.

The overall MS spectrum (Figure 1A) shows strong signal for N-glycan molecules, demonstrating the efficacy of the digestion step of the methodology. Using prior knowledge of the type of glycans expected, 76 glycans were identified and mapped directly from the FFPE tissue section, ranging from a mass to charge ratio (m/z) of 771.5 up to an m/z of 2905.03 using accurate mass information. 

Figure 1. Overall MS spectrum and DriftScope 2D-plot m/z vs. drift time, along with the ion images of N-glycans released directly from a colon FFPE tissue section.

MALDI MSI was able to distinguish the tissue morphology and determine the tumor region based on specific ions, especially sodiated N-Glycans Hex7HexNAc2 (m/z 1581.5) which were highly abundant in the tumor tissue whereas Hex5dHex1HexNAc4 (m/z 1809.6) were more abundant in the non-tumor areas of the tissues.

When the fully integrated IMS dimension was explored using the DriftScope Software, it was clearly shown that two nested trendlines could be observed in overall 2D plot of m/z vs. drift time (in ms) (Figure 1B). The IMS-MS data showed a more specific analysis of the N-glycans than when compared to the MS data alone (Figure 2) with the overall signal enhancement of the different classes of molecules. The fastest trendline, corresponding to more compact conformations of the ions in the gas phase, was identified to be the N-glycan class of molecules (Figure 2B) whereas the slowest trendline was representative of the CHCA matrix clusters ions (Figure 2C).  

Figure 2. MS spectra illustrating the specificity of IMS. A) MS spectrum with no IMS, B) MS spectrum extracted from the fastest trendline from DriftScope 2D plot m/z vs. drift time representing the glycans species and C) MS spectrum extracted from the slowest trendline representing the CHCA matrix cluster ions.

When particular glycans are studied, several demonstrated an extracted mobilogram peak that was broader than the expected IMS resolution or  had shoulder peaks, indicating that isobaric species were present. 

For example, m/z 1444.5 corresponding to sodiated Hex4dHex1HexNAc3, and the IMS displayed two distinct peaks which, while not baseline separated (see Figure 3B), were sufficiently separated as to obtain individual ion images showing distinctly different distributions. The isobaric species with the faster drift time were evenly distributed across the non-tumor and tumor tissue types of the section (see Figure 3C), whereas the isobaric species with the slower drift time were more abundant in the non-tumor regions of the tissue (see Figure 3D). 

Figure 3. Example of N-glycan [Hex4dHex1HexNAc3+Na]+ (m/z 1444.51, MS spectrum A) showing two isobaric species in the extracted mobilogram (B), giving two distinct ion images (C and D) and their red/green overlay ion image (E).

Conclusion

  • An efficient N-glycan release procedure was applied to colonic FFPE tissue section and analyzed by a MALDI MSI.
  • This IMS procedure offers an orthogonal separation from MS alone and can be fully incorporated within MALDI MSI experiments.
  • The glycan trendline was easily distinguished from the MALDI matrix cluster trendline, giving a more specific overall MS spectrum.
  • A truer visualization of isobaric N-glycans was demonstrated for clinical research, highlighting potential differences in isomer abundance in tumor vs. non-tumor tissue regions.

References

  1. Howlader N, Noone AM, Krapcho M, Miller D, Bishop K, Altekruse SF, Kosary CL, Yu M, Ruhl J, Tatalovich Z, Mariotto A, Lewis DR, Chen HS, Feuer EJ, Cronin KA (eds). SEER Cancer Statistics Review, 1975-2013, National Cancer Institute. Bethesda, MD, http://seer.cancer.gov/csr/1975_2013/, based on November 2015 SEER data submission, posted to the SEER web site, April 2016.
  2. Powers TW, Richard R. Drake et al: MALDI Imaging Mass Spectrometry Profiling of N-glycans in Formalin-Fixed Paraffin Embedded Clinical Tissue Blocks and Tissue Microarrays, PLoS One. 2014 Sep; 9(9): e106255.

720006007, June 2017

返回顶部 返回顶部