A Rapid and Comprehensive UHPLC-MS/MS Clinical Toxicology Research Method for the Analysis of Benzodiazepines in Urine
仅供研究使用,不适用于诊断。
Abstract
This application note describes a clinical toxicology research method for the solid phase extraction and UHPLC-MS/MS analysis of traditional and designer benzodiazepines for clinical and forensic toxicological analysis. Benzodiazepines are widely prescribed and have high rates of abuse.1 The emergence of new designer benzodiazepines has increased concerns of this abuse, as they are initially not controlled and have unknown health risks.2
The described research method includes a simplified sample preparation procedure that reduces the number of manual steps, produces high recoveries, consistent matrix effects, and accurate and precise quantitative data. The use of the ACQUITY™ UPLC™ BEH™ C18 Column results in rapid analysis of a panel of 26 benzodiazepine compounds, while maintaining all required baseline separations for accurate quantification. This combination of sample preparation, UHPLC separation, and MS/MS detection optimizes the workflow and results in a rapid, method for quantification of traditional and designer benzodiazepines.
Benefits
- Rapid, simplified sample preparation protocol resulting in efficient and consistent recovery for all analytes
- All sample pretreatment and extraction performed in-well, eliminating transfer steps
- UHPLC-MS/MS analysis results in excellent separation of 26 benzodiazepines in four minutes
Introduction
Benzodiazepines are important clinical and forensic toxicology drugs which are widely prescribed for neurological and psychiatric disorders but are also highly abused.1 They can cause side effects such as drowsiness, fatigue, amnesia and have a high potential for addiction. Benzodiazepines are abused to reinforce opioid euphoric effects, counteract the effects of stimulant abuse or to perpetuate drug-facilitated sexual assault.1 Since the mid-2000s, many new designer benzodiazepines have been reported and continue to emerge, many of which were initially not controlled internationally.2 The potency and risks associated with designer benzodiazepines are largely unknown, causing public health and safety concerns. A particular concern is the growing use of designer benzodiazepines to make counterfeit tablets of commonly prescribed benzodiazepine medication, which individuals could be unaware they are taking.2
The aim of this study was to develop a comprehensive research method for confirmatory and quantitative analysis of traditional and designer benzodiazepines. The method employs a simplified mixed-mode sample extraction procedure using Oasis™ MCX µElution™ Plates coupled with a rapid and reproducible chromatographic method using an ACQUITY UPLC BEH C18 Column that achieves baseline separation for all analytes. This was applied in conjunction with a Waters Xevo™ TQ-S micro operated in electrospray positive ion mode.
Experimental
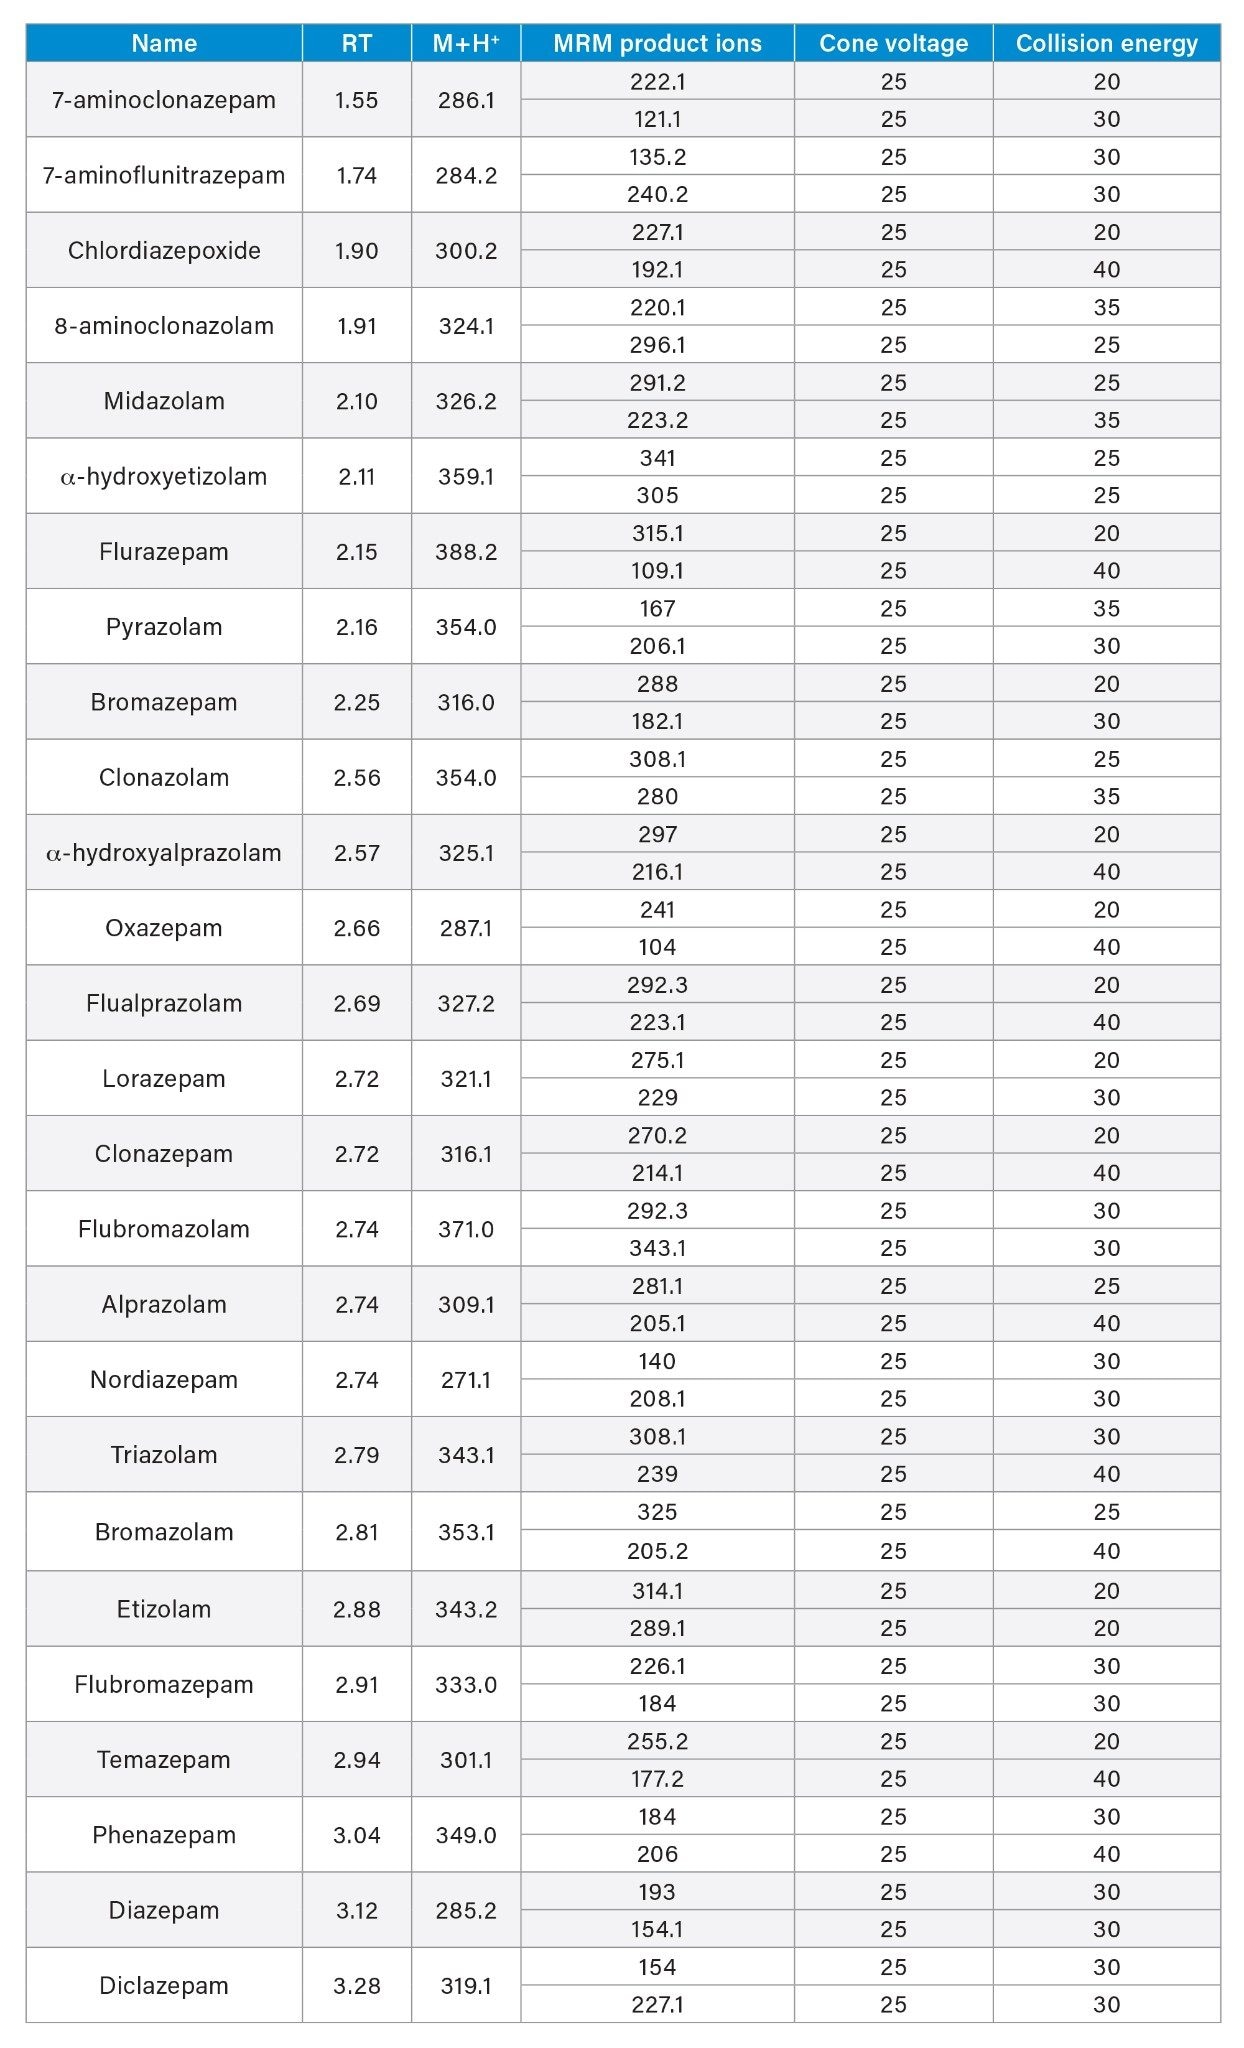
Reference material for all analytes was obtained from Cerilliant (Round Rock, TX) and Cayman Chemical (Ann Arbor, MI). A mixed stock solution was prepared in methanol at a concentration of 10 µg/mL. Stable isotope labeled internal standards were used for all compounds except clonazepam, lorazepam, etizolam, 8-aminoclonazolam, flubromazolam, flualprazolam, pyrazolam, and α-hydroxyetizolam. In those cases, the internal standard either interfered with the quantification of another analyte or the stable labeled IS was not readily available, therefore a surrogate internal standard was used. Samples were prepared by diluting stock solutions into pooled, blank urine. Calibration samples were prepared with the concentration range of 5–1000 ng/mL for all analytes. Quality control samples (QCs) at four concentrations covered by the calibration curve were also prepared (15, 75, 200, 750 ng/mL). B-One β-glucuronidase was obtained from Kura Biotech (Atlanta, GA). External quality control material was obtained from UTAK Laboratories (Valencia, CA). Proficiency test samples were obtained from Axio Proficiency Testing, LGC Group (Bury, UK), for which satisfactory performance was deemed as a z score ≤2. All analytes, along with their retention times, are listed in Table 1.
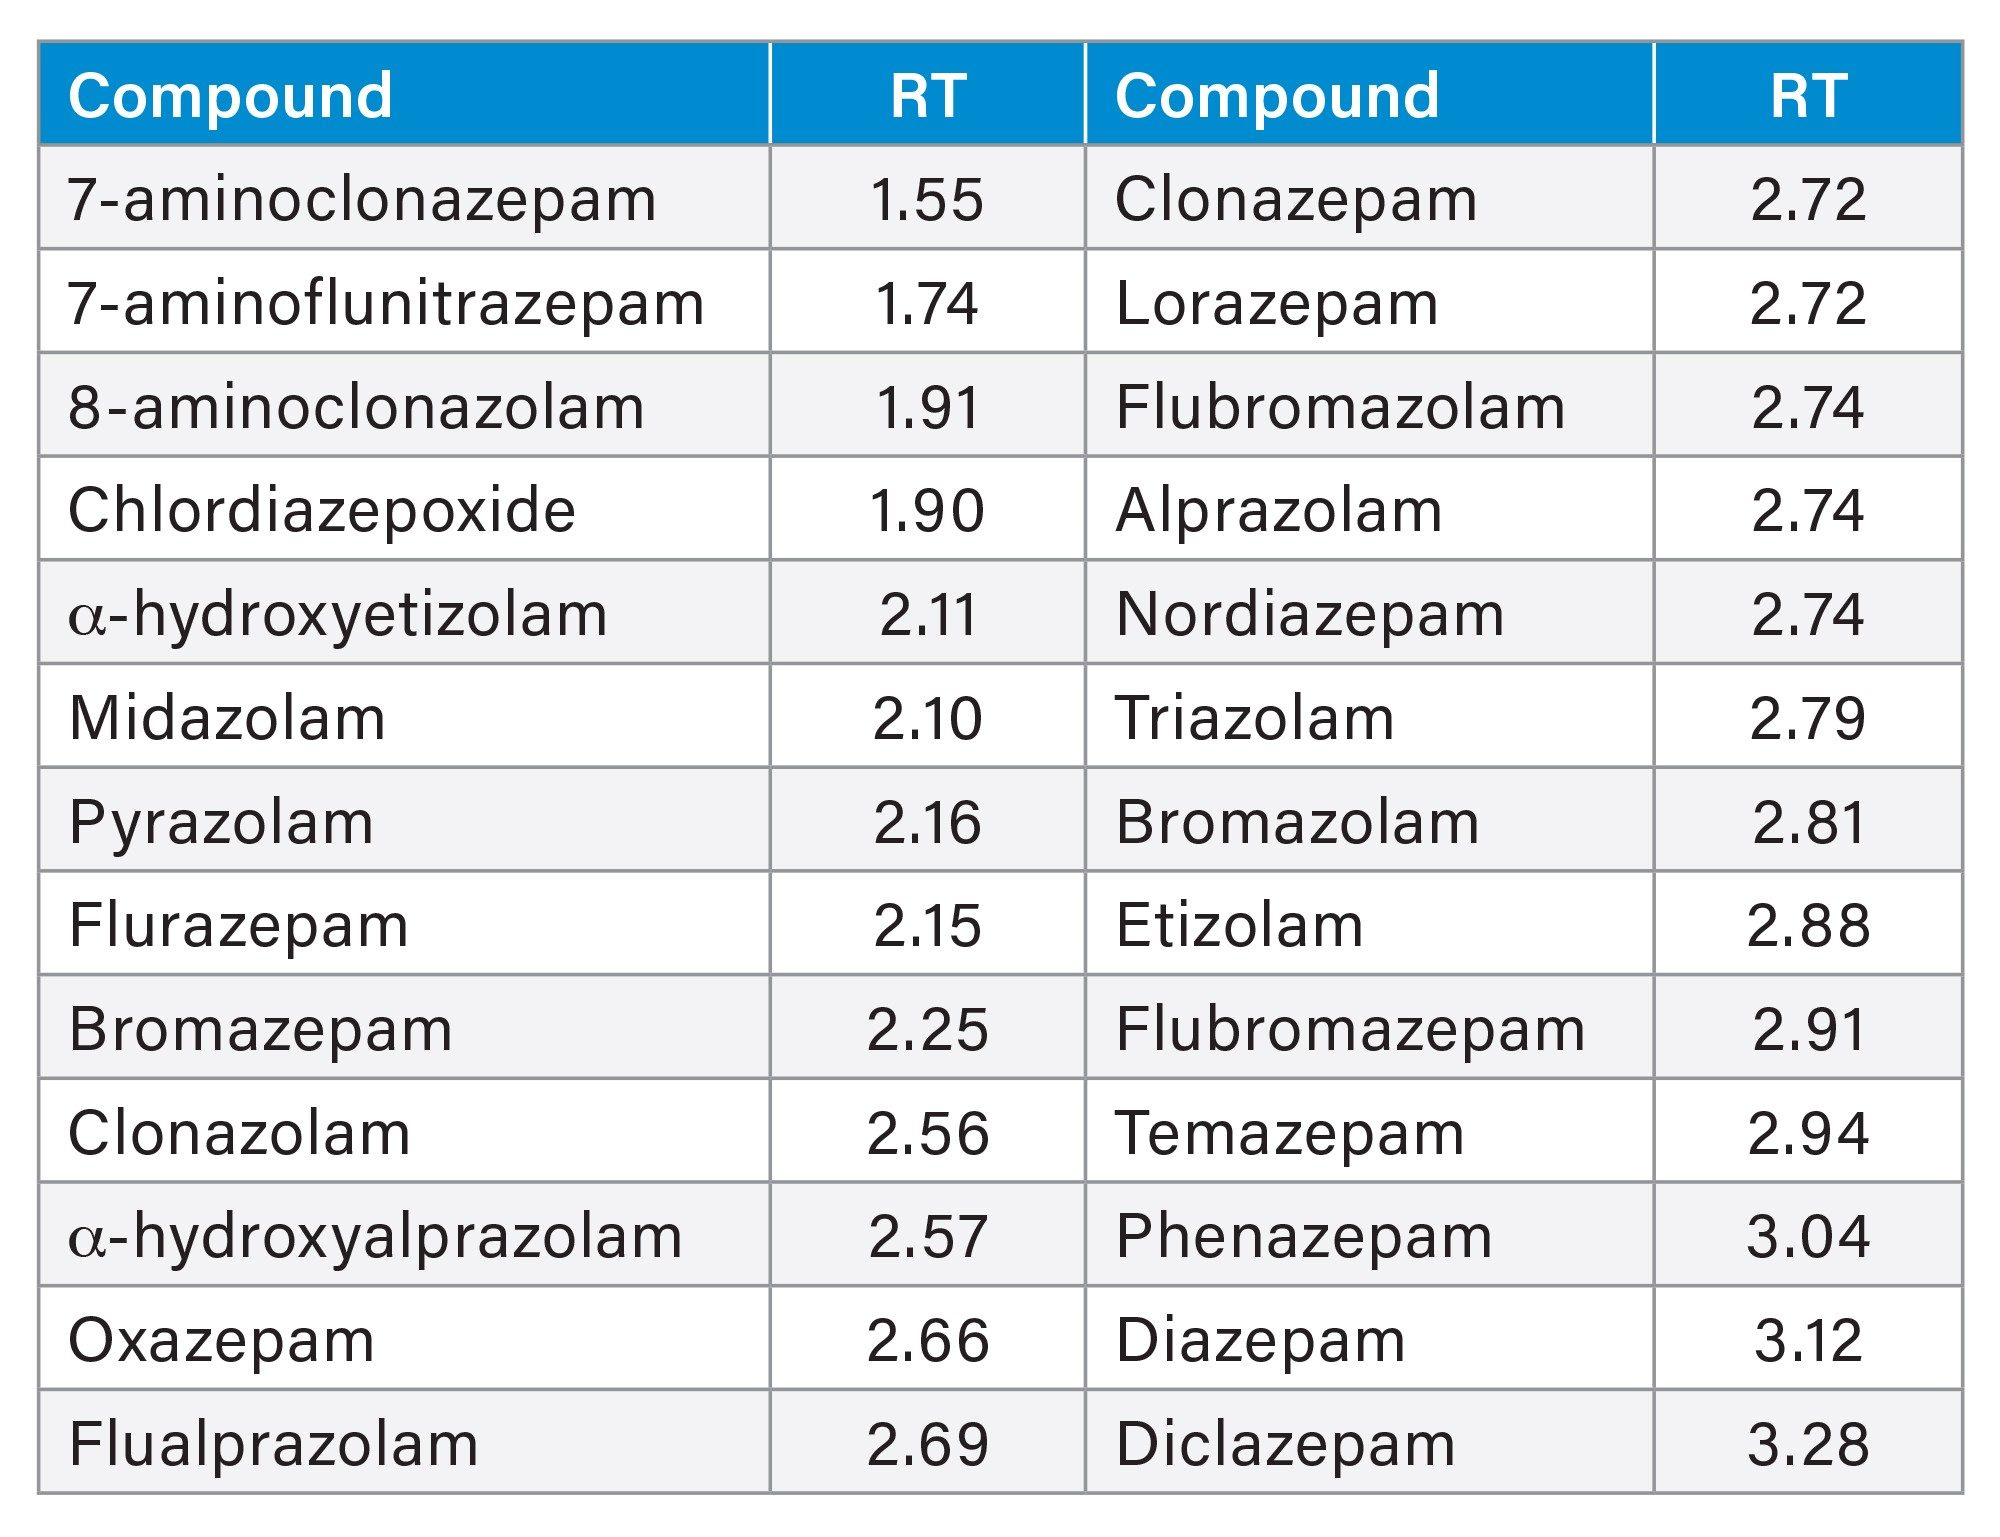 Table 1. Retention time of all compounds. Concentration range 5–1000 ng/mL.
SPE Extraction
100 µL of urine was added to individual wells of an Oasis MCX µElution Plate, followed by 100 µL of enzyme hydrolysis mix and 20 µL of 250 ng/mL internal standards, and mixed by several aspirations. After a 10 minute incubation at room temperature, 200 µL of 4% H3PO4 was added and mixed by several aspirations. All samples were loaded directly into the sorbent bed by vacuum and subsequently washed with 200 µL of 80:20 H2O:MeOH, the plate was dried under high vacuum (~15 inch Hg) for one minute to remove as much of the wash solution as possible. Samples were eluted using 2x25 µL of 50:50 ACN:MeOH containing 5% strong ammonia solution (Fisher, 28–30%). All samples were diluted with 150 µL of sample diluent (2% ACN:1% formic acid in MilliQ water) prior to LC-MS/MS analysis. A graphical workflow of the extraction procedure is shown in Figure 1.
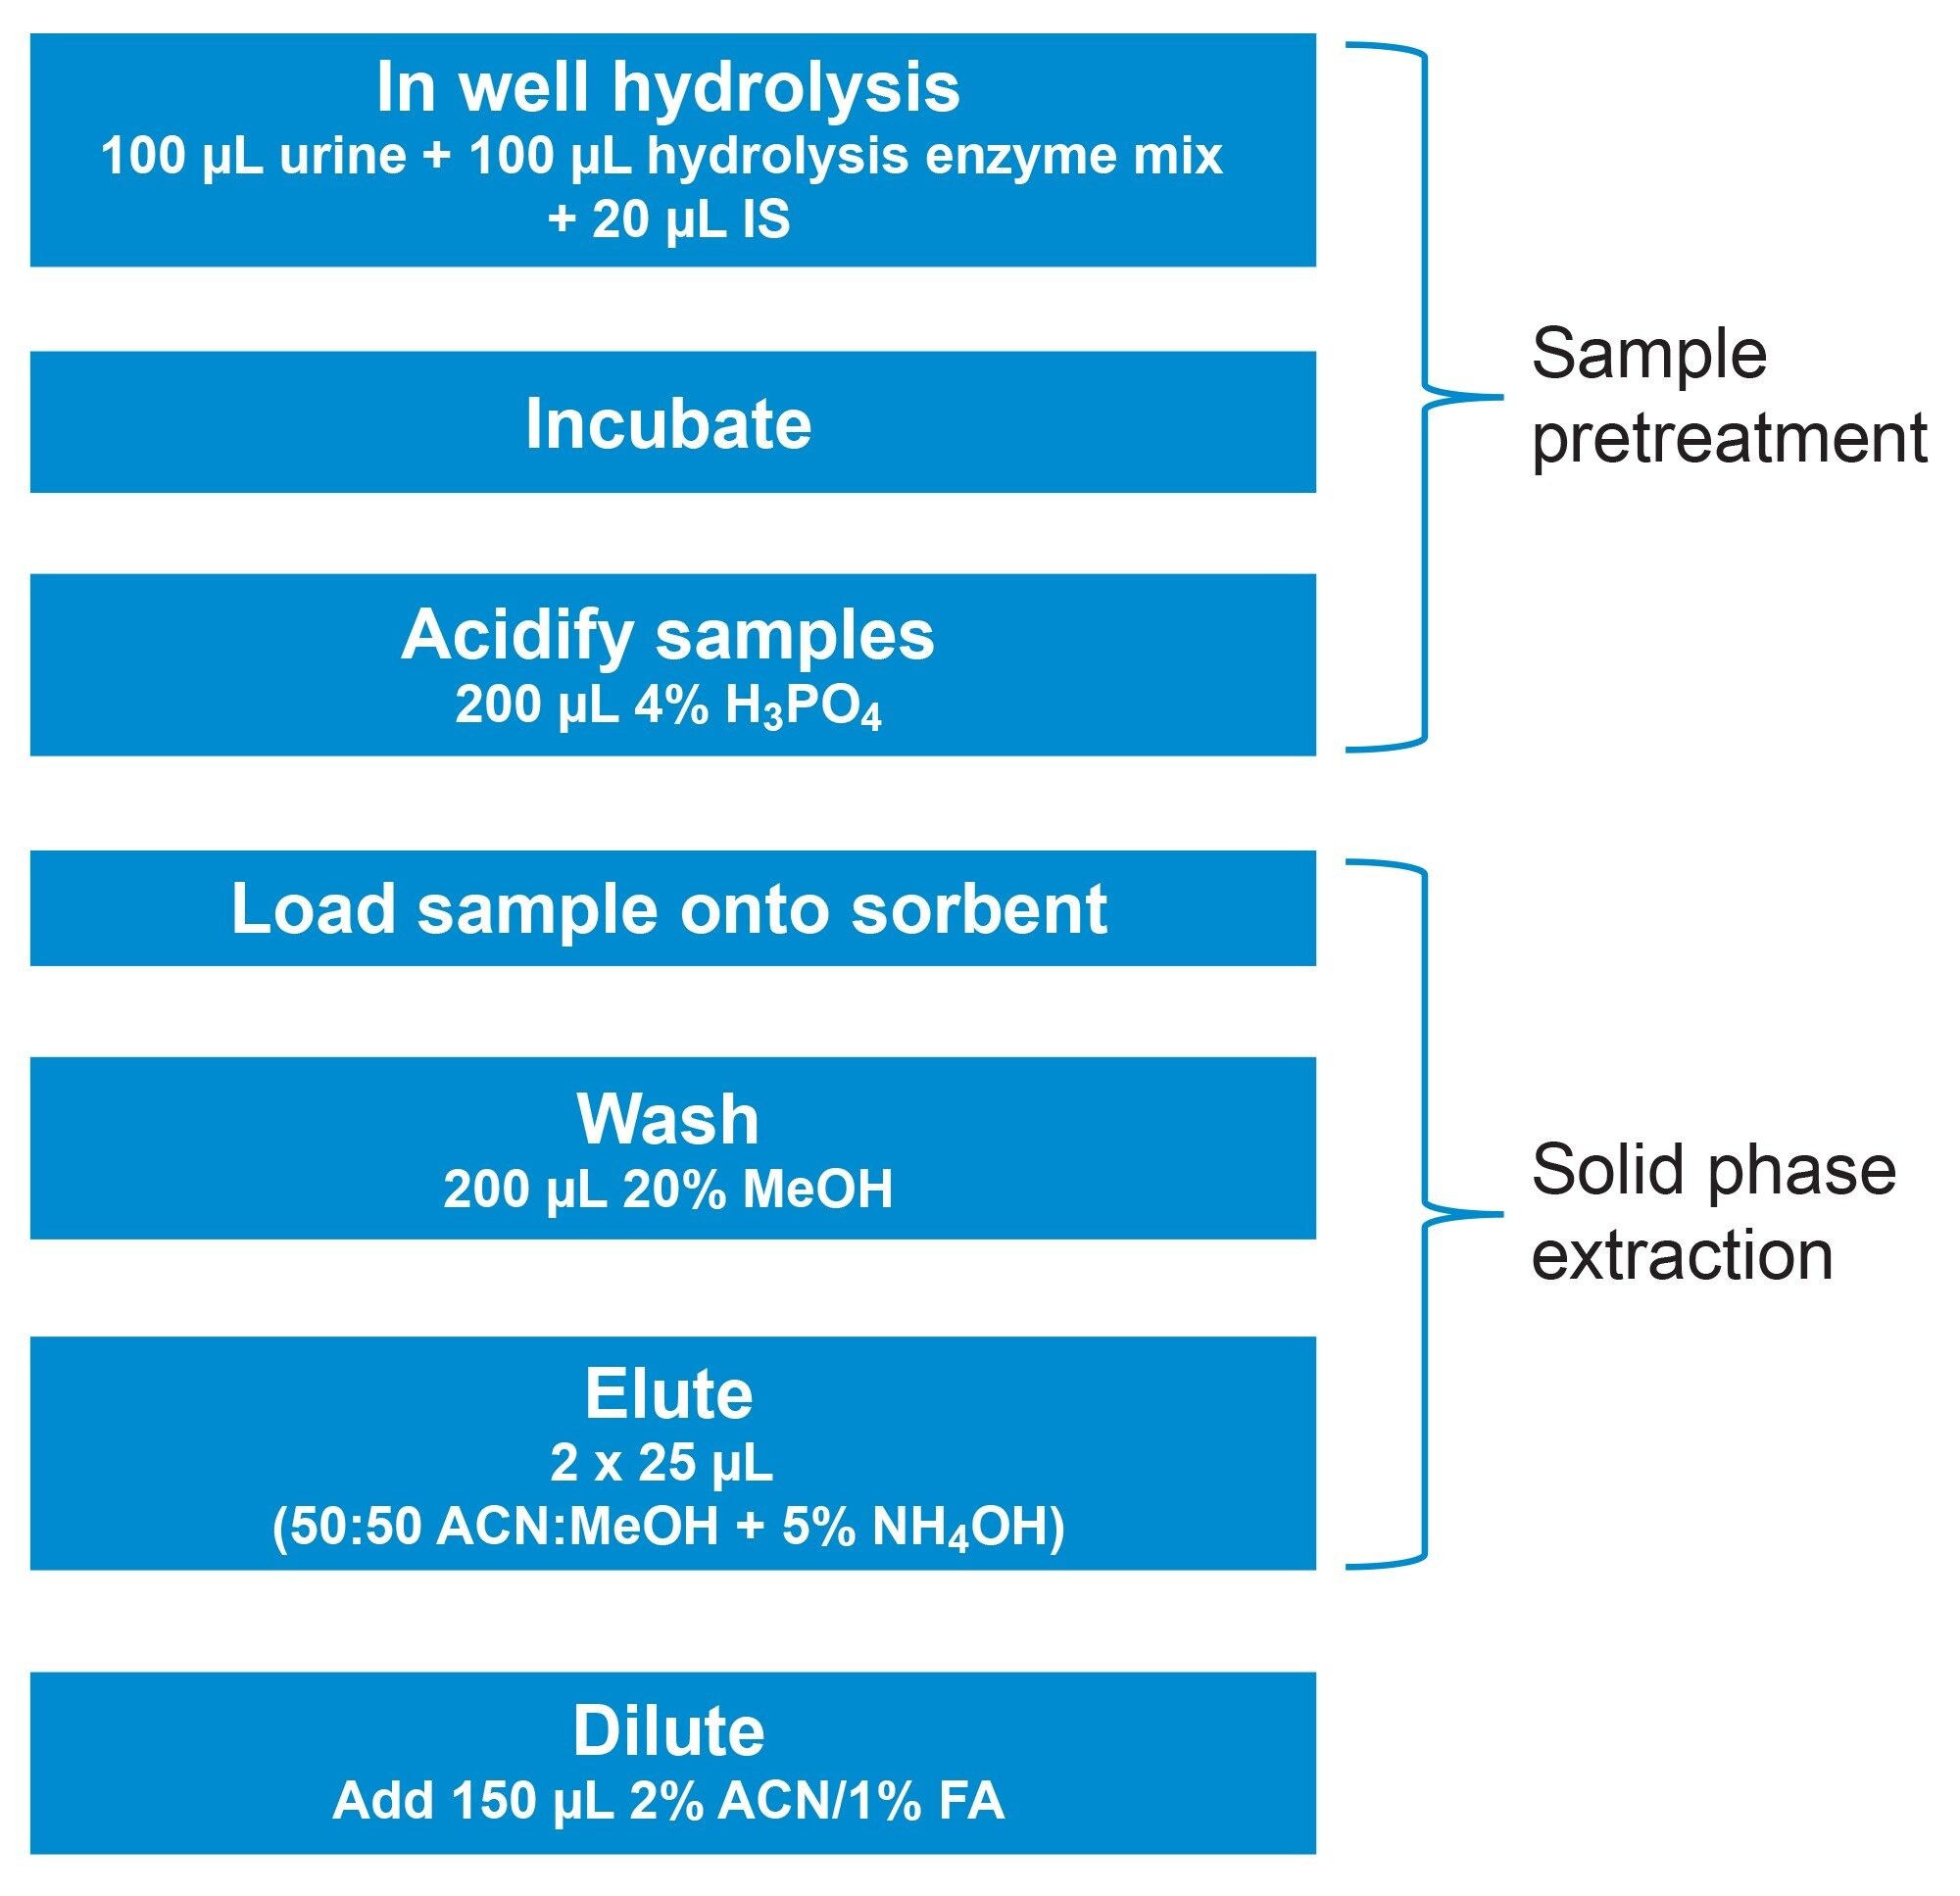 Figure 1. Details of the extraction method for the analysis of a comprehensive benzodiazepine panel using Oasis MCX µELution Plates. Enzymatic hydrolysis and sample pretreatment are performed in the wells of the extraction plate, minimising transfer steps. Conditioning and equilibration steps are eliminated, and a single wash step is used instead of two, significantly simplifying the procedure.
UHPLC-MS/MS Analysis
A UHPLC-MS/MS method was applied in conjunction with a Waters Xevo TQ-S micro Mass Spectrometer which was operated with electrospray positive mode. Two multiple reaction monitoring (MRM) transitions were monitored for each of the 26 analytes and a single MRM transition was monitored for the deuterated internal standards. The UHPLC-MS/MS conditions employed are displayed below.
LC Conditions
|
LC system: |
ACQUITY UPLC I-Class (FTN) |
|
Column: |
ACQUITY UPLC BEH C18 1.7 µm, 2.1 x 100 mm |
|
Column temperature: |
40 °C |
|
Sample temperature: |
10 °C |
|
Injection volume: |
5 µL |
|
Flow rate: |
0.6 mL/min |
|
Mobile phase A: |
0.1% Formic acid in MilliQ water |
|
Mobile phase B: |
0.1% Formic acid in acetonitrile (ACN) |
|
Wash solvent: |
25:25:25:25 MeOH:H2O:IPA:ACN |
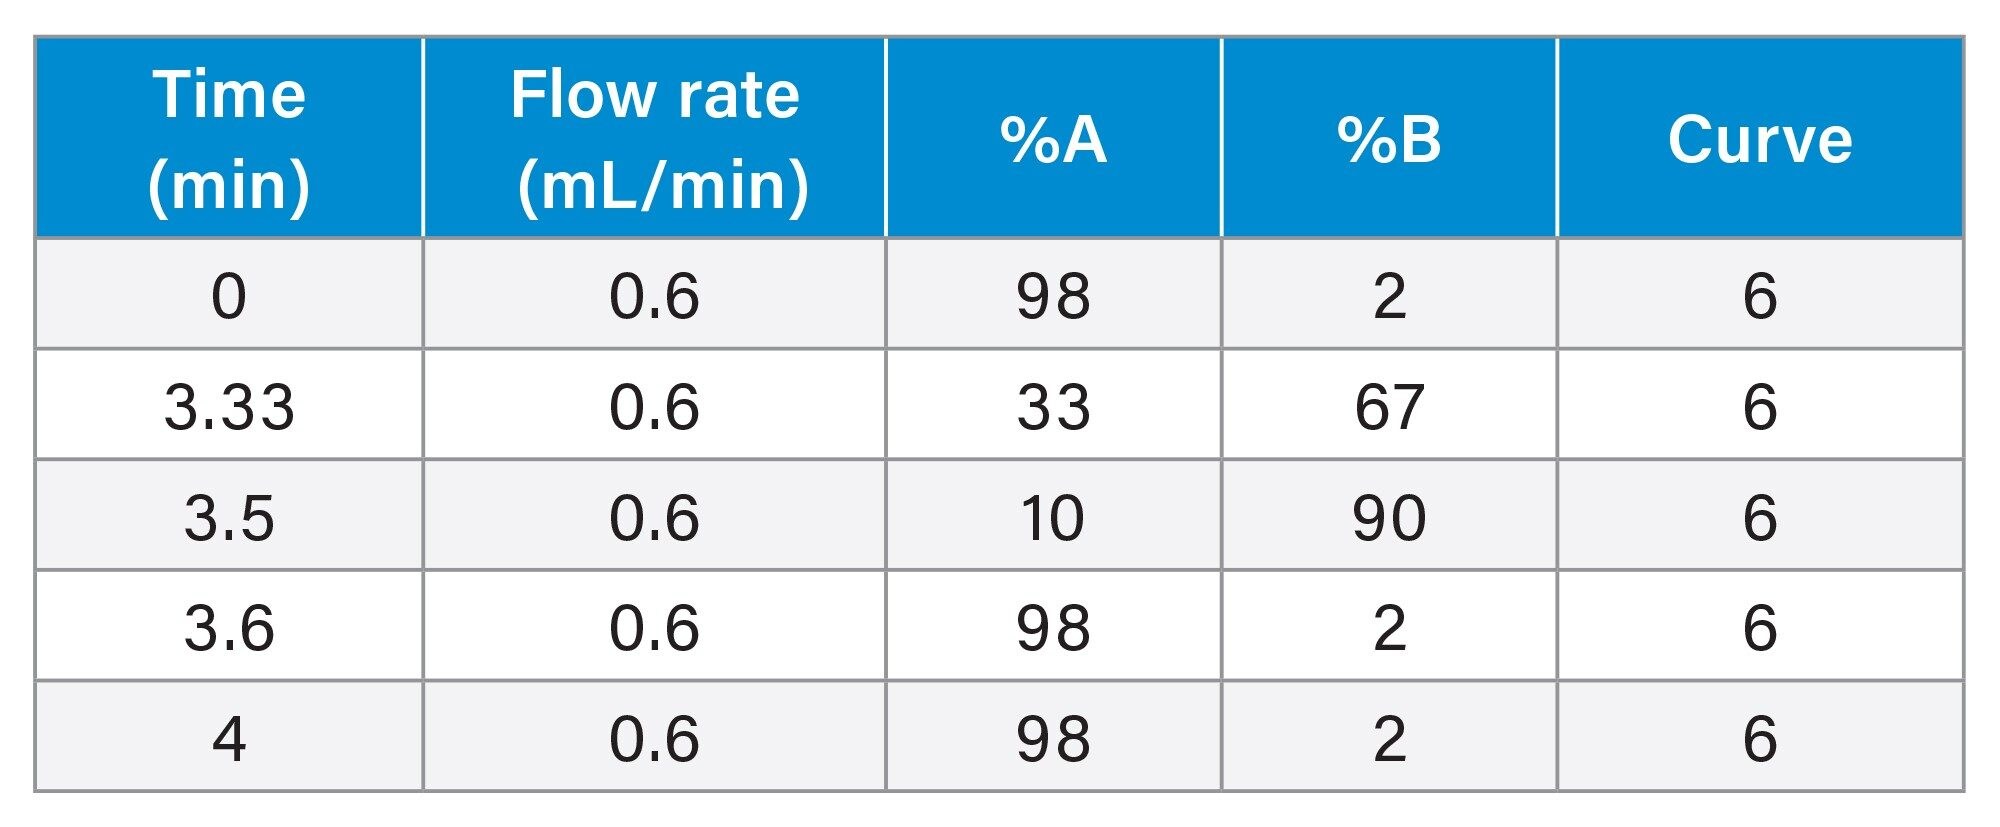
Gradient Table
MS Conditions
|
MS system: |
Xevo TQ-S micro |
|
Ionization mode: |
ESI positive |
|
Desolvation temperature: |
500 °C |
|
Desolvation gas flow: |
1000 L/hr |
|
Cone gas flow: |
150 L/hr |
|
Acquisition range: |
MRM transitions optimized for individual compounds |
|
Capillary voltage: |
1.0 kV |
|
Collision energy: |
Optimized for individual compounds (See Appendix 1) |
|
Cone voltage: |
Optimized for individual compounds (See Appendix 1) |
Data Management
|
MS software: |
MassLynx |
|
Quantification software: |
TargetLynx XS or waters_connect QUAN Review |
Results and Discussion
Chromatography
All benzodiazepine compounds included in the panel are listed in Table 1, along with their retention times. Figure 2 shows the chromatograms for the quantifier ions from a urine sample spiked with the 26 compounds at 50 ng/mL, separated on the ACQUITY UPLC BEH C18 Column. Care was taken to ensure that there was no interference between any compounds and internal standards and baseline separation was achieved for the majority of the compounds. Some internal standards were found to interfere with the quantitation of some compounds, for example clonazepam-d4 and lorazepam, in those cases, surrogate internal standards were used rather than the deuterated form. The high efficiency of the UPLC column enabled all compounds to elute in 3.5 minutes, with a total run time of four minutes, without any loss of resolution.
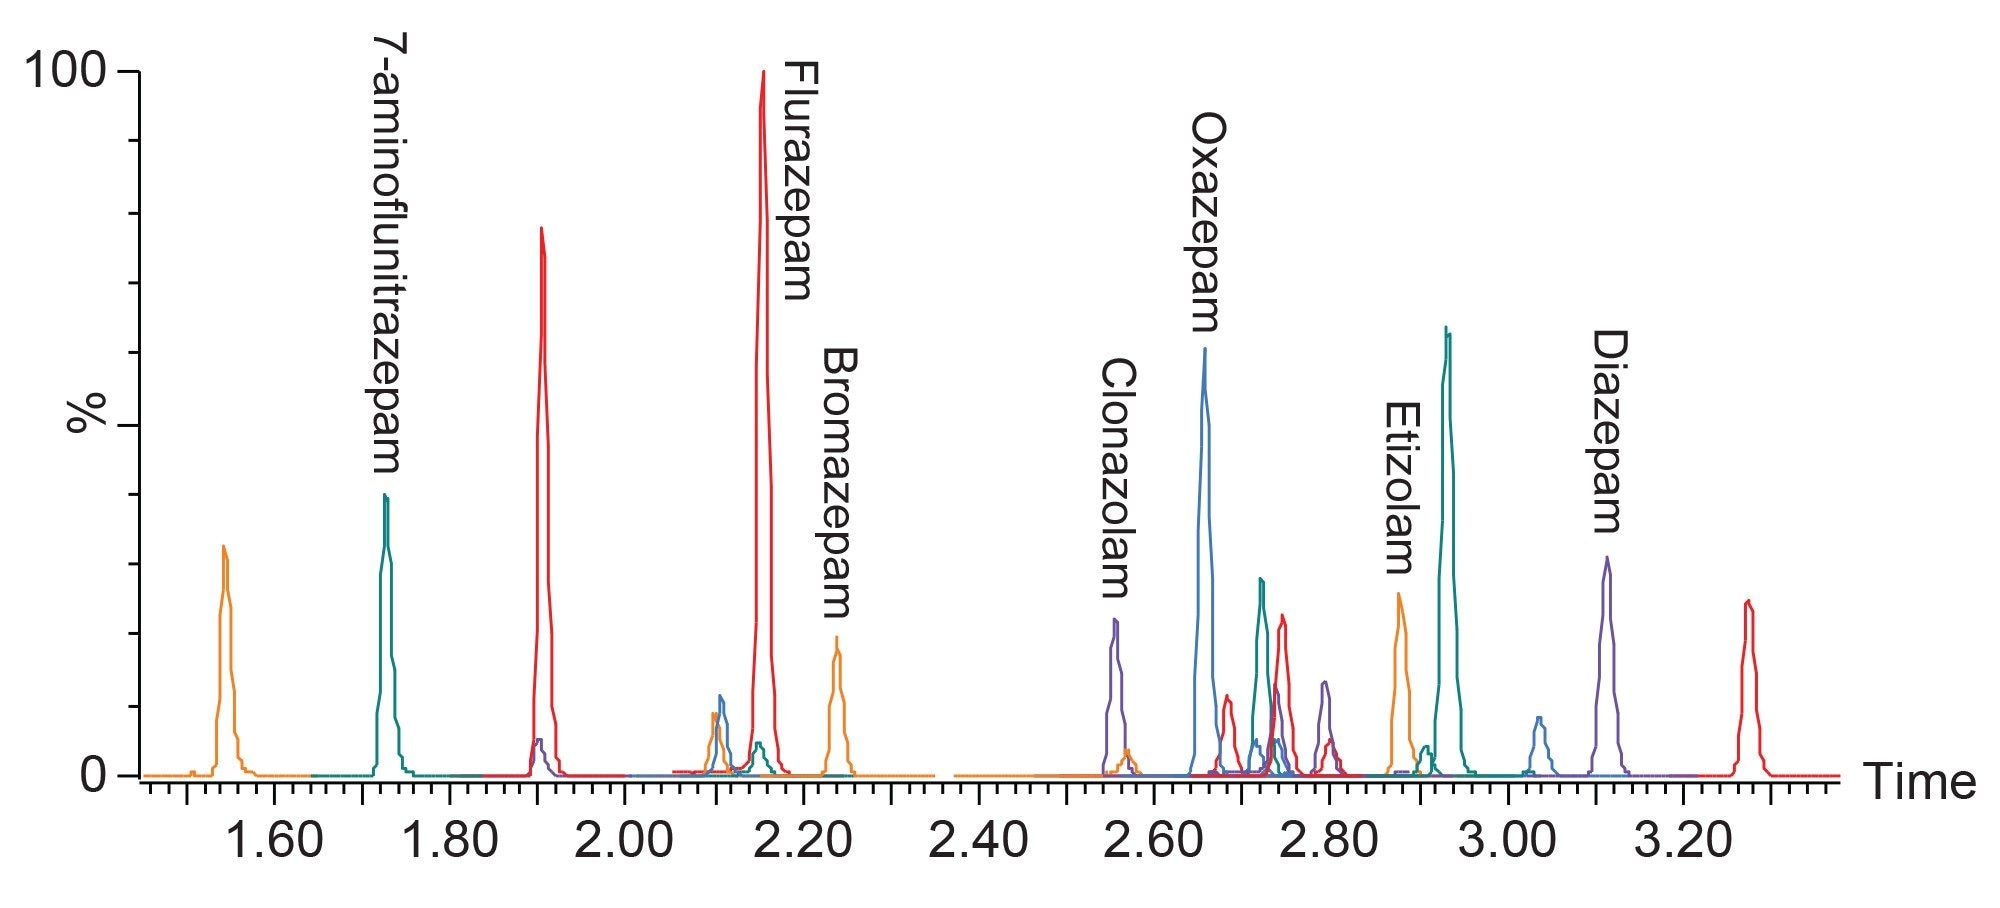 Figure 2. Chromatography of all compounds included in the panel, analysed on the ACQUITY UPLC BEH C18 column. The earliest eluting compound is 7-aminoclonazepam at 1.55 minutes and the latest eluting compound is diclazepam at 3.26 minutes.
Data processing using QUAN Review enables efficient review of results with structured workflow which includes focused exceptions, including flags and alerts. The software allows users to simultaneously view chromatograms, calibrations and QC samples for all compounds which can reduce time spent analyzing LC-MS/MS data and therefore reduce the turnaround times for sample results. Figure 3 shows the integration review window with acceptance criteria listed, which enables at a glance review from an operator.
 Figure 3. QUAN review peak integration review window for Bromazolam at 5 ng/mL. The quantifier, qualifier and internal standard transitions are displayed, above the acceptance criteria for retention time and ion ratio.
Recovery and Matrix Effects
Quantitative and confirmatory analysis require efficient and consistent recoveries. As in previous work, the wash protocol was modified from the traditional MCX technique to accommodate the benzodiazepines’ unique chemistry.3 Figure 4 shows the mean extraction recoveries of the entire panel of benzodiazepines from six different lots of urine. The mean recovery was 86% (range 79% to 102%) and all compounds had recoveries greater than 75%. Coefficients of variation (%CV) were less than 10%. These highly efficient recoveries across different matrix lots demonstrate that the robustness of the described extraction technique and are also important for the quantification of these compounds in samples from different sources.
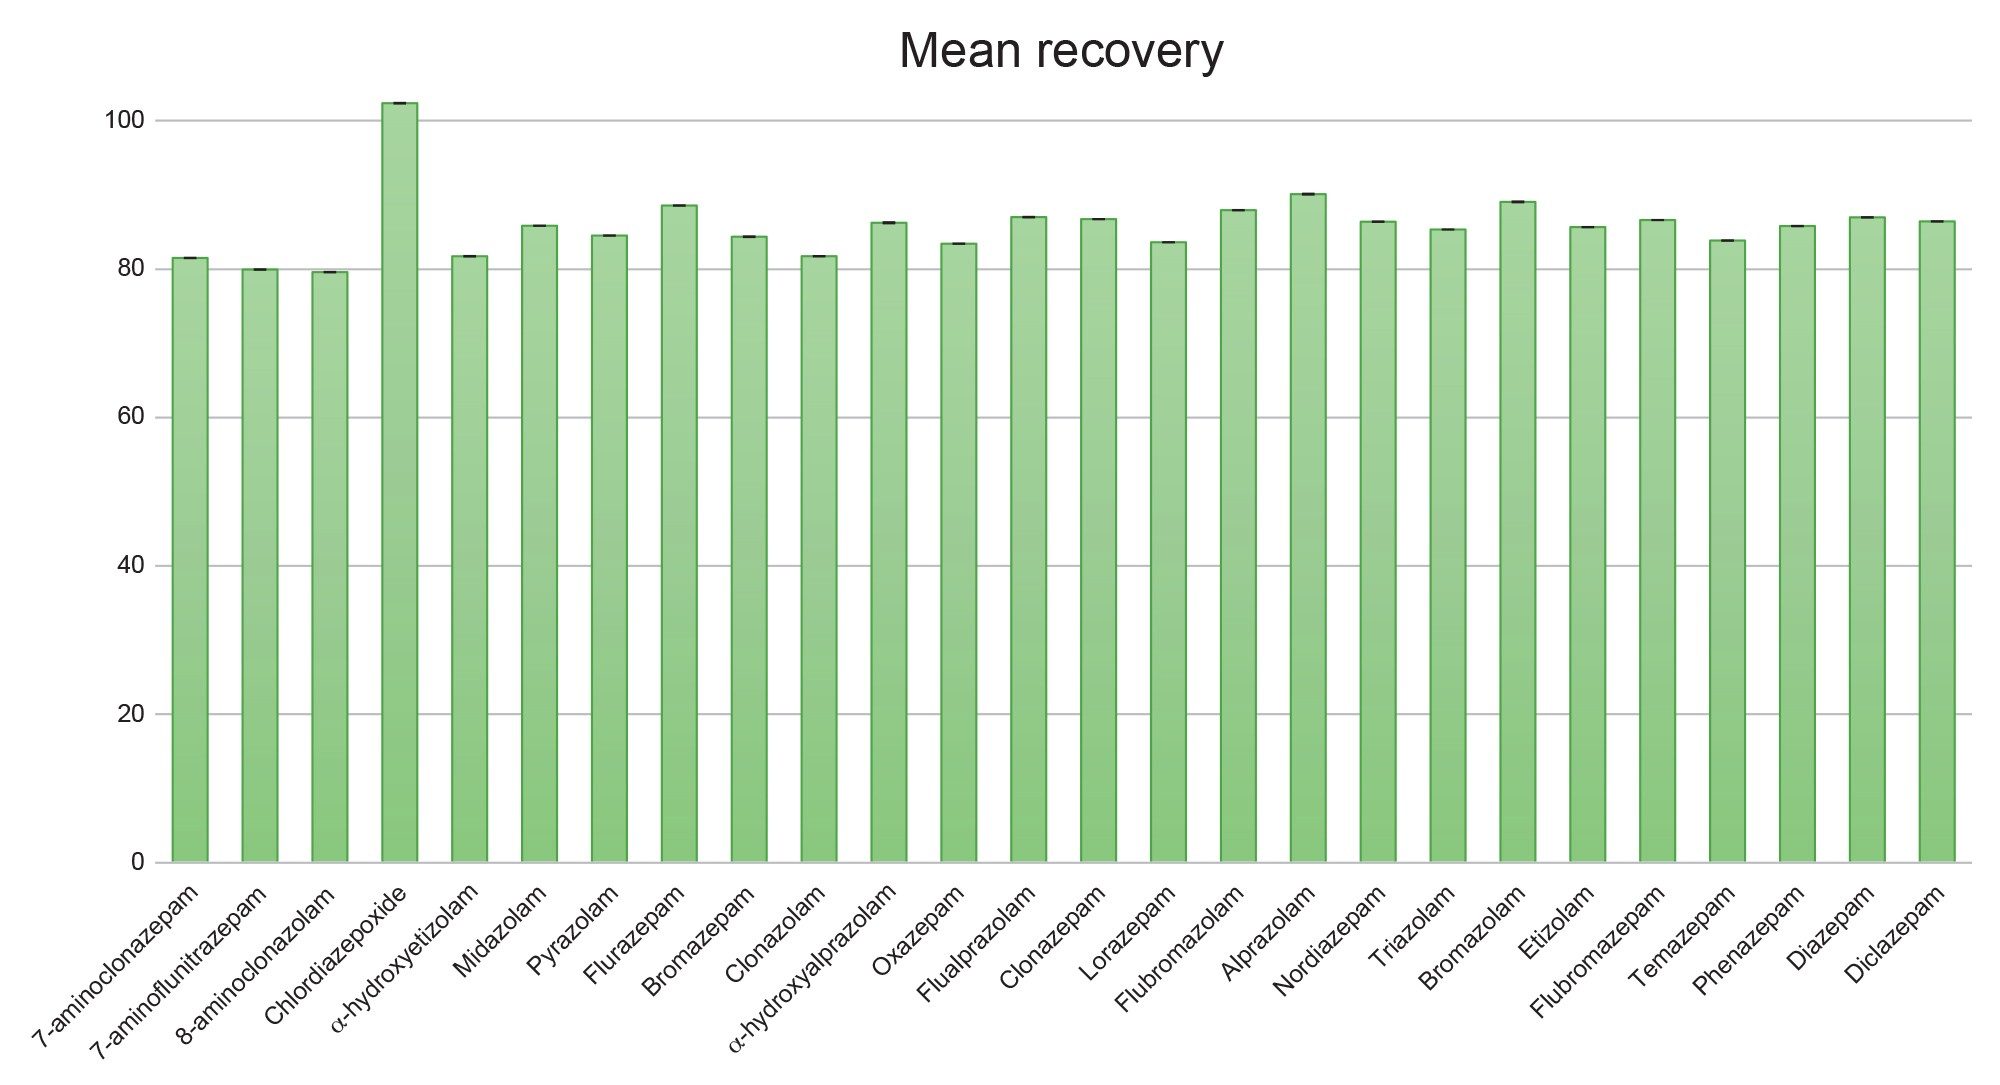 Figure 4. Mean extraction recovery for the compounds included in the benzodiazepine panel. Values represent the mean of six different lots of urine. N=4 for each lot.
Matrix effects were also evaluated using multiple lots of urine. Figure 5A shows the aggregate matrix effects from six lots of urine. Ion suppression was observed for the majority of the compounds in the panel; effects ranged from 30% ion suppression for chlordiazepoxide to 35% ion enhancement for α-hydroxyalprazolam. With the exception of 8-aminoclonazolam, standard deviations for matrix effects were less than 15%, indicating consistent matrix lot to lot performance. Figure 5B shows the matrix effects when corrected using the internal standards. In this case matrix effects corrected with the use of an internal standard were less than 20% for all compounds, except for pyrazolam and flubromazolam which did not have deuterated internal standards available, therefore a surrogate internal standard was used.
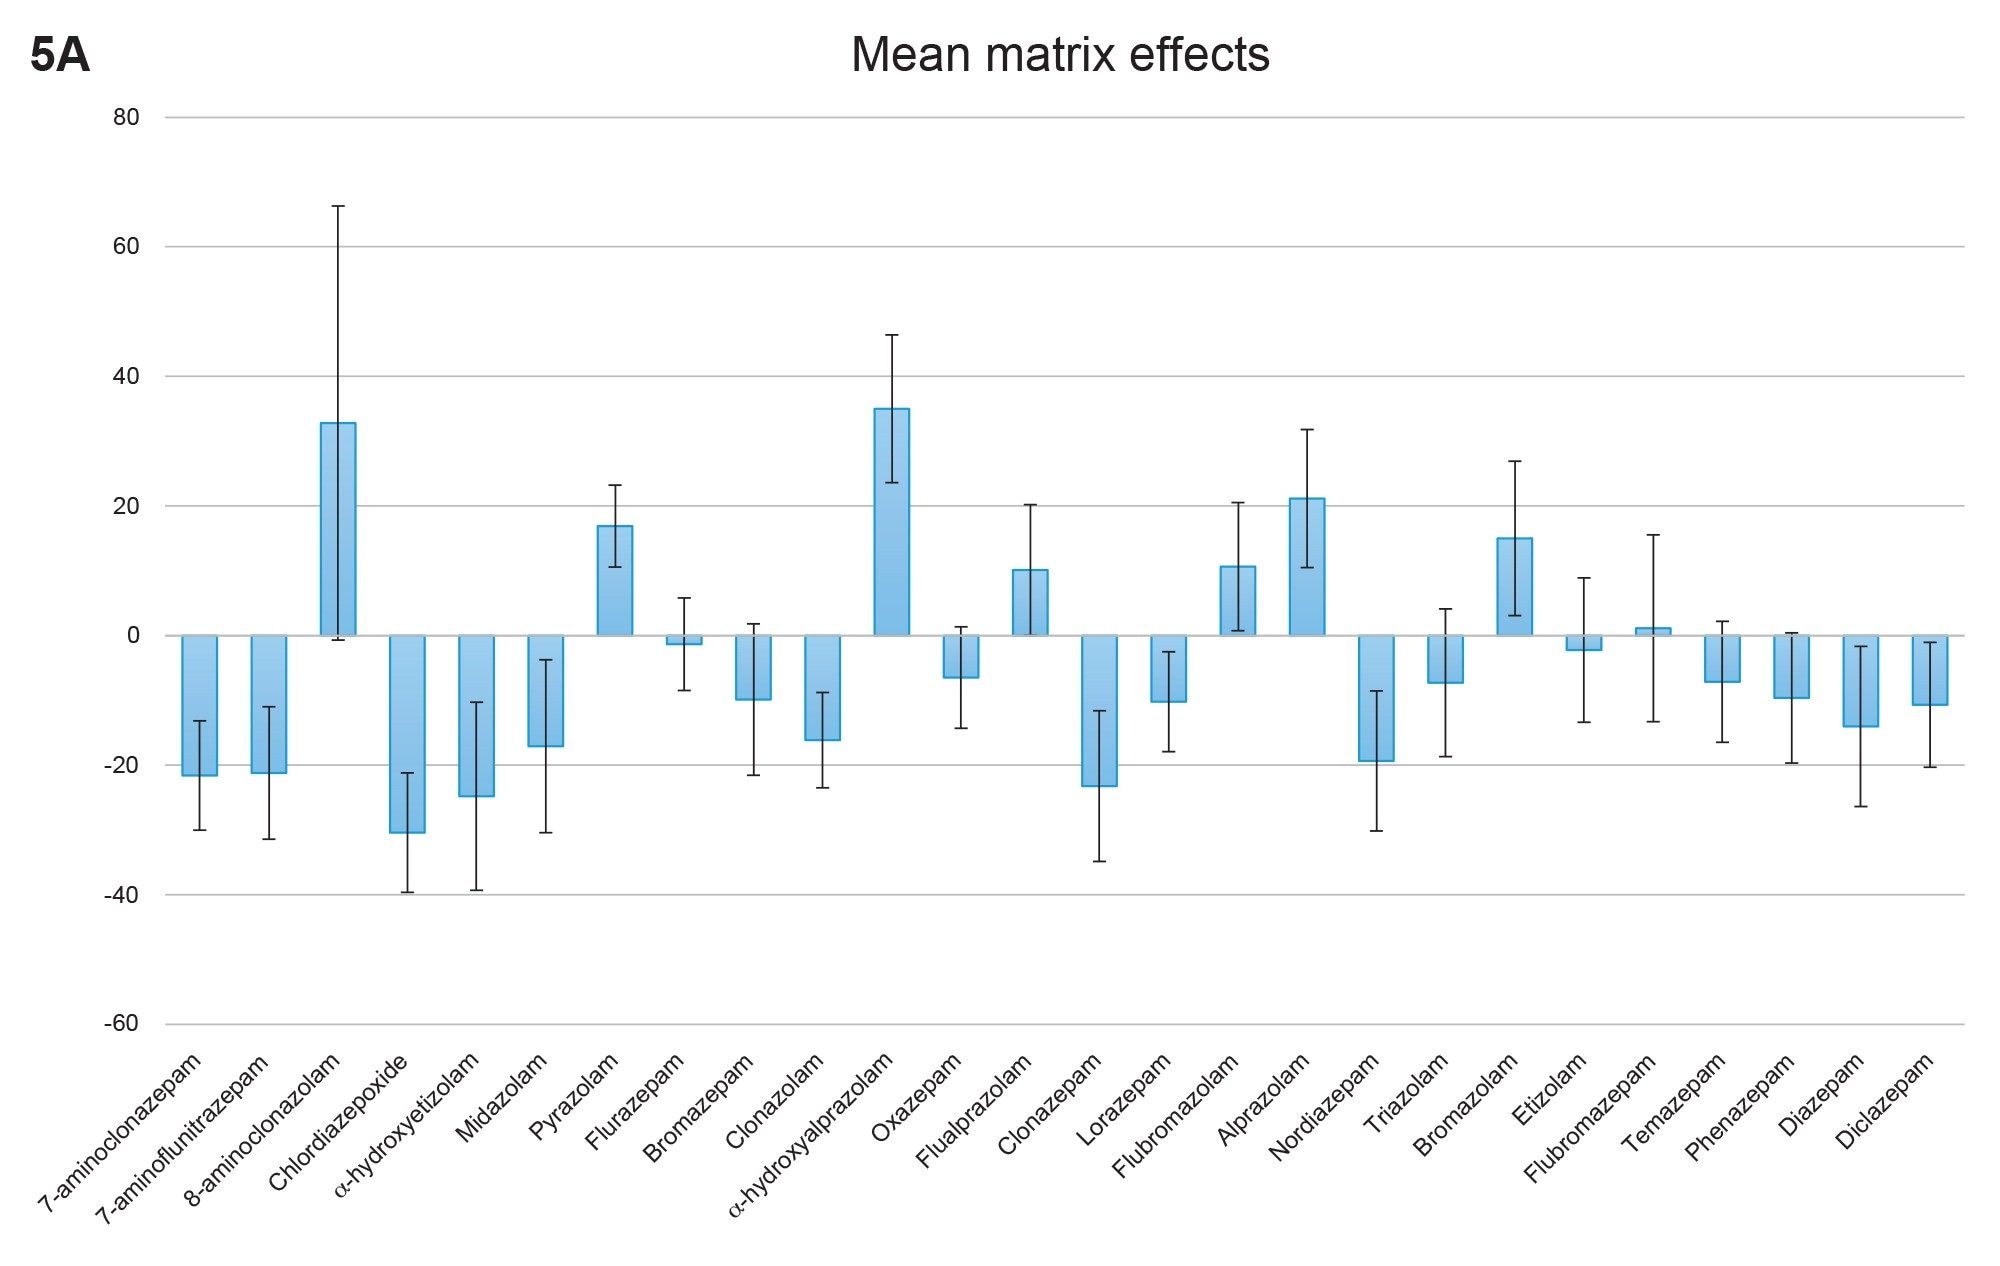 Figure 5A. Mean matrix effects for the compounds included in the benzodiazepine panel. Values represent the mean of six different lots of urine, N=4 for each lot. Bars indicate mean matrix effects and error bars indicate standard deviations.
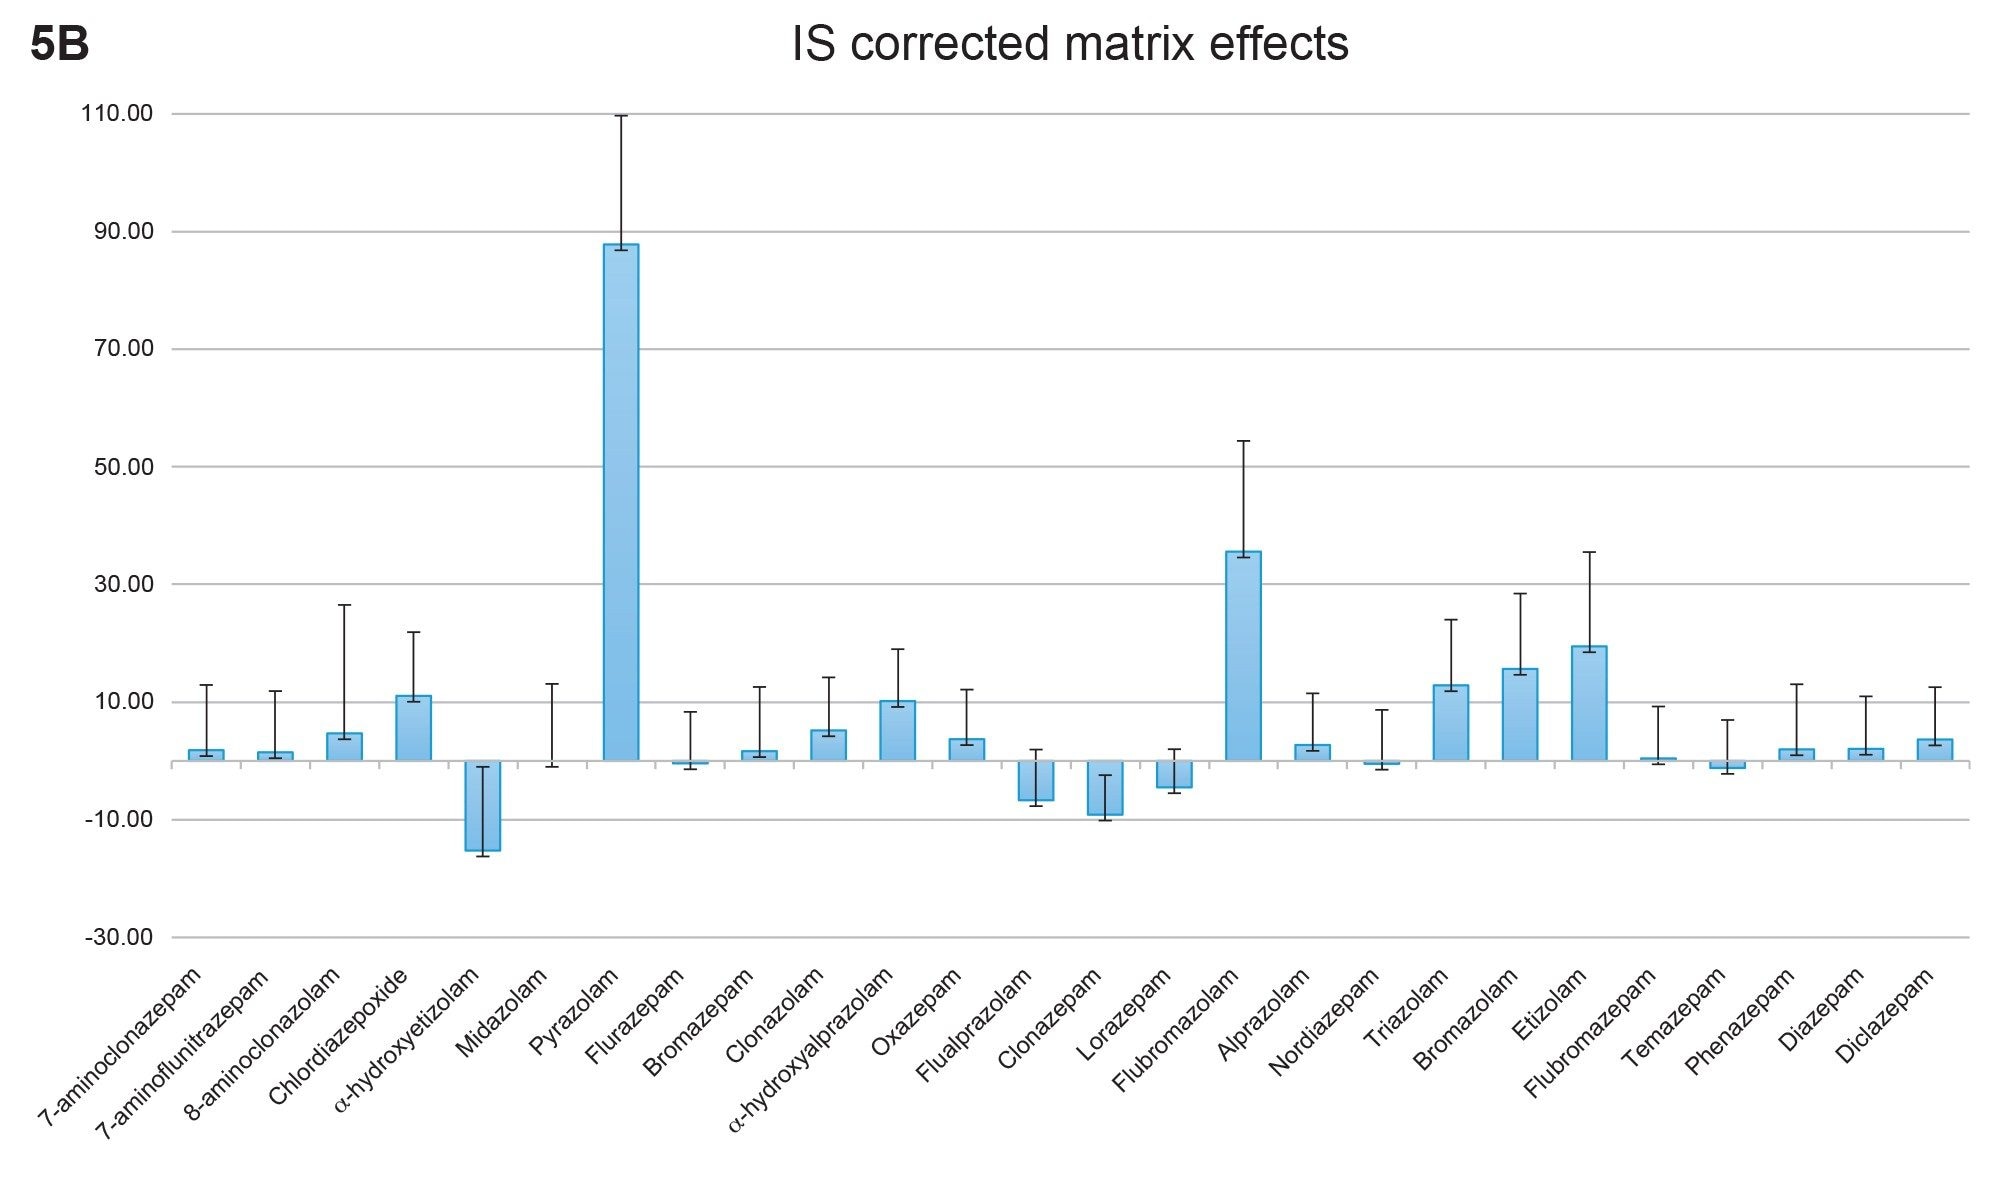 Figure 5B. Internal standard corrected matrix effects from six lots of urine. In this graph the matrix effects from figure 4A have been corrected using the internal standards. Of all the compounds, only two had standard deviations exceeding 20% and only two had corrected matrix effects greater than 20%.
Eight-point calibration curves were prepared and extracted across the concentration range 5 ng/mL to 1000 ng/mL, with the exception of 7-aminoclonazepam, 7-aminoflunitrazepam, 8-aminoclonazolam, flubromazolam and pyrazolam, which had seven-point calibration curves across the concentration range 10 ng/mL to 1000 ng/mL. Quality control samples were also prepared at 4 concentrations spanning the range of the calibrators. These QC levels were 15, 75, 200, and 750 ng/mL. Quantitative method validation consisted of extracting full calibration curves and QC samples over five different days. Calibration curves were extracted in duplicate and six replicates of the QC samples were prepared on each day. Calibrator samples were required to be within ±15% of the target value, other than the lowest calibrator which was required to be within ±20% of the target value. Similarly QC samples were required to be within ±15% of the expected value for all QCs, with the exception of the lowest QC level which was required to be within ±20% of the expected value. Analysis of the QC samples over five days of testing resulted in coefficients of variation (%CV) less than 15% and all were within ±15% of the nominal concentration, a summary is shown in Table 2. The majority of compounds were within 10% of their nominal value and had %CVs less than 10%.
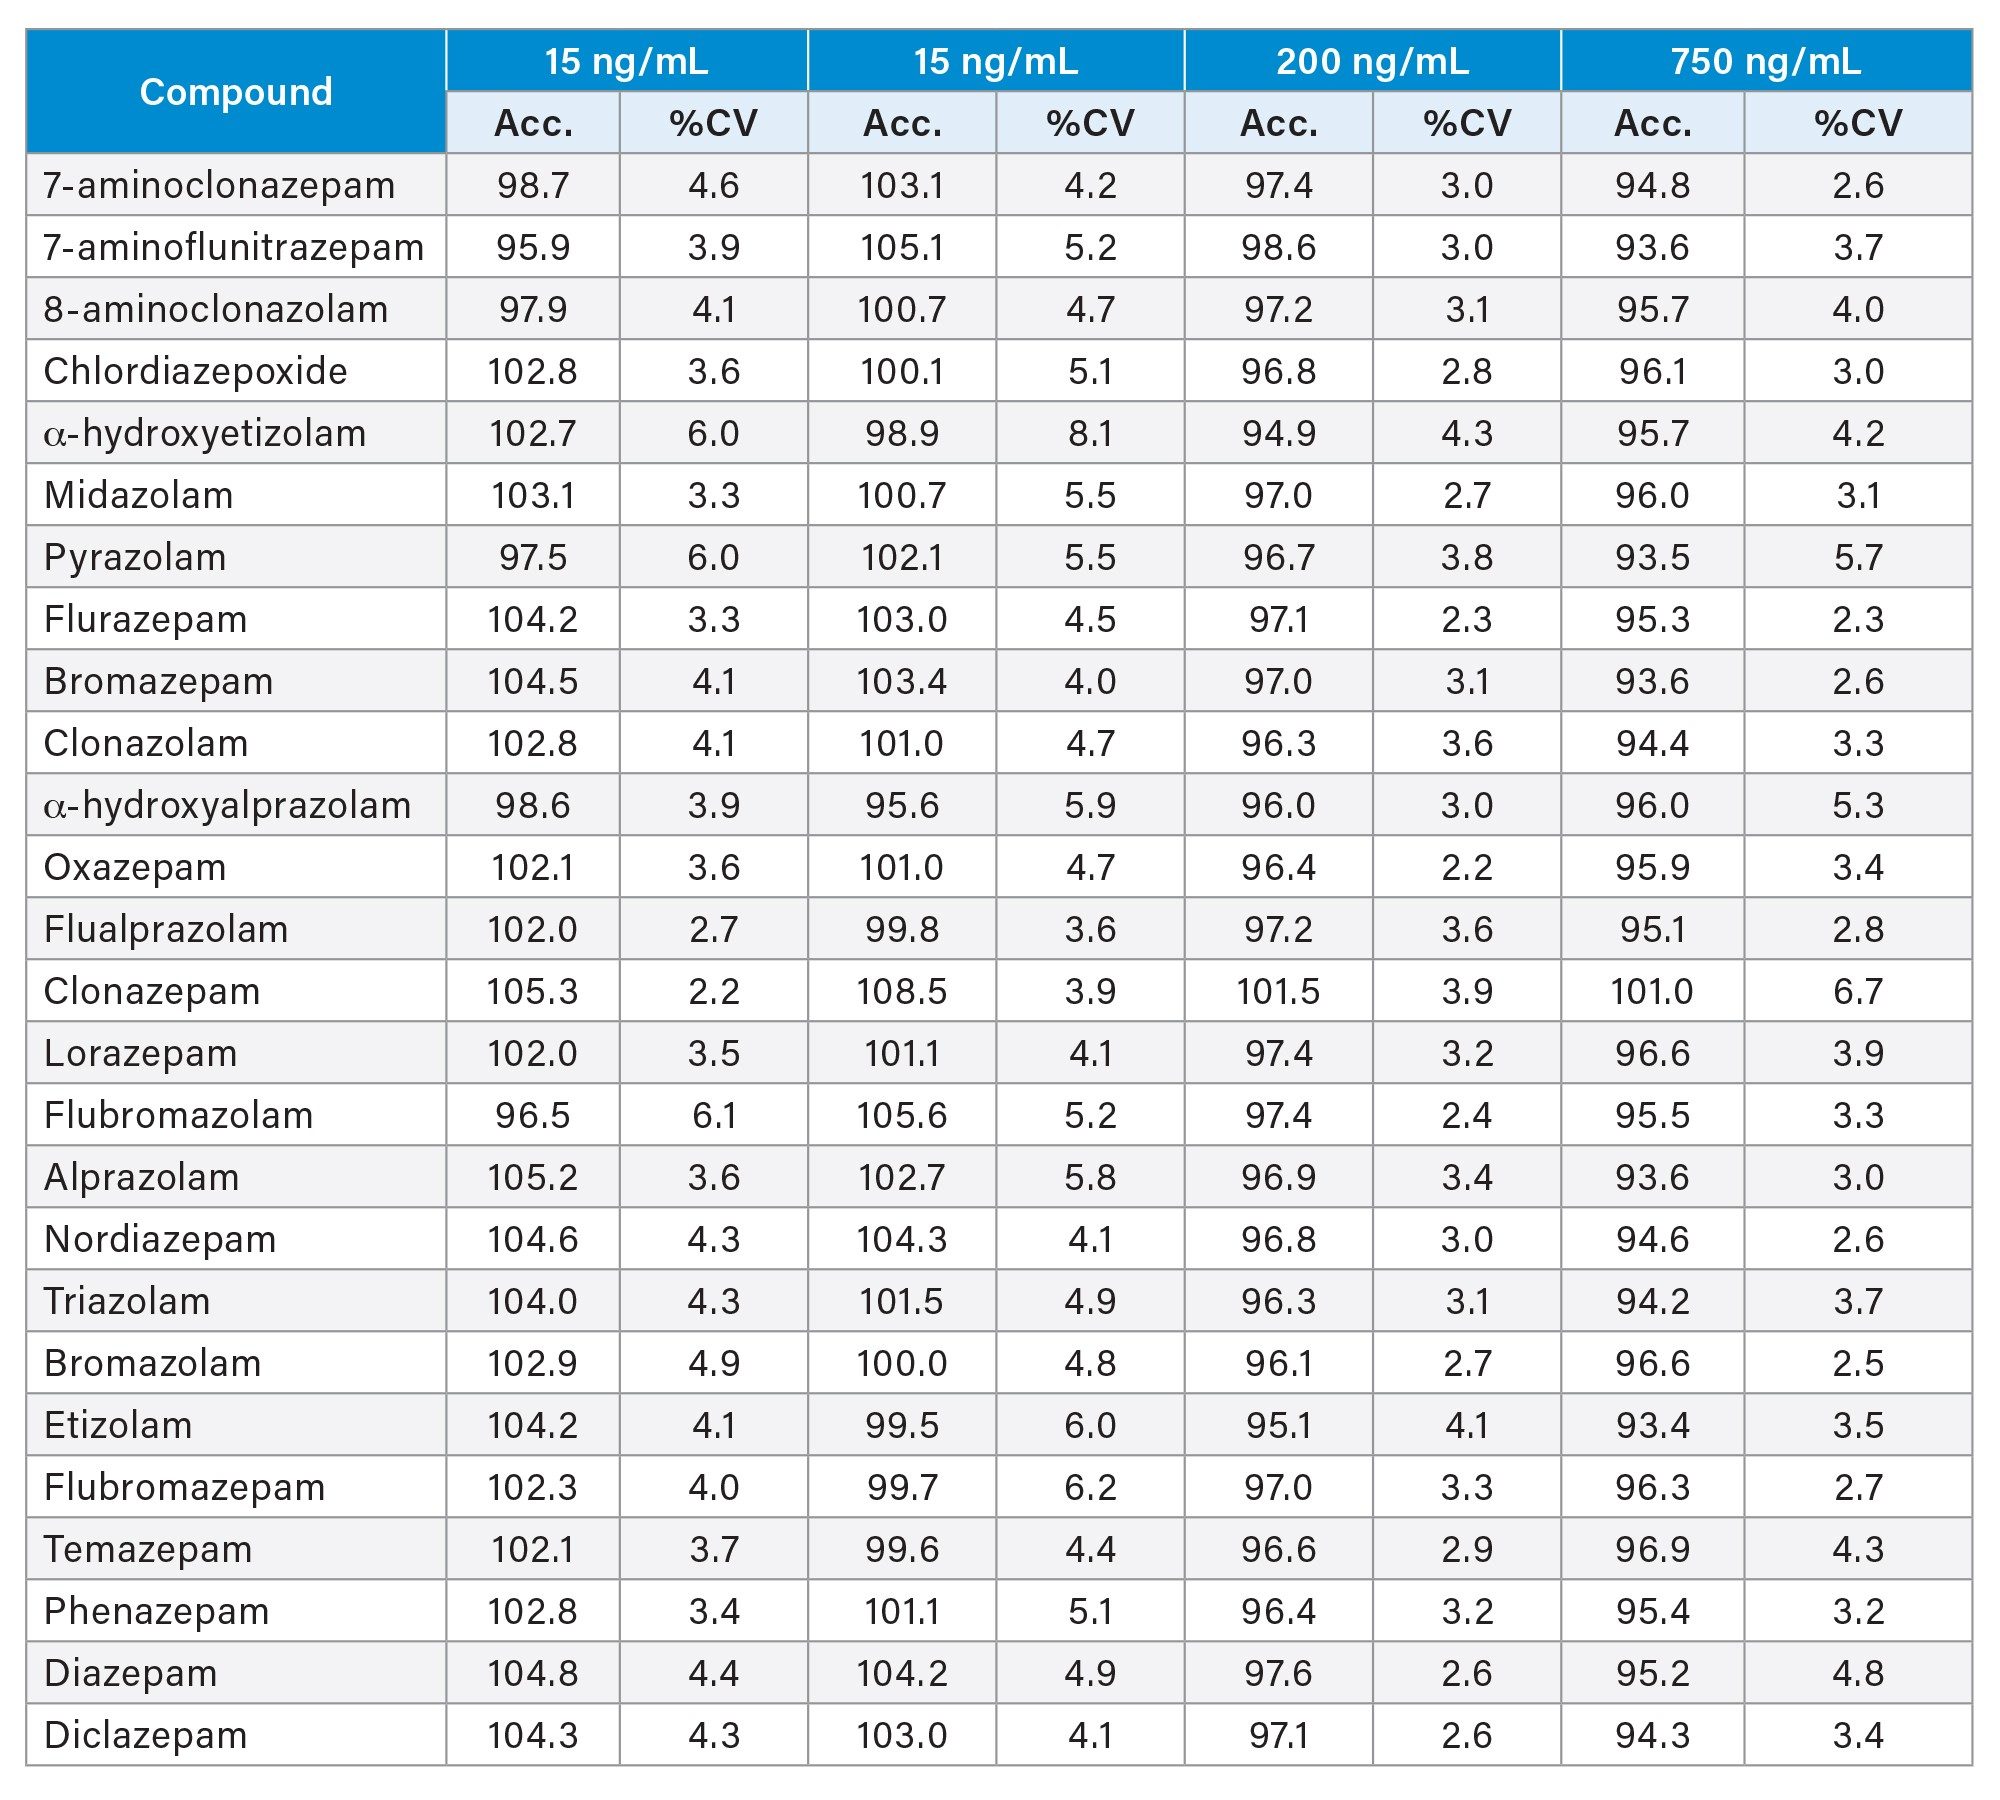 Table 2. Interday results for quality controls, which were blank urine samples spiked at four different concentrations (15, 75, 200, 750 ng/mL). Samples were analysed in replicates of six, over five days of testing.
Calibration curves were assessed to meet method validation requirements. All calibrators were within 15% of the target values, except for the lowest calibration point which was required to be within 20% of its target value, 75% of calibrators must meet these criteria. All compounds in the panel met these criteria, responses were quadratic (1/x weighting applied) with all R2 values of 0.990 or greater (Figure 6).
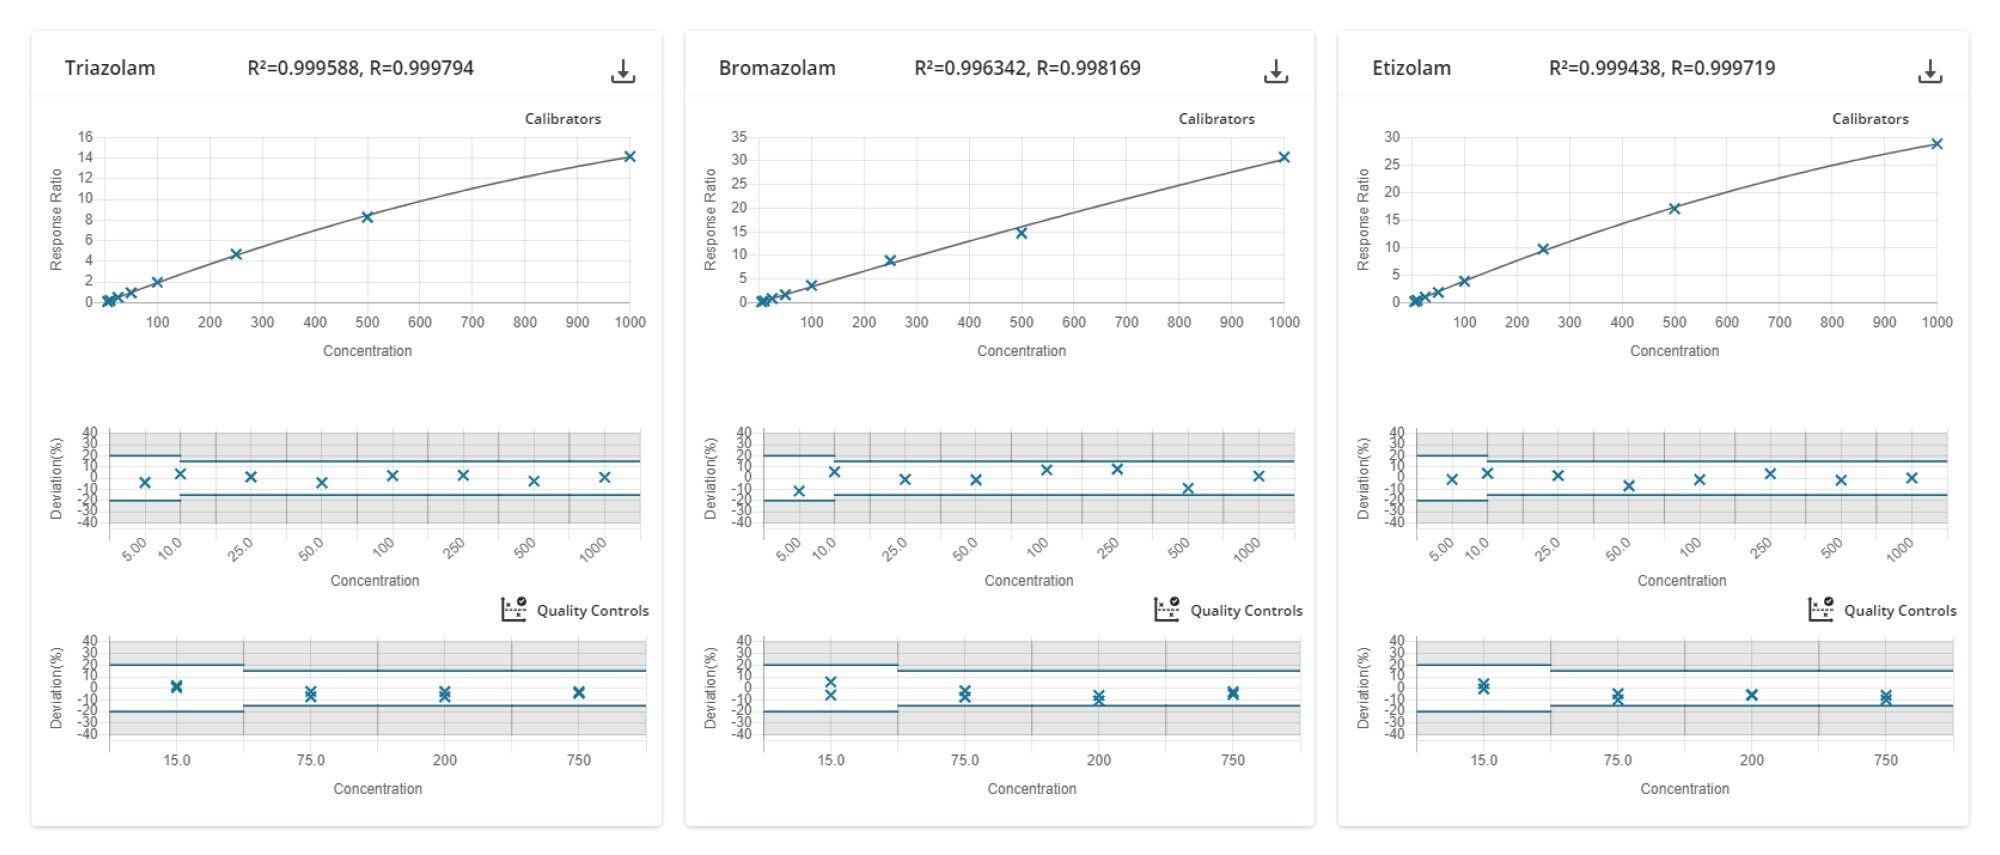 Figure 6. QUAN review Calibration and QC review window, compounds are shown on the screen in sets of three, in this example that is Triazolam, Bromazolam and Etizolam. Calibration curves are displayed with the R2 values, which were all greater then 0.99. Below plots show the acceptance criteria and the deviation from nominal value for the calibrator and QC samples, which were within 20% for the lowest calibrator and QC and 15% for all other samples.
Limits of quantitation were defined as 5 ng/mL for all compounds, with the exception of 7-aminoclonazepam, 7-aminoflunitrazepam, 8-aminoclonazolam, flubromazolam and pyrazolam where the limit of quantitation was defined as 10 ng/mL. These were the levels in which the signal was 5X greater than that of an extracted matrix blank, the signal to noise ratios were >10 and both bias and %CV were less than 20%. To evaluate this, ten replicates of the lowest calibrator were extracted in one of the validation batches.
In order to assess the accuracy of the method, external quality control samples from UTAK Laboratories were evaluated at multiple concentrations. Fourteen analytes were assessed using the external quality control samples including flurazepam, midazolam and triazolam. These results show that 20/28 (71%) of the results were within 20% of the target value, with 26/28 (93%) within 30% of the target value (Table 3). Samples were analyzed in replicates of ten and all results had %RSD values <5%. Method accuracy was further assessed with the evaluation of a proficiency test sample from Axio Proficiency Testing, LGC Group. Following analysis, the PT sample was found to contain both diazepam and nordiazepam with the performance scores for both analytes being deemed satisfactory ([z]≤2).
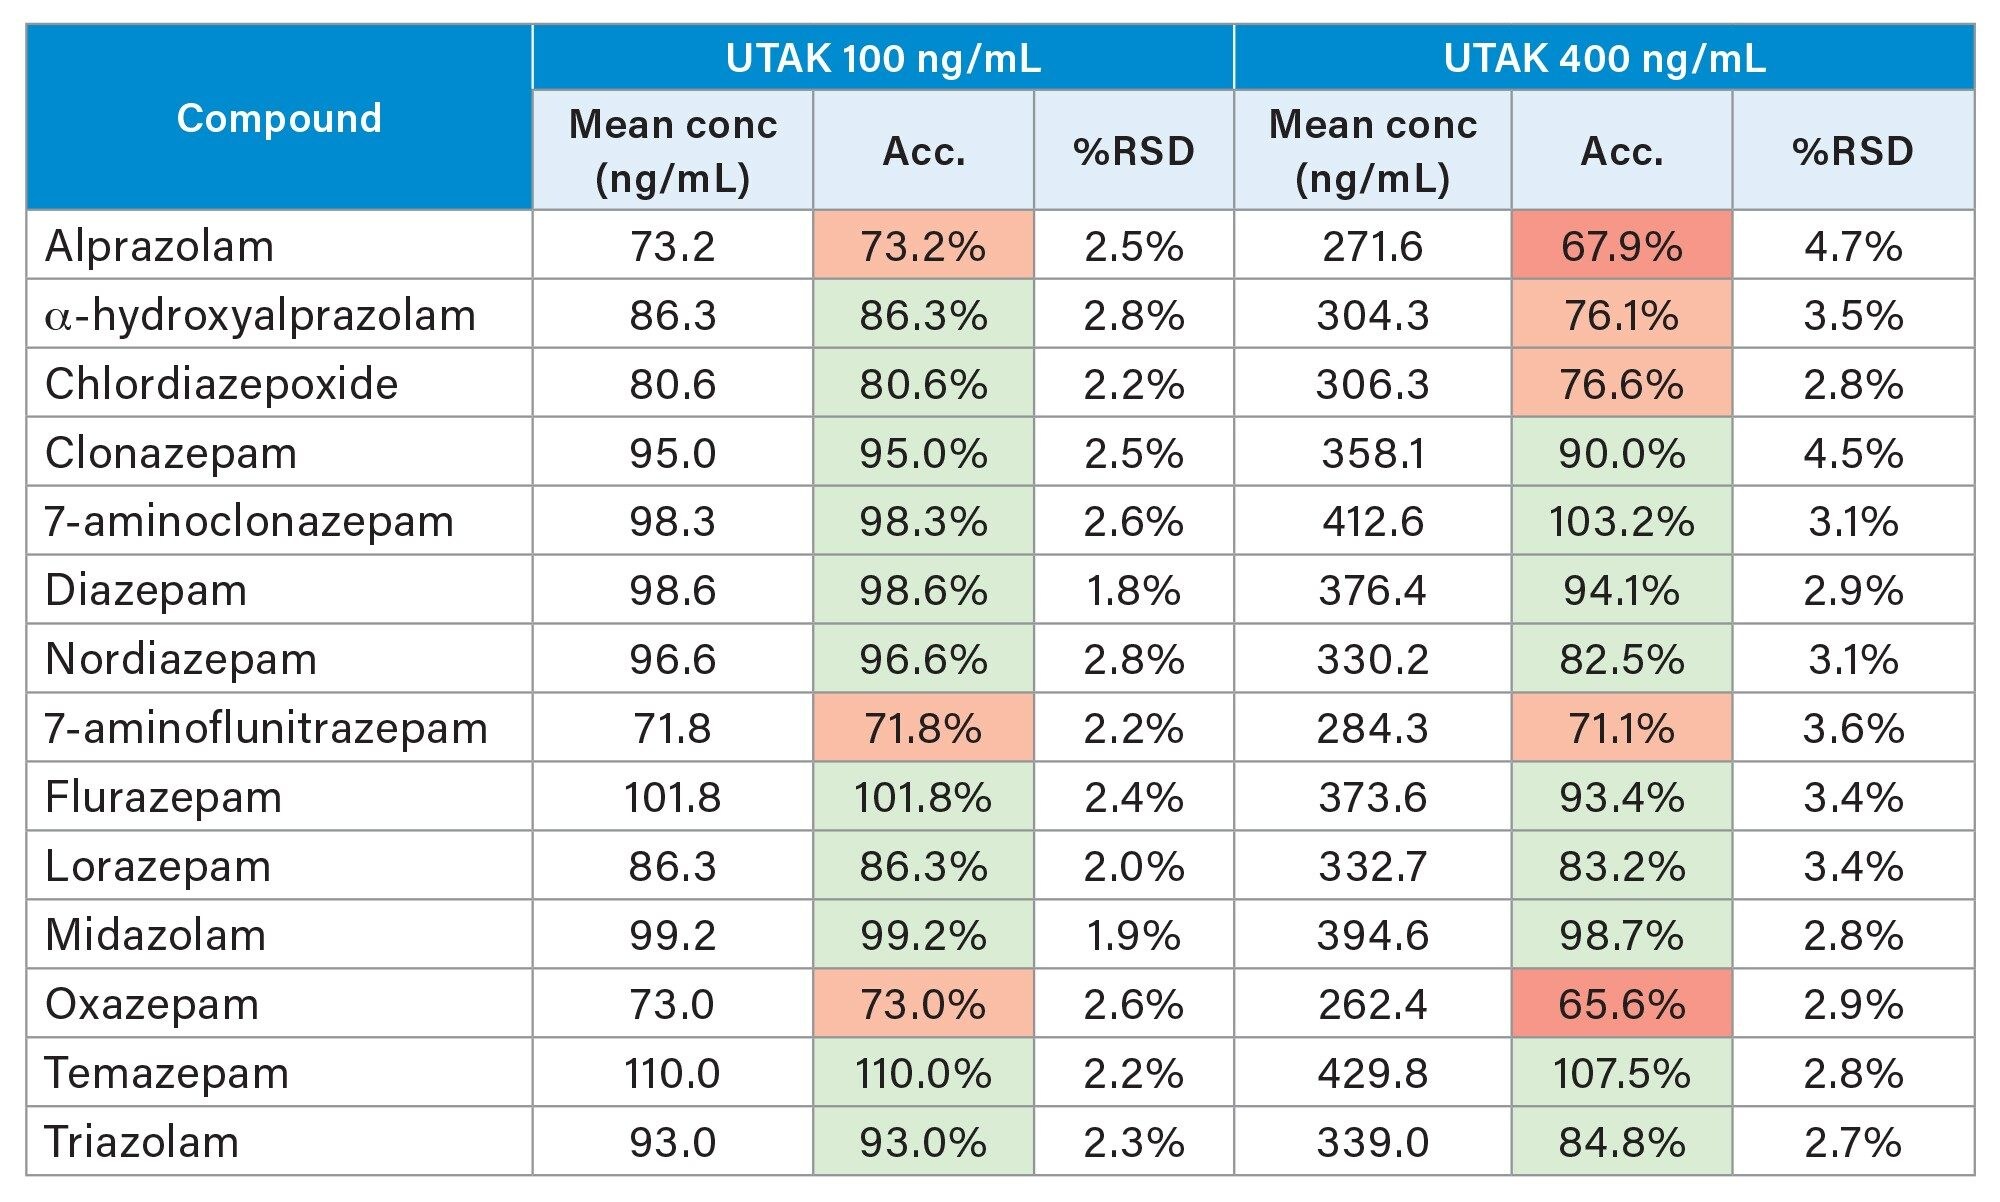 Table 3. Results from external quality control material at 2 concentrations. Each sample was analysed in replicates of four. Cells highlighted: in green indicate a bias value <20%, in orange indicate a bias value <30% and in red indicate a bias value >30%.
Conclusion
This application note describes a comprehensive clinical toxicology research method for the solid phase extraction and UHPLC-MS/MS analysis of a panel of 26 traditional and designer benzodiazepines, which has a number of advantages. The sample preparation method efficiently extracted all compounds included in the panel. The use of the ACQUITY UPLC BEH C18 Column results in rapid analysis (4 minutes) of a large panel of benzodiazepines. The Xevo TQ-S micro Mass Spectrometer ensures rapid and accurate quantitation of all compounds analyzed over a wide dynamic range. The combination of sample preparation method, UHPLC separation and MS/MS detections results in a rapid, accurate and precise method for the comprehensive analysis of benzodiazepines in urine, including new designer benzodiazepines.
References
- Brunetti, et al. Designer Benzodiazepines: A Review of Toxicology and Public Health Risks. Pharmaceuticals. 14:560, 2021.
- European Monitoring Centre for Drugs and Drug addiction (2021). New benzodiazepines in Europe – a review (June 2021).
- Danaceau, J.P., Freeto, S., Calton, L.J. A Comprehensive Method for the Analysis of Pain Management Drugs and Drugs of Abuse Incorporating Simplified, Rapid Mixed-Mode SPE with UPLC-MS/MS for Forensic Toxicology. Waters Application Note. 720006187. 2019.
Appendix
720008633, December 2024