• Application Note

LC-MS/MS Determination of Nitrofuran Metabolite Residues in Honey

LC-MS/MS Determination of Nitrofuran Metabolite Residues in Honey

  • Kevin M. Jenkins
  • Michael S. Young
  • Waters Corporation

Abstract

This application note describes an LC-MS/MS method for the quantification of nitrofuran metabolite residues (AOZ, AMOZ, 1-Aminohydantion(AH), Semicarbizide (SC)) in commercially available honey. 

Introduction

Apiculture relies on antibiotics to prevent disease propagating through the densely populated bee colonies. The overuse of antibiotics in honey bee colonies can cause high levels of residues in honey products, which becomes a public health issue. Additionally, bacteria that have developed resistance to the applied antibiotics can pose an increased threat to both human and animal health. Consequently, antibiotics become less effective against bacteria and there will be fewer alternatives available for the successful treatment of infection. Unscrupulous producers search for these alternative antibiotics such as nitrofurans to treat disease.

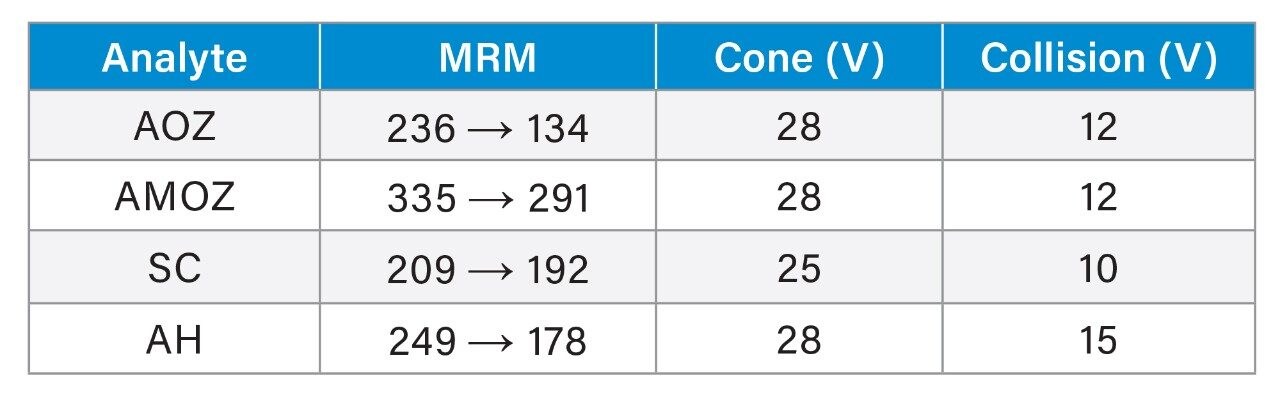
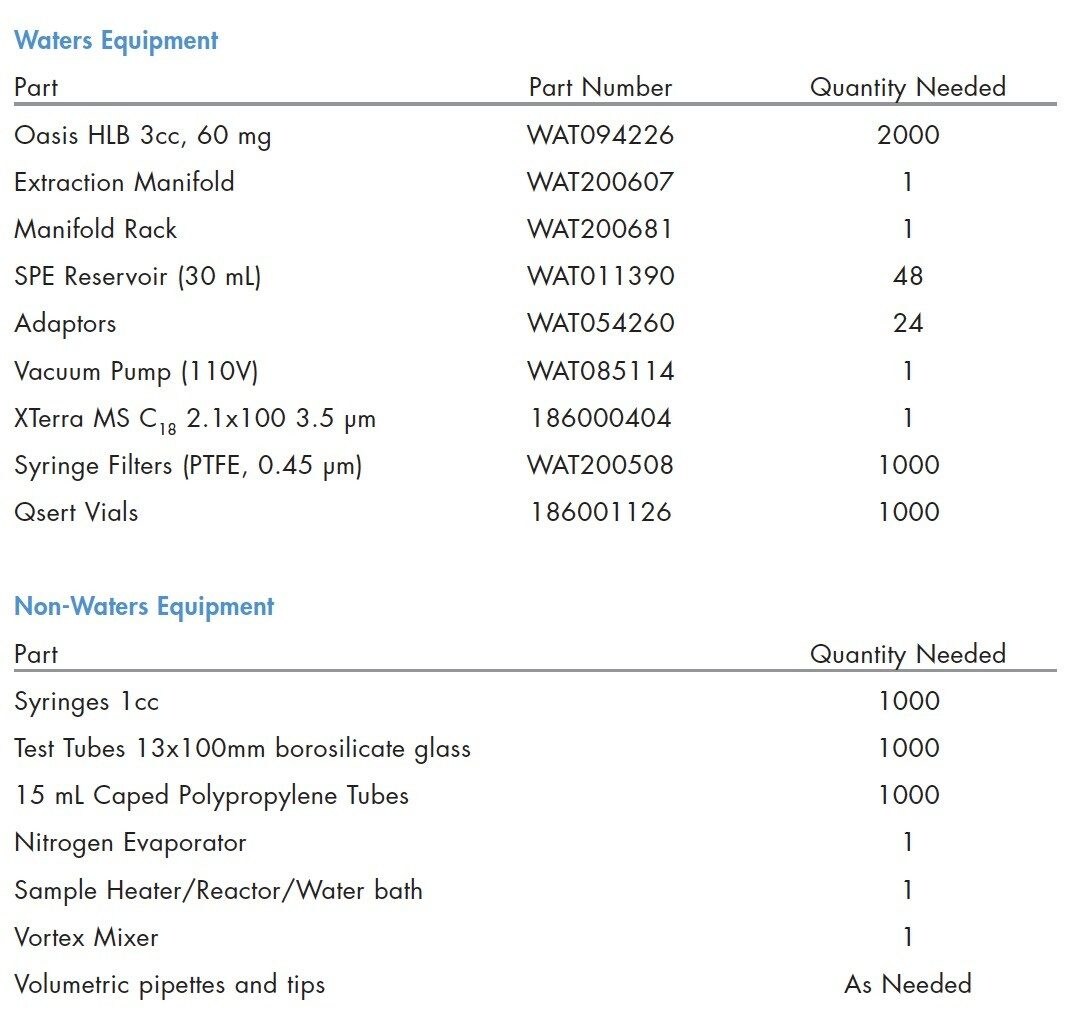
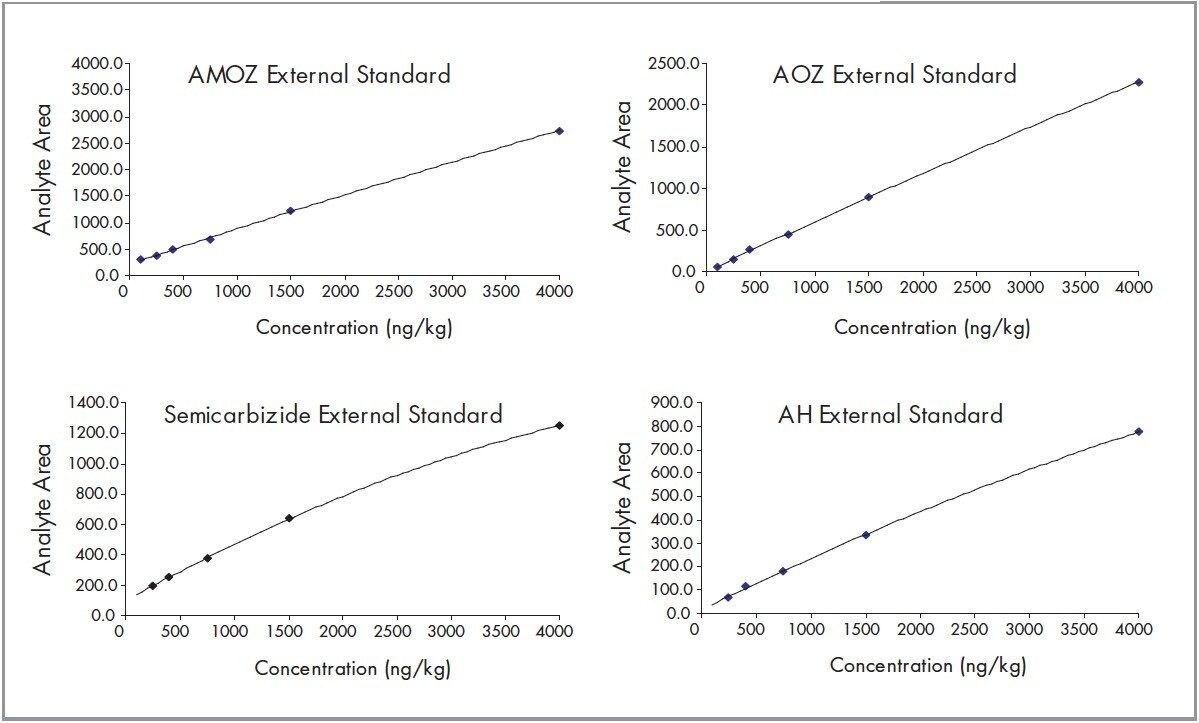
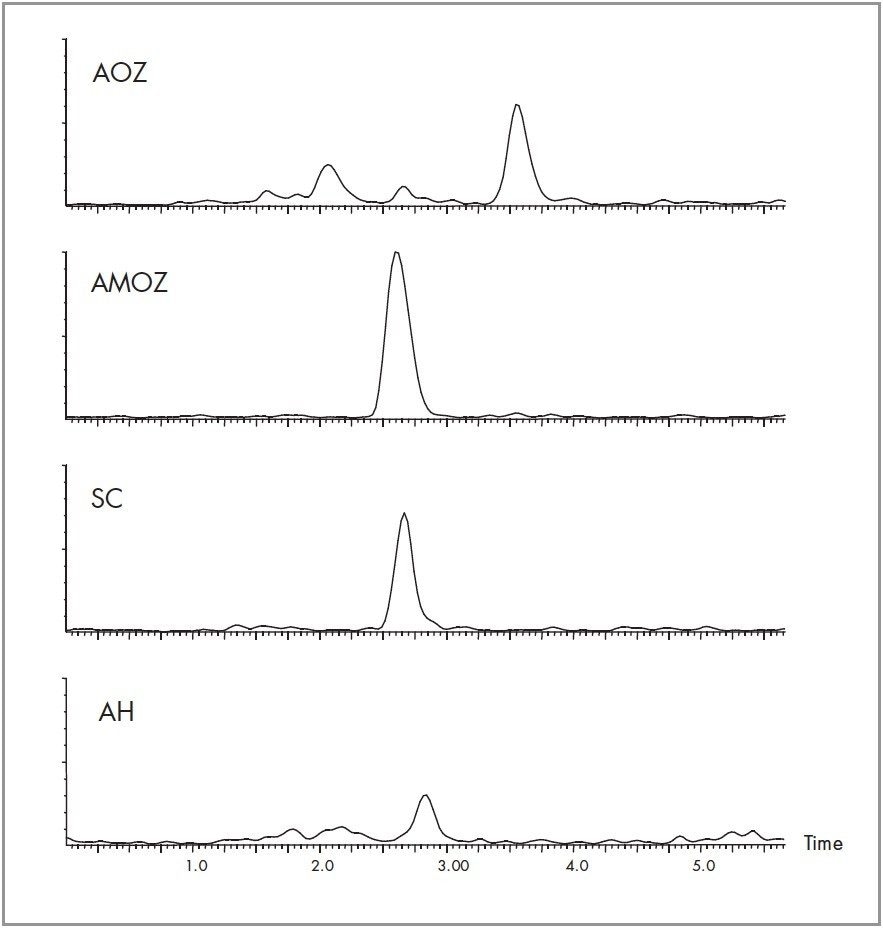
Nitrofuran antibiotics metabolize rapidly with an in vivo half-life in the order of hours, making parent drug detection ineffective. An LC-MS/MS method is described for the quantification of nitrofuran metabolite residues (AOZ, AMOZ, 1-Aminohydantion(AH), Semicarbizide (SC)) in commercially available honey. The metabolite residues were extracted from the honey samples by first dissolving the honey in HCl. The samples were cleaned, derivatized and then enriched using Oasis HLB solid phase extraction devices. The metabolite residues were resolved chromatographically using a XTerra MS C18 analytical Column. Positive ion electrospray mass spectrometry was used to quantify and confirm the parent ion [M+H]+ and fragments for each target analyte.

Experimental

Preparation of Honey Samples

The honey samples were prepared for analysis using a two step SPE process (Figure 1). The first step provides a simple pass through clean-up to fractionate the analytes from the bulk of the matrix. This dramatically improves the subsequent derivitazation procedure. The second SPE protocol provides additional clean-up as well as providing a sample enrichment factor of 10 to1 (2g Honey into 200 μL).

Figure 1. SPE Protocol Summary.
SPE Step 1 removes polyphenolic constituents, waxes, and organic contaminants. The sugars and the underivatized nitrofuran metabolites pass through the cartridge. This cartridge is discarded. The sugars are removed post derivatization in SPE Step 2 before the final SPE elution of the derivatized nitrofuran metabolites.

A 2 g sample of honey was diluted with 5 mL of 0.12 M HCl and prepared using the procedure outlined in Figure 1. The eluent was quantitatively collected and 300 μL of 50 mM 2-nitrobenzaldehyde in DMSO is added for derivitization. The sample was hydrolyzed and derivatized for 18 hours at 37 °C. The sample was cooled to room temperature and adjusted to pH 7 by addition of 6 mL of 0.1 M K2HPO4 prior to SPE Step 2.

HPLC Conditions

Instrument:

Alliance 2695 Separations Module

Column:

Xterra MS C18, 3.5 μm, 2.1 x 100 mm

Part number:

186000404

Flow rate:

0.20 mL/min

Mobile phase:

Isocratic 70% 20 mM ammonium formate pH 4.0, 30% ACN

Inj.volume:

20.0 μL

Temperature:

30 °C

MS Conditions

Instrument:

Waters Micromass Quattro micro

Interface:

Positive Electrospray (ESI+)

Optics:

Capillary - 2.9kV

Extractor - 4V

RF Lens - 0.1V

Source Block Temperature - 150 °C

Desolvation Temperature - 350 °C

MRM Parameters

Materials

The part listing is based on the analysis of 1000 honey samples and does not include the reagents.

Results and Discussion

Figure 2. Representative calibration curves spiked into blank honey. Note: Suitable deuterated internal standards were not available at the time of this study. The resulting non-linear calibration curves for SC and AH were fit to a quadratic function.
Figure 3. Left Side Column (SPE Step 1): The column on the left shows the retained matrix resulting from the initial sample pass-through. This column is discarded and the passed-through sample is then derivatized. Right Side Column (SPE Step 2): The column on the right shows the sample clean-up after the final analyte elution.
Figure 4. Representative chromatograms of a 400 ng/Kg spiked honey sample.
Table 1. Relative standard deviation obtained from two different lots of honey spiked at 500 ng/kg (ppt). Sample 1 is raw wild flower honey and Sample 2 is buckwheat honey, both commercially available. Metabolite recovery was greater than 85% postderivatization for each analyte. The blanks used for spiking tested negative before the study.

Conclusion

The SPE protocol described in this paper provides sample enrichment and cleanup acceptable for the routine determination of nitrofuran metabolites in honey. Results obtained from fortified honey samples indicate that the limit of quantification (LOQ) was below 300 ng/kg.

Sample derivatization is necessary for chromatographic retention for the small, polar nitrofuran metabolites. Unfortunately, derivatization in the presence of unwanted matrix reduces the reaction efficiency and may increase matrix side-reactions that can interfere with the LC analysis. The two-step SPE procedure described in this method was optimized to minimize the matrix effects prior to derivatization. This procedure reduced the undesirable matrix interferences while minimizing the amount of derivatization reagent required to achieve a successful reaction.

References

Determination of Nitrofuran Veterinary Drug Residues Using Waters Micromass Quattro Premier: Tandem Mass Spectrometer, Waters Application Note 720000847EN.

A Method for the Determination of Nitrofuran Veterinary Drug Residues by LC/MS/MS, Waters Application Note 720000705EN.

Featured Products

720001034, January 2004

Back To Top Back To Top