Sugars are renowned for their sweet taste and are often added to manufactured foods to enhance human perception of flavor. Due to the negative health effects of excessive consumption of sugar, alternative non-nutritive sweeteners are commonly used in food and beverage products. Examples include soft drinks, table-top sweeteners, chocolates, dairy products, and many other so-called “diet” foods. In many cases it is a combination of various sweeteners that are used to impart overall sweetness to these products.
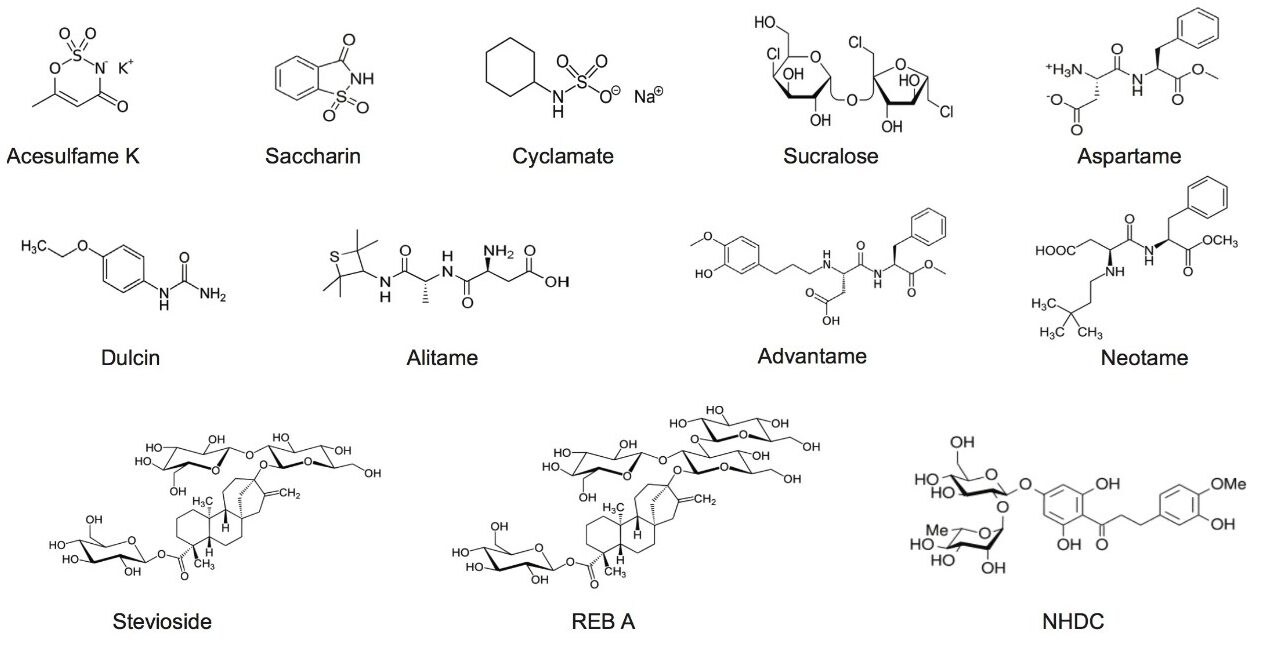
Aspartame, saccharin, acesulfame-K, neotame, and sucralose are approved artificial sweeteners by the U.S. Food and Drug Administration (FDA).1 Compounds such as rebaudioside A and stevioside, which originated from the South American Stevia plant, are also becoming more popular in the United States. In 2010, the European Food Safety Authority (EFSA), approved the use of stevioside as a sweetener.
The European Union (EU) Directive 94/35/EC, along with four amendments: 96/83/EC, 2003/115/EC, 2006/52/EC and 2009/163/EU, restrict the level of sweeteners in specific types of food. The EU Commission Regulation 1129/2011 lists the maximum level of the sweeteners permissible in various food products. Hence the determination of the amount of these sweeteners in foods is also important in order to ensure consistency in product quality.
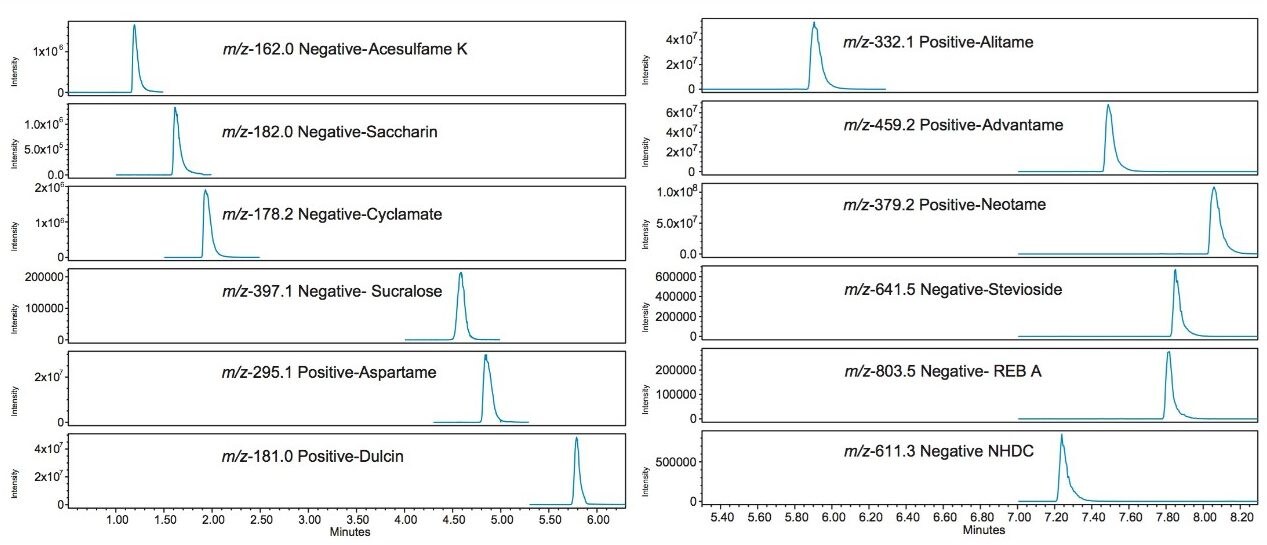
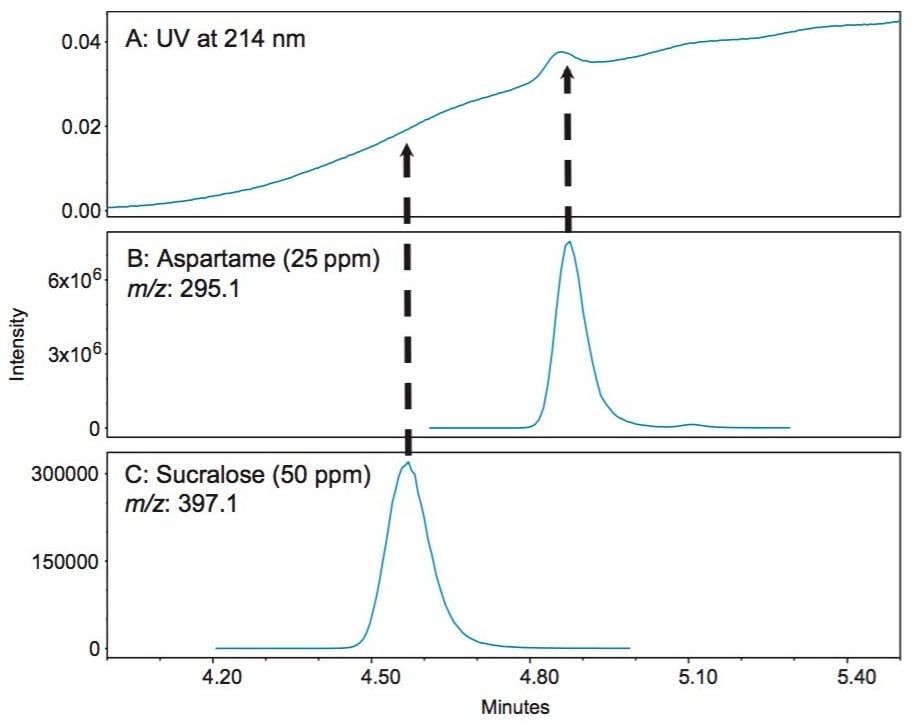
The most common method for the detection of sweeteners is HPLC coupled to a UV detector. This configuration enables the detection of some sweeteners such as acesulfame-K, aspartame, saccharin, and neotame. However cyclamate and sucralose cannot be analyzed by UV because they lack chromophores. The ability to analyze all of these sweeteners using a single method with mass detection would be ideal. Waters has developed the ACQUITY QDa Mass Detector to allow food and beverage scientists to incorporate mass detection into their existing chromatographic workflows.
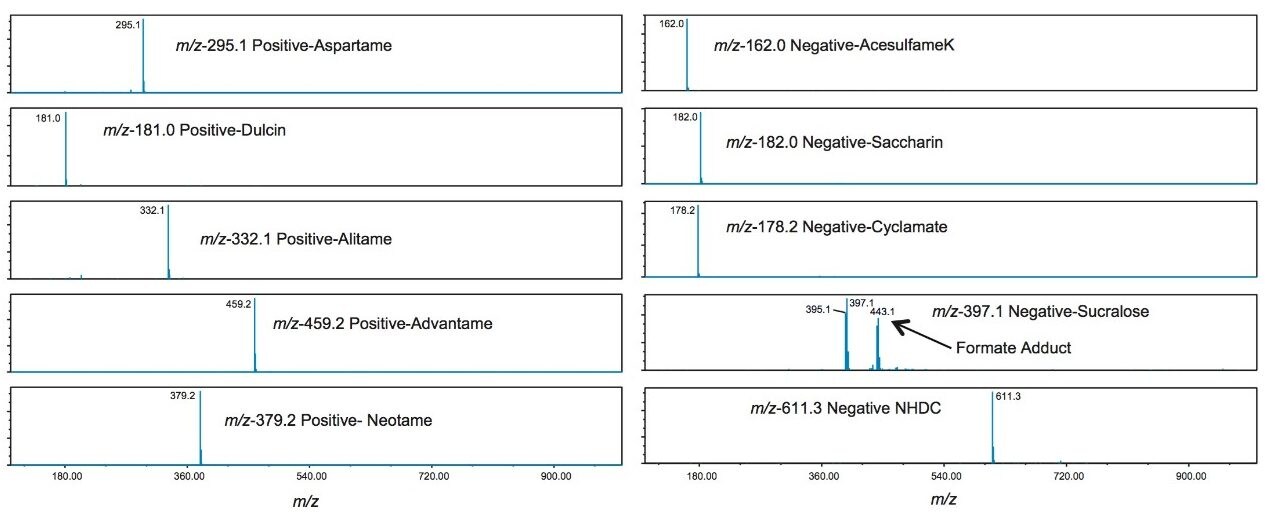
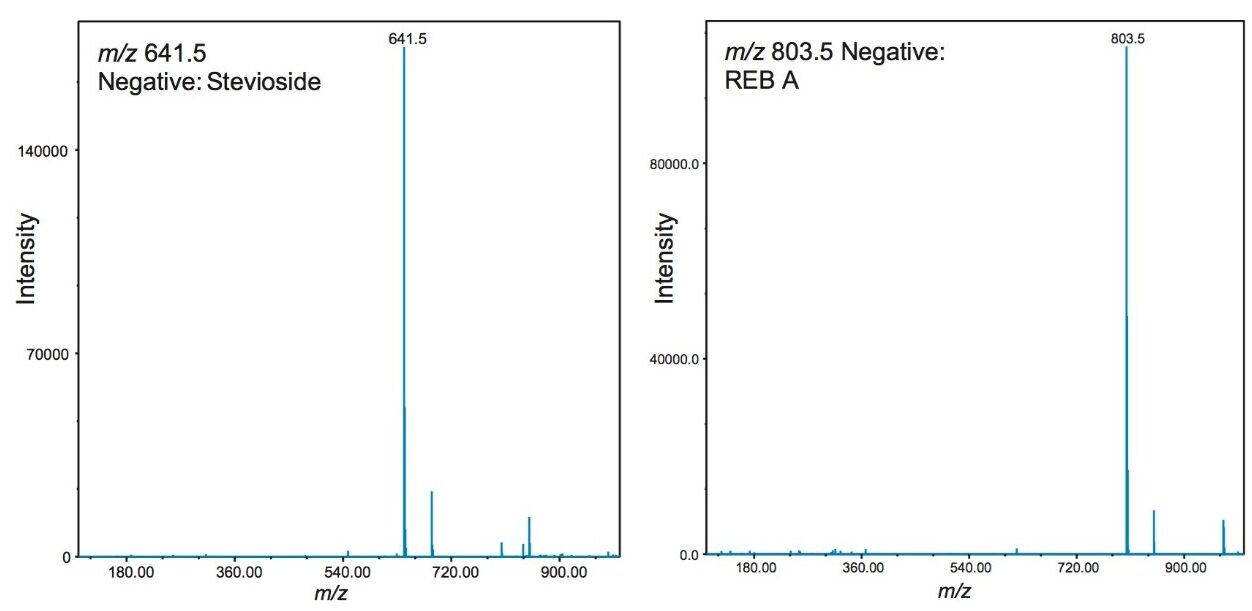
The ACQUITY QDa not only allows for the detection of all sweeteners in a single run, but also brings improved discrimination to the analysis, thereby eliminating the requirement of baseline separation of all compounds. The combination of Waters ACQUITY Arc System with the ACQUITY QDa Mass Detector is extremely beneficial for food and beverage manufacturers for the identification and quantification of sweeteners in their products using a single analysis method.
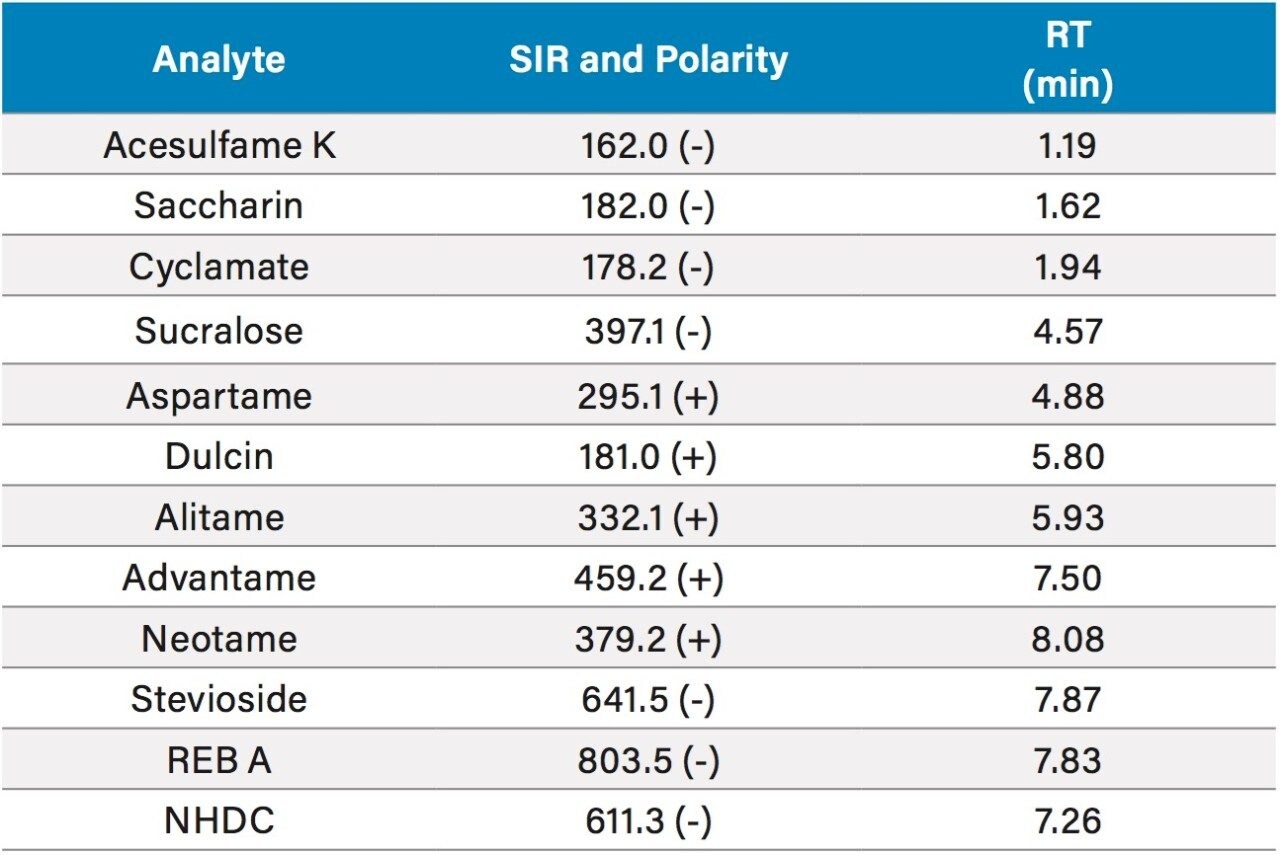
In this application note, a fast, reliable and sensitive method was developed to analyze sweeteners in food and beverage samples.