Comprehensive APC 2D Analysis of an Eight Component Polymer Blend
Abstract
Separation of a blend consisting of eight components that either have a similar or same chemistry or molecular weight might not be achievable with a single technique. Co-elution of some kind is a common cause when dealing with incomplete separation. The combination of multiple techniques improves separation efficiency.
Benefits
2D chromatography combines two independent separation techniques into a single analysis. In the first dimension, a gradient based separation can be applied for separating the analyte by chemistry. The second dimension consists of traditional or ideally high-resolution GPC to separate the individual analyte fractions from the first dimension by hydrodynamic volume. By combining both dimensions, the separation power can be improved significantly. Putting the HPLC type separation in the first dimension is beneficial when it comes to sample load. A higher load is required upfront, so that the analyte concentration of the fractions entering the second dimension is not too dilute for the detector in the second-dimension to detect.
Introduction
High-resolution and advanced separation techniques can be applied anywhere not only in the polymer industry but also more widely in the chemical and materials industry. Research and development focused on polymer applications in modern materials science has veered a long way away from bulk linear polymers such as polystyrene or polyethylene. Depending on the application in an increasingly complex environment, simple polymers alone no longer meet modern day demands. As research and development starts to explore multifunctional and different polymer architectures such as block copolymers, grafted polymers, dendrimitic architectures, amphiphilic material, etc. or more complex blends, standard GPC or LC individually does not always reveal enough or only incomplete information about the polymers, their structure and predicted properties.
The limitations of standard GPC or LC individually has moved multidimensional or 2D chromatography into the spotlight of the more advance techniques becoming ever more prevalent in the recent years.
From an instrumental perspective, 2D chromatography essentially consists of two individual separation systems that are connected by an 8-port valve with two identical sample loops as can be seen in Figure 1. While one loop is filled with the effluent of the first separating system, the second-dimension pump is flushing the other loop content onto the separating column of the second separation dimension. With the software switching between both loops, the entire effluent of the first-dimension separation is analyzed in the second-dimension column.
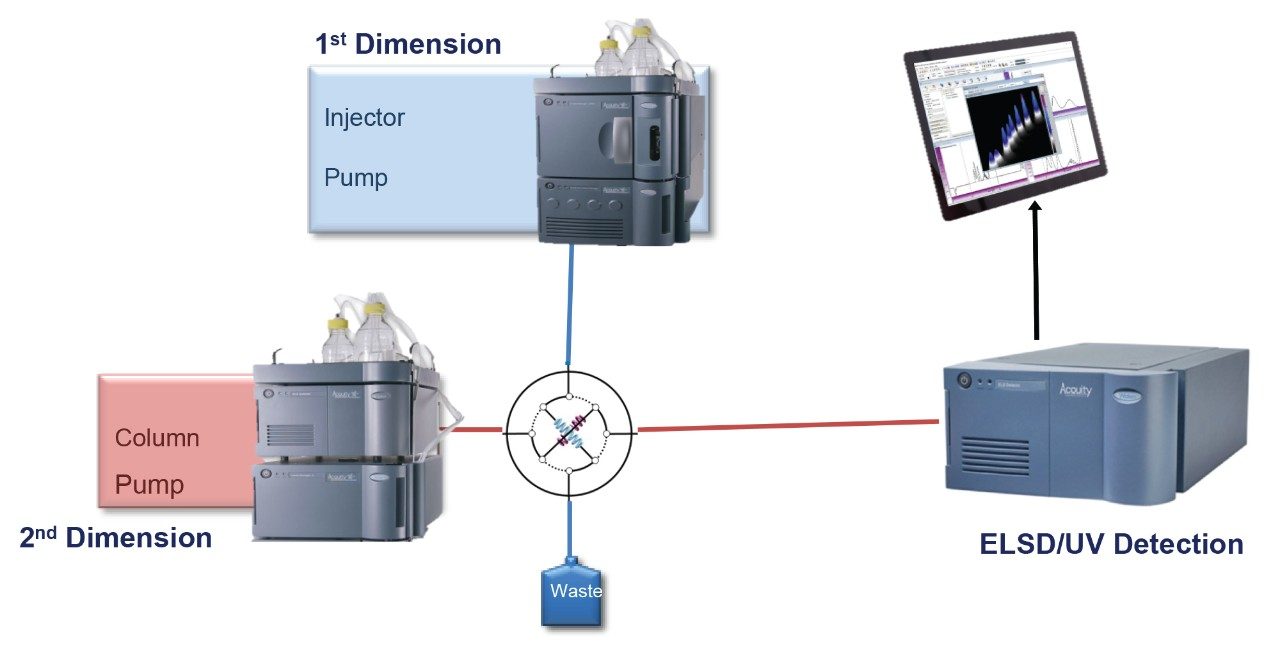 Figure 1. Schematic of instrumental set-up.
Experimental
Conditions
1st Dimension:
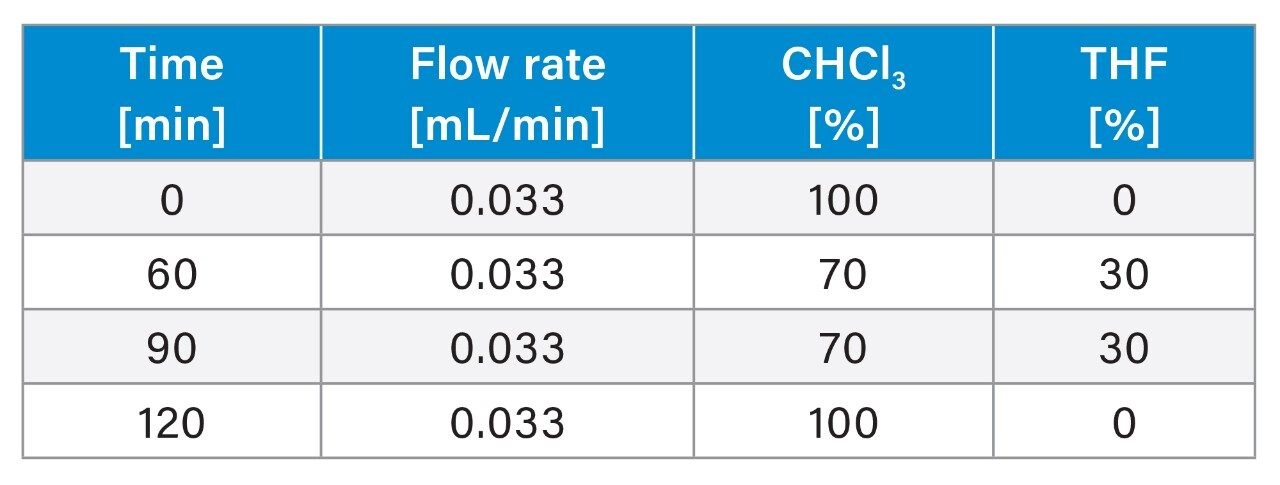
Table 1. 1st dimension gradient table.
2nd dimension:
|
ELSD: |
Gain: 5 |
|
Drift tube: |
50C |
|
Heating: |
75% |
|
TUV: |
254 nm |
|
Column: |
M&N Nucleodur 100-5 (4.6 x 250 mm) |
The total separation has been completed in around 2 hours.
Results and Discussion
The first step in developing a 2D method for a polymer blend consisting of 8 PS (1240k, 130k, 19.7k, 1306 Da) and PMMA (988k, 202k, 18.7k, 2380 Da) samples, is running both dimensions individually to learn how many peaks appear and where they elute. Since the system was set up with ELSD and UV detectors, both detector traces were collected to identify differences in the chromatogram that result from different selectivities as can be seen in Figure 2. Interdetector delay was corrected for in the software.
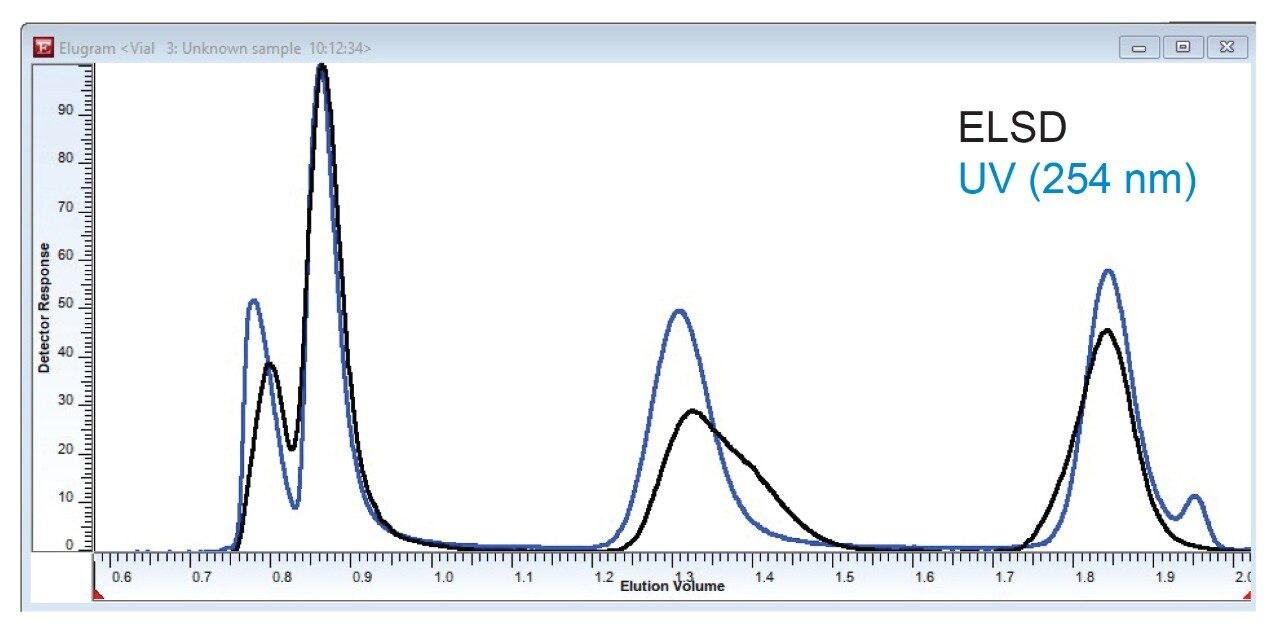 Figure 2. Overlaid ELSD and UV trace of the PS/PMMA polymer blend from the GPC run.
Both detectors detected three baseline separated fractions with slightly differing peak shape. There are 4–5 peaks detected depending on mode of detection in the GPC run, some with irregular peak shape. The ELSD trace (black trace) exhibited a shoulder in the peak eluting at 1.2 mL elution volume which is not present in the UV trace (blue trace). The UV detector revealed an additional small peak that did not appear in the ELSD trace. These differences indicate the presence of chemically different structures.
Subsequently, a gradient separation from CHCl3 to THF was conducted with the same detection. The overlaid chromatograms for both detectors are shown in Figure 3. Just as in Figure 2, three main, baseline-separated fractions were detected. At low elution volumes, both detector traces differ only slightly. The peak eluting at 1.5 mL elution volume exhibits an additional small peak that does not show in the ELSD trace (black trace). The ELSD signal revealed a peak at 4.3 mL which is not seen in the UV trace (blue trace). Neither one of the two separations are capable to resolve all eight components in the mixture. Co-elution is a plausible cause for this occurrence.
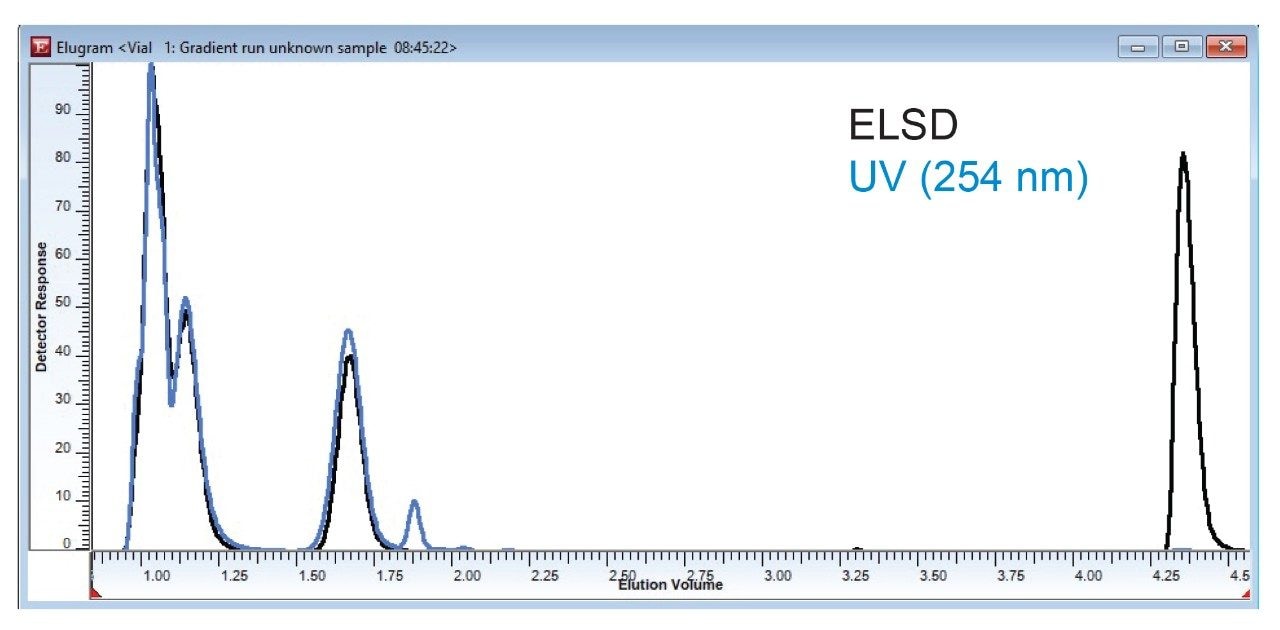 Figure 3. Overlaid ELSD and UV trace of the PS/PMMA polymer blend from the gradient run.
For the 2-dimensional run, one sample injection is undergoing a gradient-based separation followed by a subsequent separation of each eluting fraction in isocratic GPC-mode. The results are plotted in a contour plot established in WinGPC from Polymer Standards Service. As can be seen in Figure 4, the elution volume of the gradient separation is plotted on the y-axis and the elution volume of the GPC run on the x-axis. The color indicates the abundance of a fraction. Next to the y-axis and x-axis, the reconstructed detector traces of the individual separations are depicted as reference.
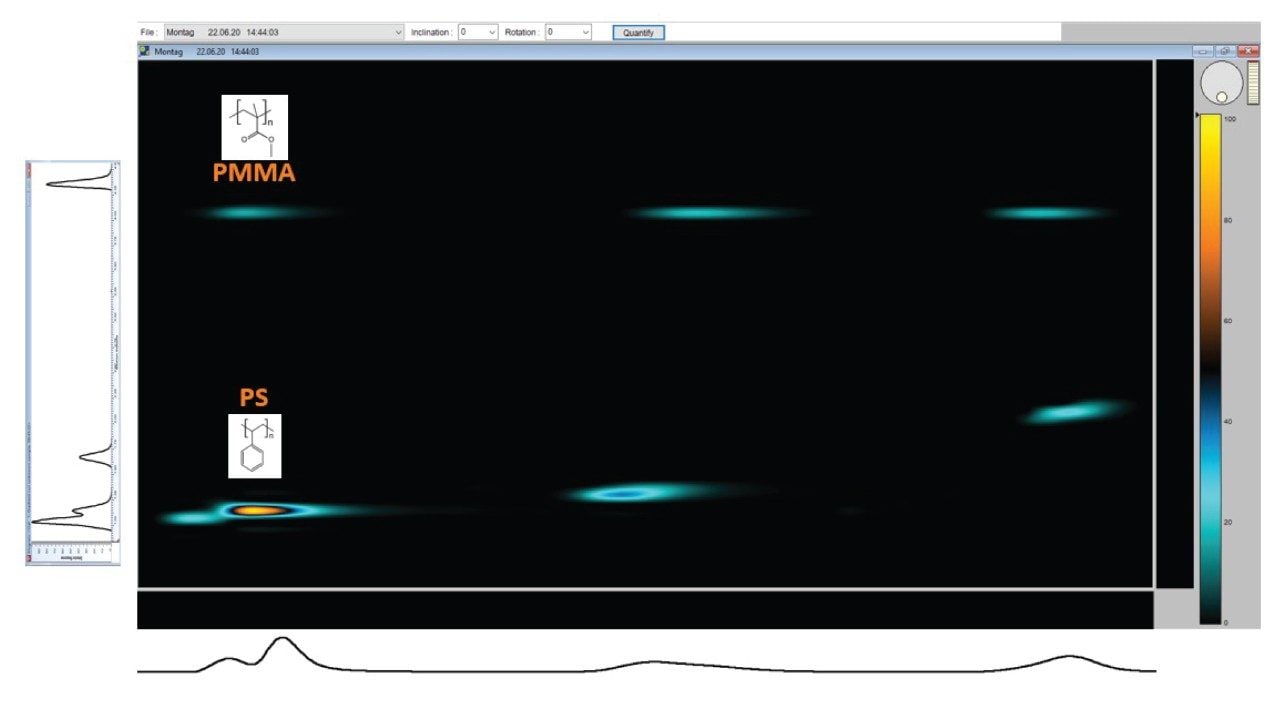 Figure 4. Contour plot of the 8-component blend.
The vertically aligned fractions denote fractions of identical hydrodynamic size, which coelute in GPC. Thus, the separation along the vertical axis is achieved based on differences in the chemical structure. There is excellent separation between the two chemistries. The horizontally aligned fractions are separated by size. Three distinctive sizes were separated from one another. As the PMMA samples have the same elution volume along the y-axis, they remained unseparated in the gradient separation. Some separation amongst the PS samples occurred in the gradient separation, indicating a slight molecular weight influence occurring during the gradient separation. The fourth PMMA sample did not get separated due to the separation range of the BEH XT Column.
Conclusion
The contour plot proves that co-elution occurred in both individual dimensions. By combining separations by chemistry and by size the separation capability increased, so that seven peaks instead of four to five peaks could be separated.
Featured Products
720007355, September 2021