HPLC Analysis of Soft Drinks Using Alliance™ iS HPLC System
Abstract
Soft drinks often contain a key ingredient, such as caffeine, and one or more additives, such as benzoate or sorbate (as preservatives), and/or acesulfame K, saccharin, or aspartame (as artificial sweeteners). Aspartame is prone to degradation once in solution. Its degradation products could interfere with the quantification of other additives. In this study an Alliance iS HPLC System was employed for the analysis of these additives. The method successfully resolved all additives and aspartame degradation products with a critical pair resolution of 2.3. Furthermore, the method showed excellent linearity for the six additives across a broad range of injection volumes (0.2–20 µL) with a remarkable %RSD exceeding 0.9999 in six replicate injections. The instrument’s precision in delivering injection volumes was beneficial for accurately quantifying caffeine aspartame and benzoate in diverse soft drink samples.
Benefits
- Using Alliance iS HPLC System for the separation and quantification for six soft drink additives in a 17-minute isocratic method
- The Alliance iS HPLC System can accommodate higher pressures, which allows the use of longer columns, which in turn provides better separations
- The method fully resolved all additives from aspartame degradation products
- The ability to precisely and accurately inject small volumes of concentrated samples, which minimizes sample dilution
Introduction
Soft drinks often contain caffeine, sodium benzoate, potassium sorbate, acesulfame K (Ace-K), aspartame, and saccharin (Figure 1). The soft drink quality and flavor is also heavily influenced by the ingredients and the exact amounts of these ingredients. As such, is important to ensure that the concentrations of these additives and ingredients in soft drinks are within specified ranges. The presence of such a wide variety of components in soft drinks can make the analysis challenging. A variety of methods exist for determining the content of these ingredients in beverages. Some of these methods include UV-Visible spectrophotometry, ion chromatography, gas chromatography, and high-performance liquid chromatography (HPLC).1–2
This study demonstrates using a previously reported HPLC method for the analysis of using the Alliance iS HPLC System.3 The method uses a preformulated mobile phase, wash solvent, and standards from Waters™ (Waters Beverage Analysis Kit).
The Alliance iS HPLC System features an injector design that improves injection precision and delivers high pressures, allowing for the use of smaller particle size columns, which provides improved separation efficiency.
 Figure 1. Chemical structures of six common beverage additives that were used in this study.
Experimental
Standard Preparations:
The Waters Beverage Analysis Kit contains two bottles of standards: The first is a 100-milliliter bottle that contains a mixture of premade standards of acesulfame K (150 mg/L), saccharin (100 mg/L), benzoate (200 mg/L), sorbate (100 mg/L), and caffeine (100 mg/L). The other bottle contains 50 mg of powder aspartame. To prepare the final standard solution, the liquid standard was poured into the bottle of aspartame powder. The bottle containing this mixture is then capped tightly and shaken vigorously until the aspartame is completely dissolved.
Soft Drink Preparations:
The soft drinks that were used in this study involved five carbonated beverages, two of which contained artificial sweeteners, two regular sweeteners, and an energy drink. Samples of these soft drinks were sonicated for two minutes and filtered through a 0.2 µm PVDF disk filters before injecting them onto the HPLC system.
LC Method Conditions
|
Column details: |
XBridge™ BEH Phenyl XP 130 Å 4.6 mm x 150 mm, 2.5 µm p/n: 186006720 |
|
Column temperature: |
35 °C |
|
Mobile phase: |
Waters Beverage Mobile Phase |
|
Flow rate: |
1.6 mL per minute |
|
Profile: |
Isocratic |
|
Detector type: |
TUV Filter: Normal Data Rate: 10 Hz |
|
Detector wavelength: |
214 nm |
|
Injection volume: |
7 µL |
|
Auto sampler needle wash solvent: |
Waters Beverage Mobile Phase (p/n: 186006006) |
|
Sample manager wash solvent: |
Waters Beverage Analysis Wash Solvent (p/n: 186006007) |
|
Run time: |
17 minutes |
Data Management
|
Chromatography software: |
Empower™ 3.6 Feature Release 5 |
Results and Discussion
Precision and Accuracy in Injections
Precise and reliable sample injection plays a crucial role in ensuring accurate and consistent quantification in HPLC measurements. Errors in sample injection can have a significant impact on the quality of the data, leading to inaccurate and inconsistent results.
Therefore, it is critical to minimize sample injection errors by using high quality autosamplers that can minimize such errors. The Alliance iS HPLC system uses a metering device that is in-line with the flow path to ensure complete transfer of the injected sample to column and to minimize air bubble formation.
This experiment evaluated the linearity and accuracy of the relationship between injection volume and peak area for a standard mixture of six beverage additives. To do this, a wide range of injection volumes (0.2–20 µL) were injected onto the Alliance iS HPLC System in replicates (n=6). The resulting peak areas were recorded for each injection, and least squares regression lines were fitted through zero for these additives. The results, depicted in Figure 2A, showed excellent linearity for all fitted lines exhibiting R-squared (R2) values of over 0.9999 for all analytes.
Another useful plot is the residual plot, which shows the difference between the observed value and the predicted value generated by the regression model. In this case, the residual plot shows the accuracy of the injection volume at different injection volumes, as shown in Figure 2B. The figure shows the relative errors in observed peak areas compared to the fitted lines across different injection volumes. For comparison purposes, the ISO maximum permissible errors for volumetric pipettes were also plotted on the same graph.4 The observed relative errors in injection volume were all within the ISO limits for pipettes.
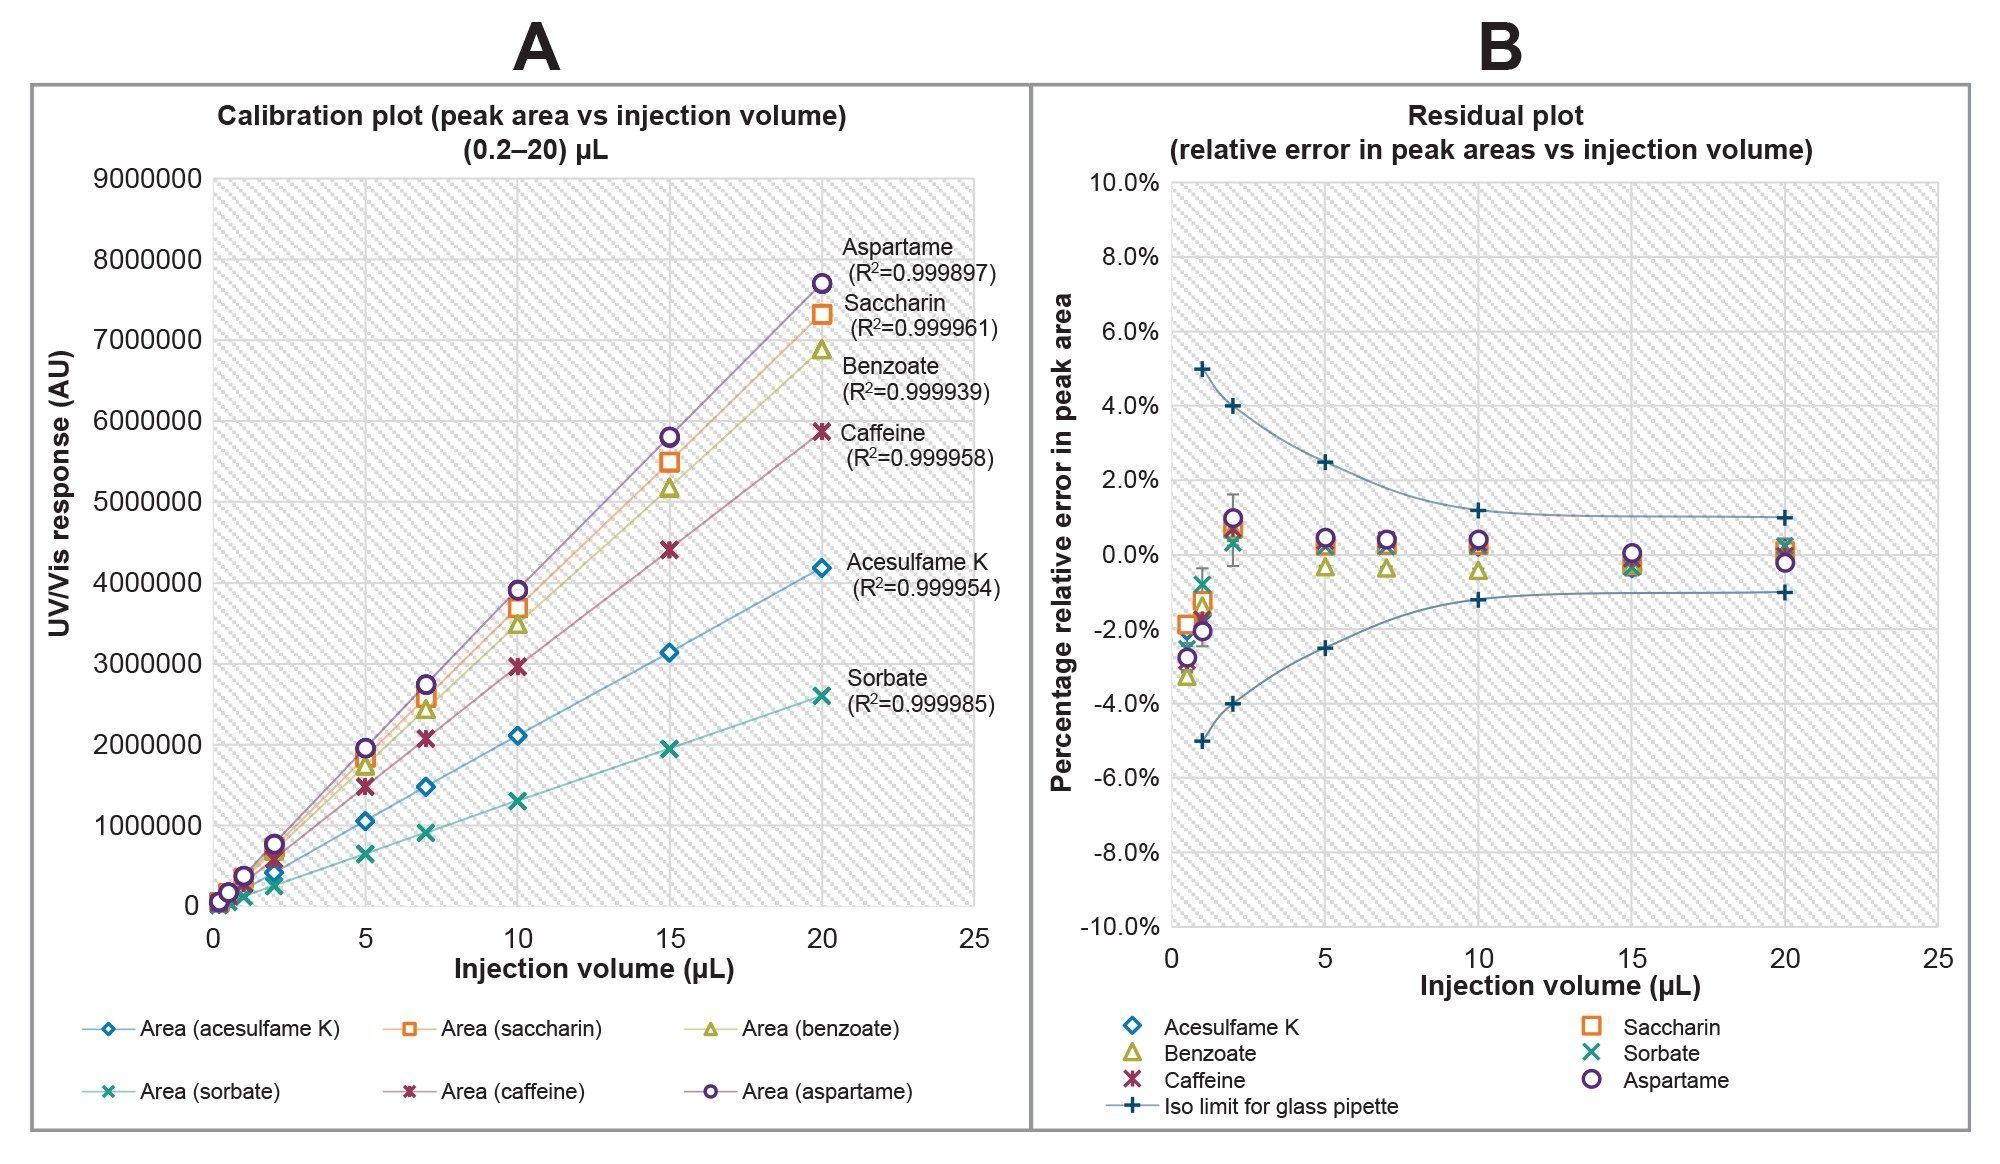 Figure 2. shows the linearity and accuracy of injection volume on the Alliance iS HPLC System for beverage analysis. Plot A shows the relationship between peak area and injection volume, which is linear across the entire range of injection volumes tested. Plot B shows the relative errors of observed peak area to the fitted lines, which are all within the ISO maximum permissible systematic errors for volumetric pipettes.
Separation of Aspartame Degradation Products
Aspartame, an artificial sweetener, is widely used in soft drinks as a sugar replacement due to its sweetness level, which is approximately 200 times that of sucrose. Aspartame is also unstable and can degrade under certain conditions to diketopiperazine (DKP), a cyclic dipeptide that has been shown to be cytotoxic in animal studies.5–6 Aspartame is most stable in solid form, when dissolved in water it begins to degrade and this process is accelerated by heat and acidic conditions. These degradation products could coelute with soft drink additives and interfere with quantification of these additives. Therefore, it is critical that the HPLC method can resolve any degradation peak from the other components.
To assess the methods ability to separate aspartame degradation products from the main peaks of soft drink additives, samples with degraded aspartame were analyzed. Since aspartame is unstable and it can easily degrade, a standard solution containing the six additives was left at room temperature for two weeks to degrade and compared to the same standard that was freshly prepared. Results of this experiment as can be seen in Figure 3 showed that two unknown peaks at 2.1 and 4.34 min increased in area for the sample that was kept at room temperature compared to the sample that was freshly prepared. This indicates that these peaks correspond to aspartame degradation, consistent with previous reports.3 These two unknown peaks were fully resolved and did not interfere with other additive peaks, indicating that the method is capable of resolving all the peaks, including aspartame degradation peaks. It is worth noting that this method was originally developed on an Arc™ HPLC System and migrated to an Alliance iS HPLC System without major modifications, implying that the method is very robust, and the method migration was very successful. The obtained results demonstrated that the method effectively separated all the compounds in the mixture, with a critical pair USP resolution of 2.3, as depicted in Figure 3. The critical pair is the least resolved peak pair in a chromatogram, and in this case, it is the resolution between unknown peak number 1 and peak number 1 (acesulfame K). It should be noted here that initial experiments were performed using both a 10 and 15 cm columns, but the separations were better on the 15 cm column. Therefore, the decision was made to use a 15 cm column to provide better separations. The Alliance iS HPLC System can accommodate high pressures (10000 psi), so these experiments were possible using the longer column.
 Figure 3. Overlay chromatogram of a standard solution containing the six soft drink additives. The black trace represents the sample that was freshly prepared, and the black trace represents the sample that was left at room temperature for two weeks. The inset shows an expanded region of the chromatogram to highlight the degradation peaks. Chromatographic conditions are described in the experimental section.
Analysis of Soft Drink Samples
Application of the method to the analysis of samples obtained from commonly consumed beverages available in the market was then performed. The samples were prepared as described earlier and injected into the system under the same conditions as those in Figure 3. Results of this experiment as shown in Figure 4 demonstrated that the method was successful at separating soft drink additives and quantifying them. Table 1 shows the analysis results of these samples and the amounts of these additives in the samples.
Caffeine levels in these samples range from 96 mg ml-1 to 300 mg ml-1. These concentrations are much higher than the concentration of caffeine in our standards. Typically, it is necessary to dilute these samples to bring their caffeine peak area into alignment with the calibration range. However, since the injection volume is very precise over a wide range of injection volume as previously demonstrated (Figure 2), it was possible to inject smaller injection volumes of these samples to align the caffeine peak areas of the samples with the calibration ranges. This not only improves the efficiency of the quantification process, but it also reduces the risk of human error associated with manual sample dilution.
It's important to highlight that the relative standard deviation (RSD) for concentration of aspartame over a span of two days was notably higher compared to that of all other additives. This discrepancy can be attributed to the instability of aspartame, which results in more significant degradation over the course of the two-day period when compared to the stability of the other additives.
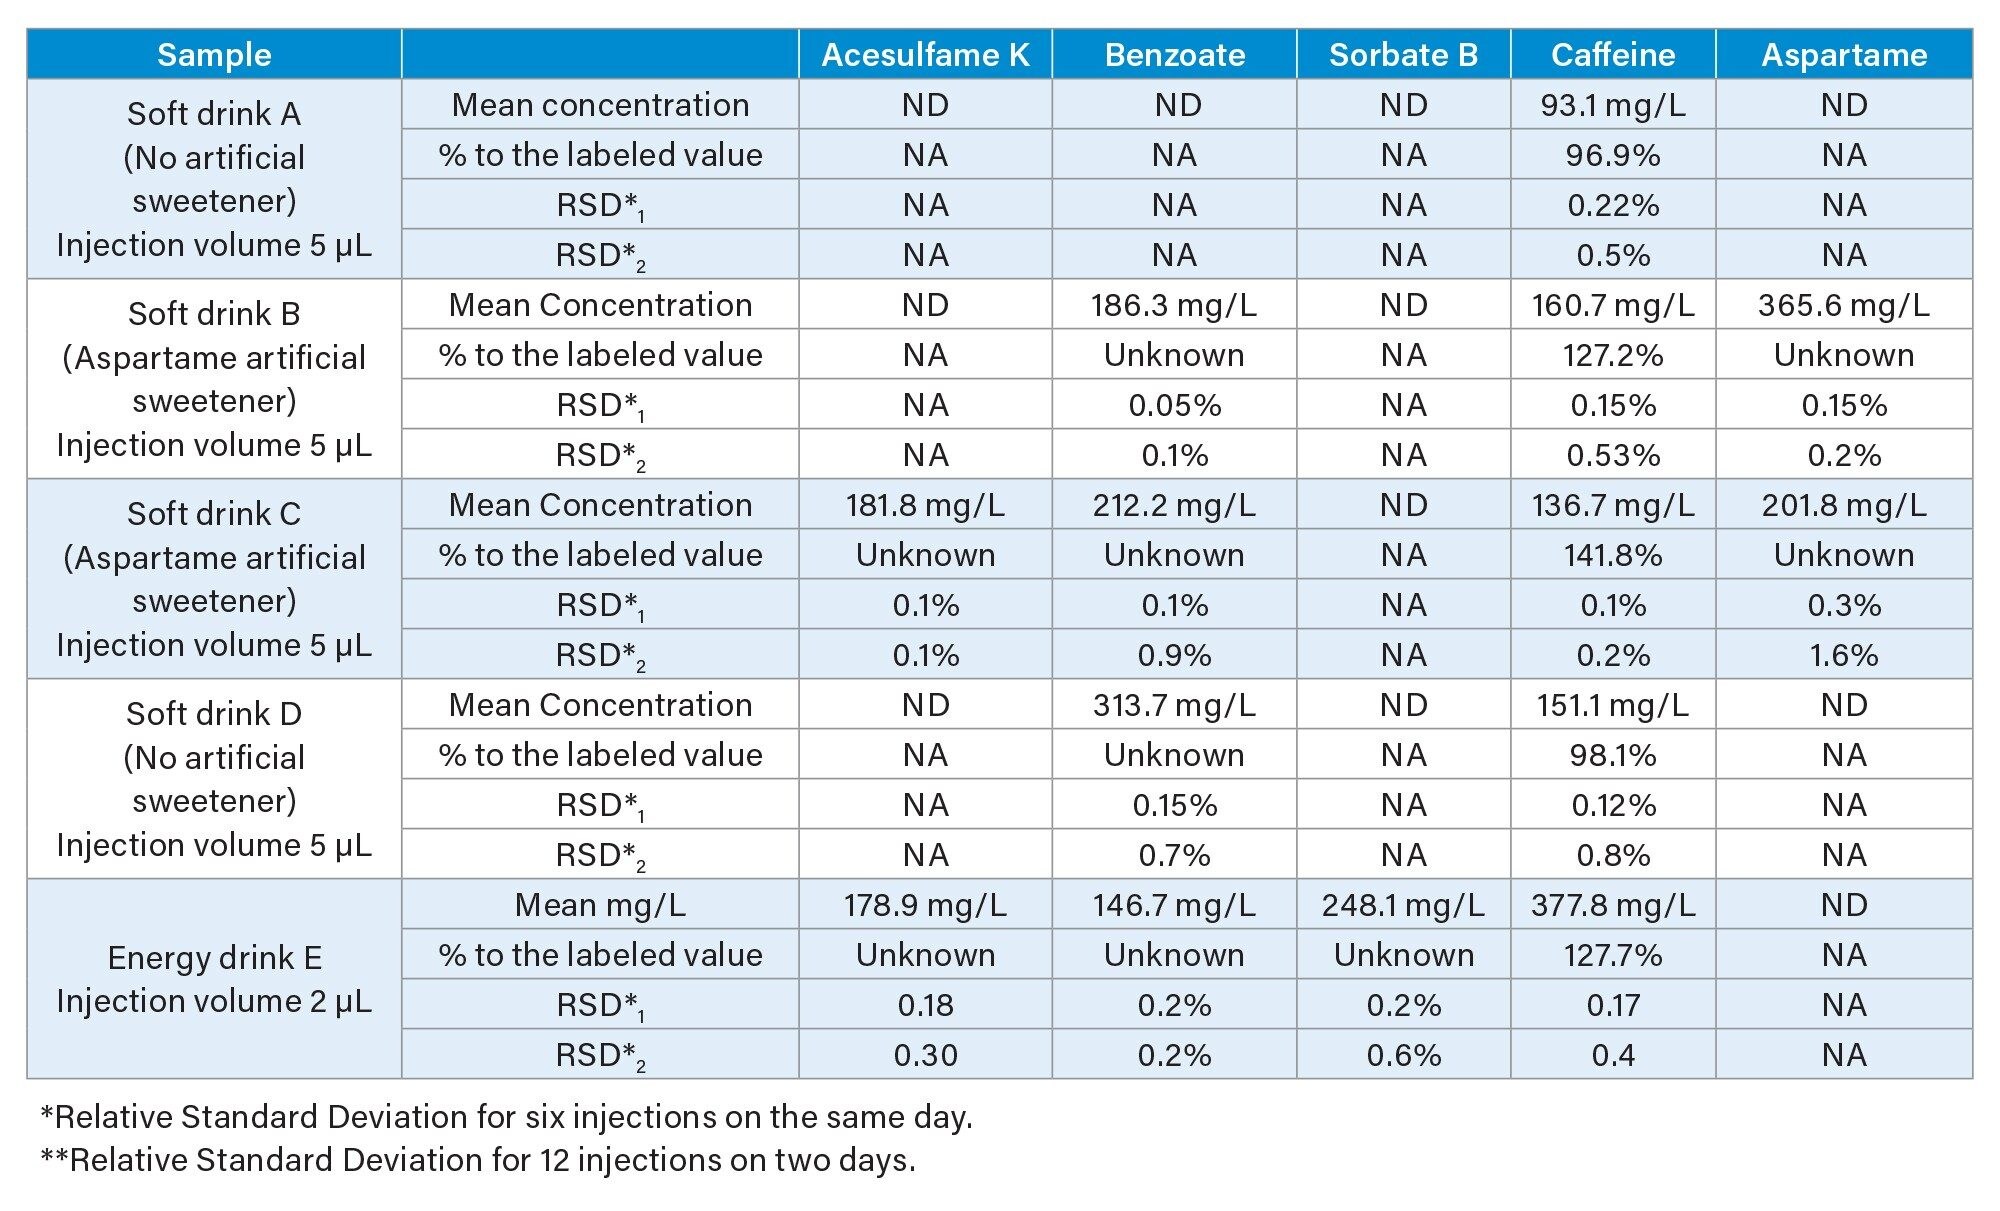 Table 1. Summary of Soft Drink Analysis Results.
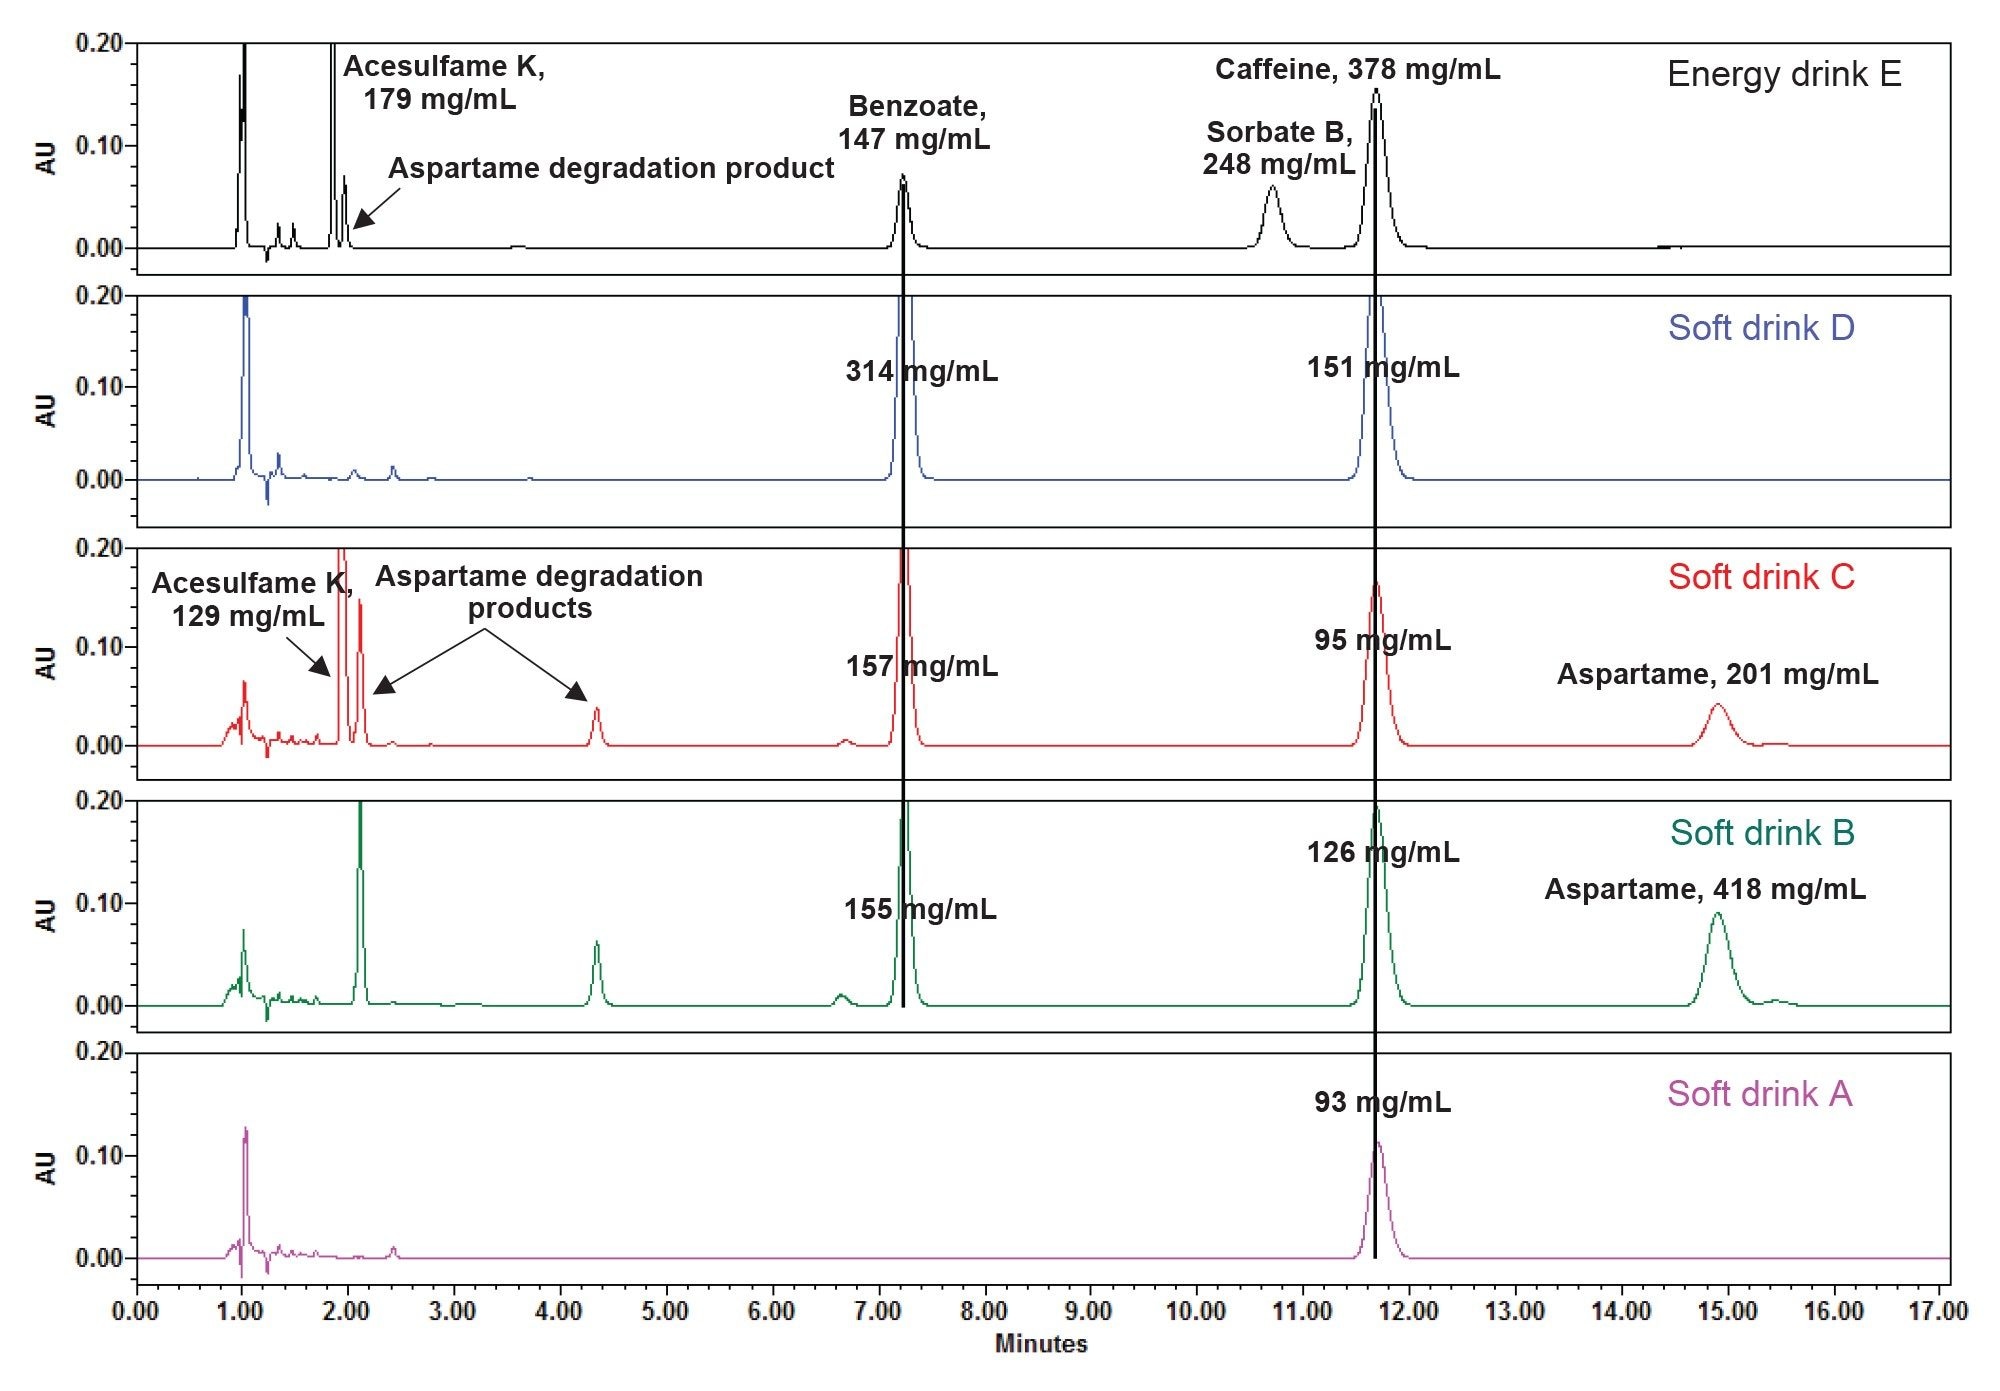 Figure 4. Representative separation of five different beverages using the previously outlined method, with the only deviation from prior conditions being the injection volume. All samples were injected with a 5 µL volume, except for the energy drink, which utilized a 2 µL injection volume.
Conclusion
This application note demonstrates employing a rapid, and precise isocratic method for analyzing soft drink additives using the Waters Alliance iS HPLC System. The Alliance iS HPLC System's outstanding injection accuracy aligns with ISO requirements for volumetric pipettes, allowing for the injection of smaller sample volumes as a viable alternative to sample dilution to achieve calibration range compatibility.
Implementing this beverage analysis on the Alliance iS HPLC System with the Waters Beverage Analysis Kit offers several significant advantages in a soft drink manufacturing setting, including:
- Quality control of soft drink additives within a brief 17-minute isocratic run
- Ensuring no interference from aspartame degradation products when quantifying additives
- The ability to inject smaller sample volumes for high-additive-content samples, reducing the need for manual sample dilution
- Utilizing pre-formulated mobile phases, wash solvents, and standards for simplified setup and preparation
- Employing an ethanol-based mobile phase and wash solvent, which leads to lower disposal costs
References
- Li, R., et al., Simultaneous Determination of Synthetic Edible Pigments in Beverages by Titania-Based RP-HPLC. Arabian Journal of Chemistry, 2020. 13(2): p. 3875–3881.
- Lino, C.M. and A. Pena, Occurrence of Caffeine, Saccharin, Benzoic Acid and Sorbic Acid in Soft Drinks and Nectars in Portugal and Subsequent Exposure Assessment. Food Chemistry, 2010. 121(2): p. 503–508.
- Jinchuan Yang, P.D.R., Analysis of Soft Drink Additives with No Interference from Aspartame Degradants Using Arc HPLC System with PDA Detection. 2021: Waters Corporation, 720007219.
- Pipette Standards Handbook. Available from: https://www.troemner.com/medias/Pipette-Standards-Handbook.pdf?context=bWFzdGVyfHJvb3R8MTkzOTg4OXxhcHBsaWNhdGlvbi9wZGZ8aDJmL2gzZC9oMDAvMTAxOTM2NDQxNTkwMDYucGRmfDhlODlkOTEwZmZkNDExZWI3YWVlMGQ5M2FhNWE5MWMzOTAxM2YxMWM1MzM0NDQxMGQ2MDdmZGViMWQzYmZhYjE.
- Van Vliet, K., et al., Aspartame and Phe-Containing Degradation Products in Soft Drinks Across Europe. Nutrients, 2020. 12(6).
- Perzborn, M., C. Syldatk, and J. Rudat, Enzymatical and Microbial Degradation of Cyclic Dipeptides (diketopiperazines). AMB Express, 2013. 3(1): p. 51.
720008162, January 2024