Improving Chromatographic Resolution of the JECFA Method for the Analysis of Steviol Glycosides
Abstract
Steviol glycosides are often used as natural non-caloric sweeteners in food and beverages. This group of compounds shares the same steviol aglycone structure, but with different numbers and types of glycoside units (e.g., glucose, rhamnose, or xylose). The FAO/WHO JECFA Monograph 26 (2021) includes the most up to date international standard for steviol glycosides, in which reversed-phase liquid chromatography (RPLC) is recommended for the determination of major and minor steviol glycosides. However, the chromatographic resolution of steviol glycosides obtained under these JECFA recommended conditions is inadequate (resolution of about 1.0 for the critical pair). In this work, we were able to improve the JECFA RPLC method to achieve resolution of ≥1.5 using 2.5 µm particle-size columns on the Arc™ Premier System, and a higher resolution 2.0 using sub-2 micron particle-size columns. Elements of the ICH Q14 Analytical Procedure Development guideline was followed for the method optimization. The improved method is shown to be accurate, sensitive, reliable, and robust, and provides a more efficient separation for the analysis of the commercial stevia extracts.
Benefits
- LC-UV separation of steviol glycosides was optimized following an enhanced approach to method optimization as recommended in the ICH Q14 Analytical Procedure Development guideline
- Higher resolution of critical pairs has been achieved, which is beneficial to the analysis of complex Stevia extracts
Introduction
Steviol Glycosides (SG) are constituents of the leaves of the plant Stevia rebaudiana Bertoni (stevia) and have a sweet taste that is 100 to 300 times sweeter than sucrose. They are often used as non-caloric sweeteners in foods and beverages. More than 40 SG have been identified.1 The most abundant are rebaudioside A (Reb A) and stevioside (SV). However, some minor SG are becoming more readily available and are in demand due to their higher sweetness intensity and less bitter aftertaste.1–2
Liquid Chromatography (LC) is the main technique used in SG analysis and reversed-phase (RP) C18 columns are the most frequently used columns in the LC analysis of SG.3–6 The Food and Agriculture Organization of the United Nations, and the World Health Organization (FAO/WHO) Joint Expert Committee on Food Additives (JECFA) has published a series of monographs on SG since 2006. The latest monograph, published in the FAO/WHO JECFA Monographs 26 (2021), recommended two methods for the determination of the major and the minor SG by LC-UV and LC-UV-MS, respectively.1 In both methods, the same C18 column and the same gradient elution was used to separate the major SG (13 compounds) and the minor SG (17 compounds and their isomers) within a total run time of 35 minutes. The main difference between these two methods was that a mass spectrometer (MS) was used for the minor SG analysis, while an ultraviolet/visible (UV/Vis) detector was used for the major SG analysis. With these methods, the chromatographic resolution has been improved over the previously published JECFA method, however, it is still not adequate. A resolution of about 1.0 was estimated for the critical pair (Reb A/SV) in these methods, however, more efficient separation of SG is highly desired.
The objective of this study was to improve the chromatographic resolution of the RPLC of SG, without extending the run time. To achieve this goal, we screened five C18 columns, optimized the elution conditions, and evaluated the analytical method performance. Elements of the enhanced approach to analytical procedure development in the International Council for Harmonisation of Technical Requirements for Pharmaceuticals for Human Use (ICH) guideline Q14 (Final Version, 1 November 2023)7 were adopted in the method development. Commercial Stevia Extracts were analyzed by the developed method.
Experimental
Standards and Samples
A Stevia JECFA Std Kit containing stevioside, steviolbioside (SVB), dulcoside A (Dul A), rubusoside (Rub), and rebaudioside A, B, C, D, and F (Reb A-D, F) was purchased from ChromaDex (Longmont, CO). Rebaudioside E (Reb E) and isorebaudioside A (Iso Reb A) were also purchased from Chromadex. Rebaudioside M, N, O, and I (Reb M, N, O, and I) were purchased from Sigma-Aldrich (St. Louis, MO). Figure 1. shows the structures of the SG used in this study. These SG include the 13 compounds in the JECFA method for the major SG and two additional SG, i.e., Reb I and Iso Reb A. Five representative commercial stevia extracts were purchased online. Detailed descriptions of these commercial stevia extracts are given in Table 1.
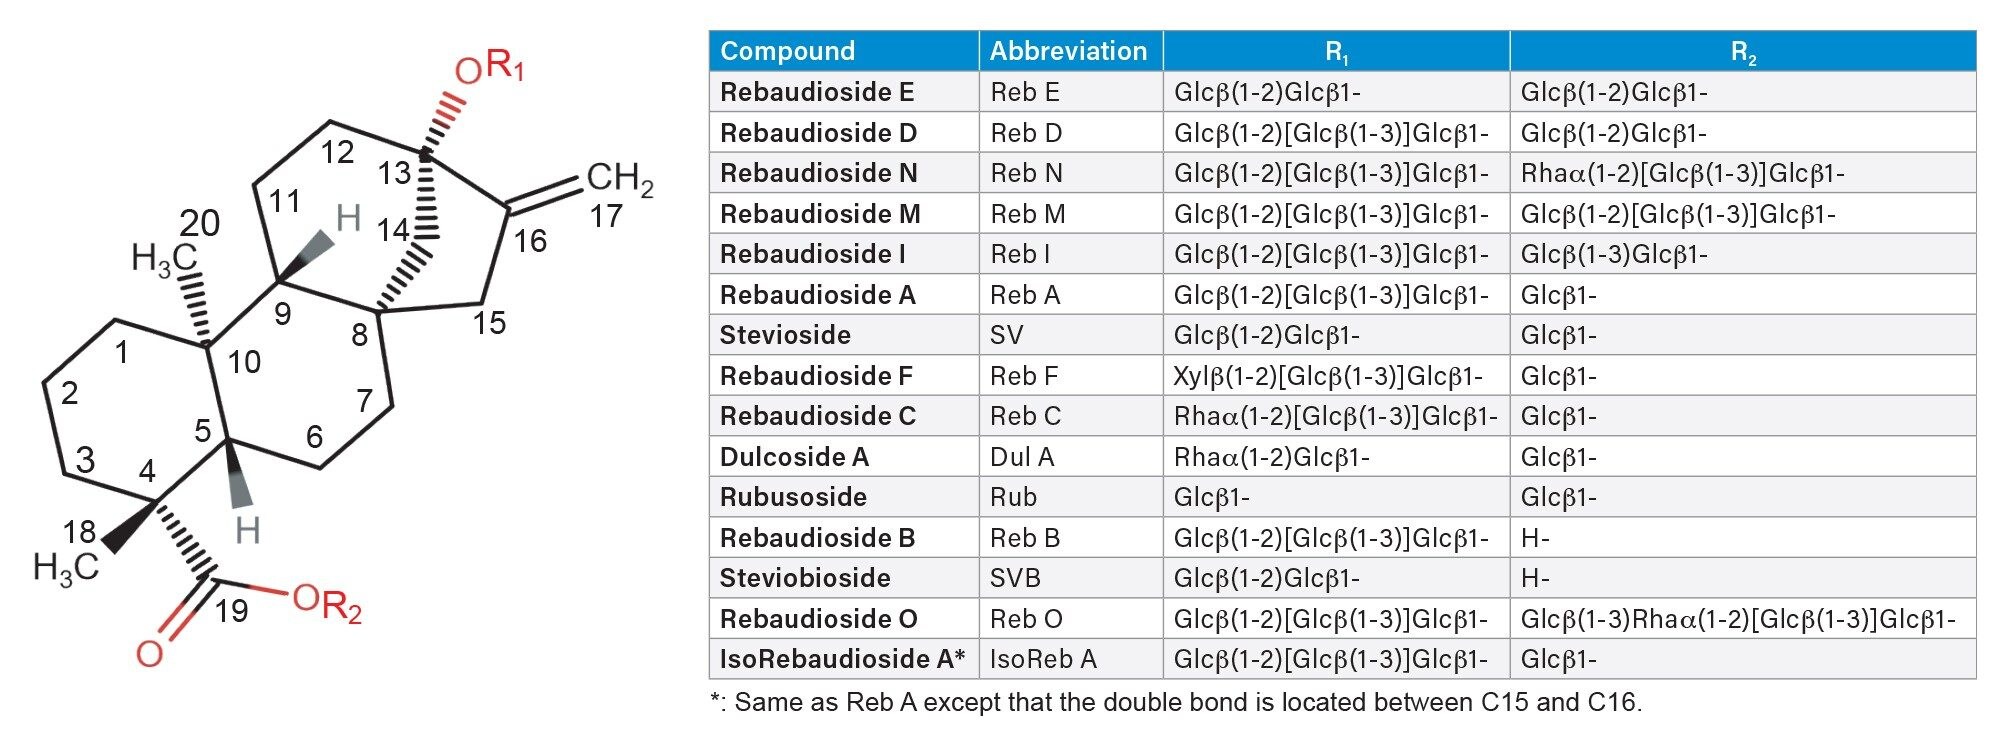 Figure 1. Structures of the Steviol Glycosides (SG) used in this study.
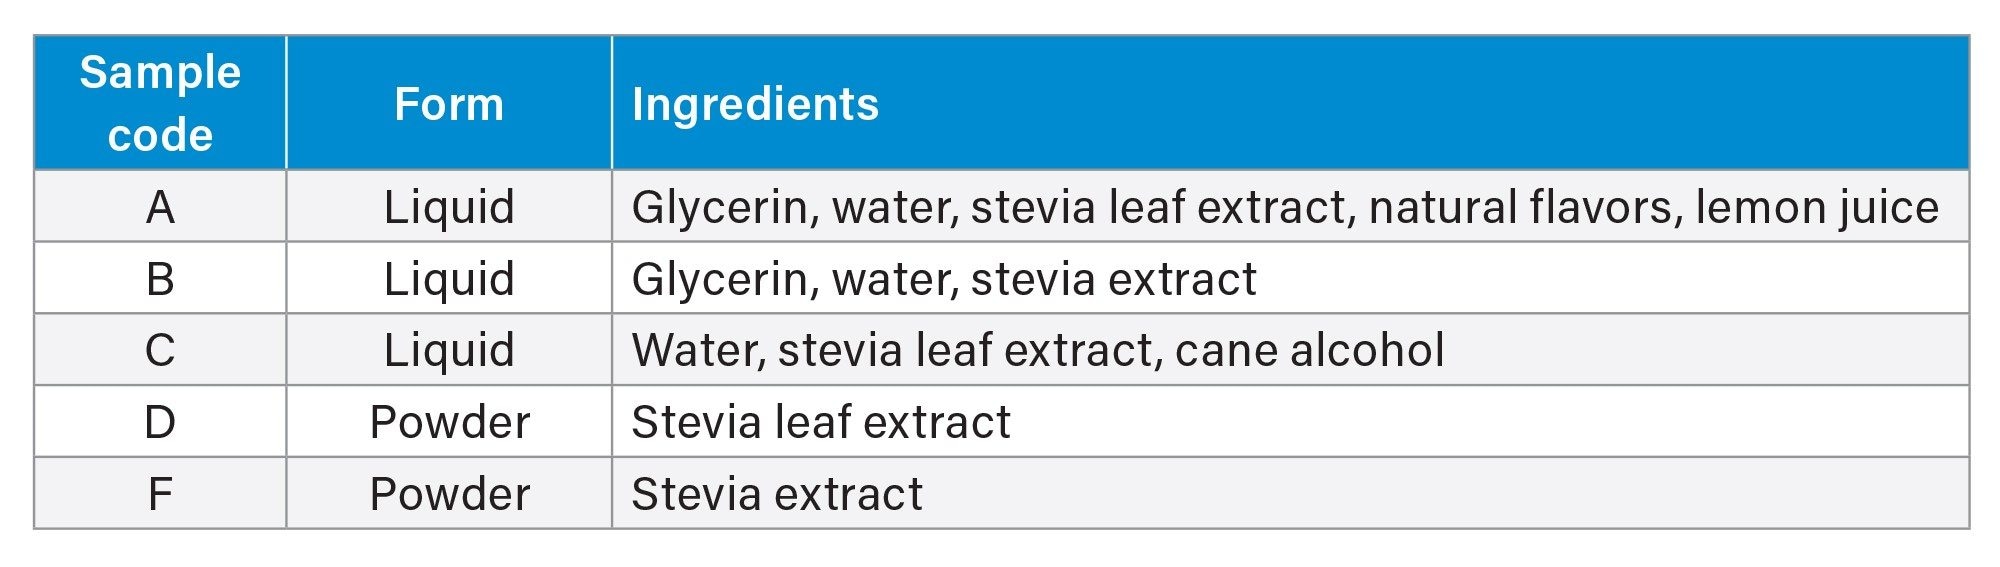 Table 1. Descriptions of five representative commercial stevia extracts used in this study.
Preparation of Standard and Sample Solutions
The individual standard stock solutions were prepared by accurately weighing 5 mg (recorded to 0.1 mg) of the standards and diluting with 5 mL of diluent (acetonitrile/water mixture, 3/7 v/v). A standard mix stock solution was prepared by transferring 1.0 mL of each individual stock solution to a 20 mL glass vial, drying to dryness with a gentle stream of nitrogen, then redissolving in 2 mL diluent. Six working standard solutions were prepared from the standard mix stock solution by dilution with various amounts of diluent to make 5, 20, 50, 100, 200, 500 µg/mL solutions.
Samples of approximately 100 mg were accurately weighed and dissolved in 10 mL diluent and filtered through a 0.45 µm PTFE syringe filter before analysis. Additional dilution may be needed for samples that contain high level of SG.
Method Conditions
|
System: |
Arc Premier System (BSM) with a 2998 PDA Detector |
|
Detection: |
UV (210 nm) and PDA (200–400 nm) |
|
Software: |
Empower™ 3 CDS |
|
MP A: |
Acetonitrile/water (2:8 v/v, with 0.02% formic acid) |
|
MP B: |
Acetonitrile with 0.02% formic acid. |
|
Column temperature: |
45 °C |
|
Vial: |
2 mL glass screw neck vial (p/n: 186000273) with screw neck cap (p/n: 186000305) |
Separations using 2.5 μm Particle-Sized Columns
|
Column: |
XSelect™ Premier HSS T3 VanGuard™ FIT Column, 130 Å, 2.5 µm, 4.6 mm x 150 mm (p/n: 186009863) |
|
Injection volume: |
10.0 µL |
|
Gradient elution program: |
See Table 2. |
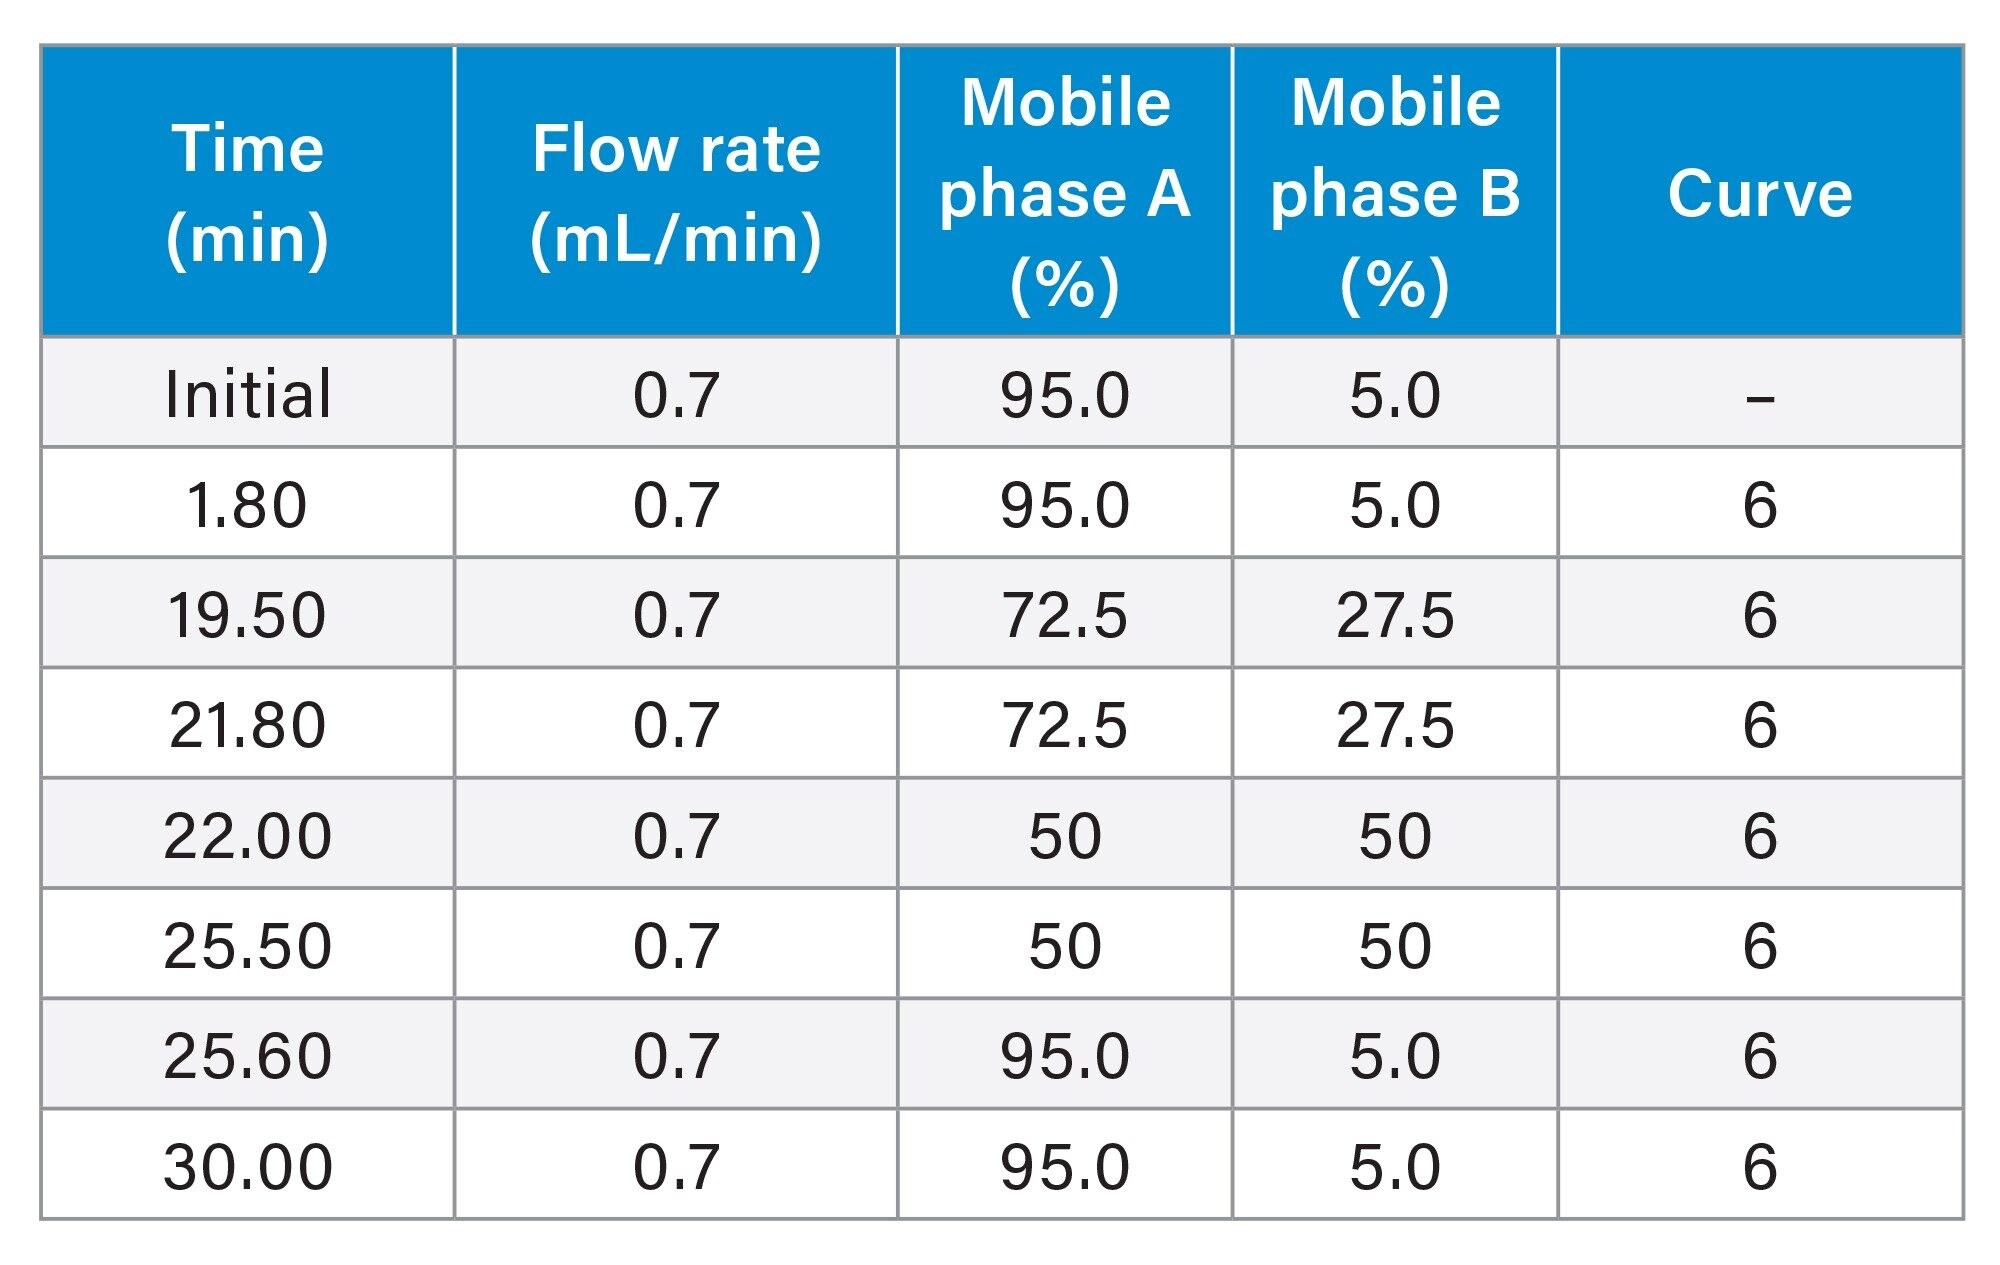 Table 2. Gradient elution program for XSelect™ Premier HSS T3 VanGuard FIT Column.
Separations using Sub-2 Micron Particle-Size Columns
|
Column: |
ACQUITY™ UPLC™ HSS T3 Column, 100 Å, 1.8 µm, 3 mm x 150 mm (p/n: 186004681) |
|
Injection volume: |
5.0 µL |
|
Gradient elution program: |
See Table 3. |
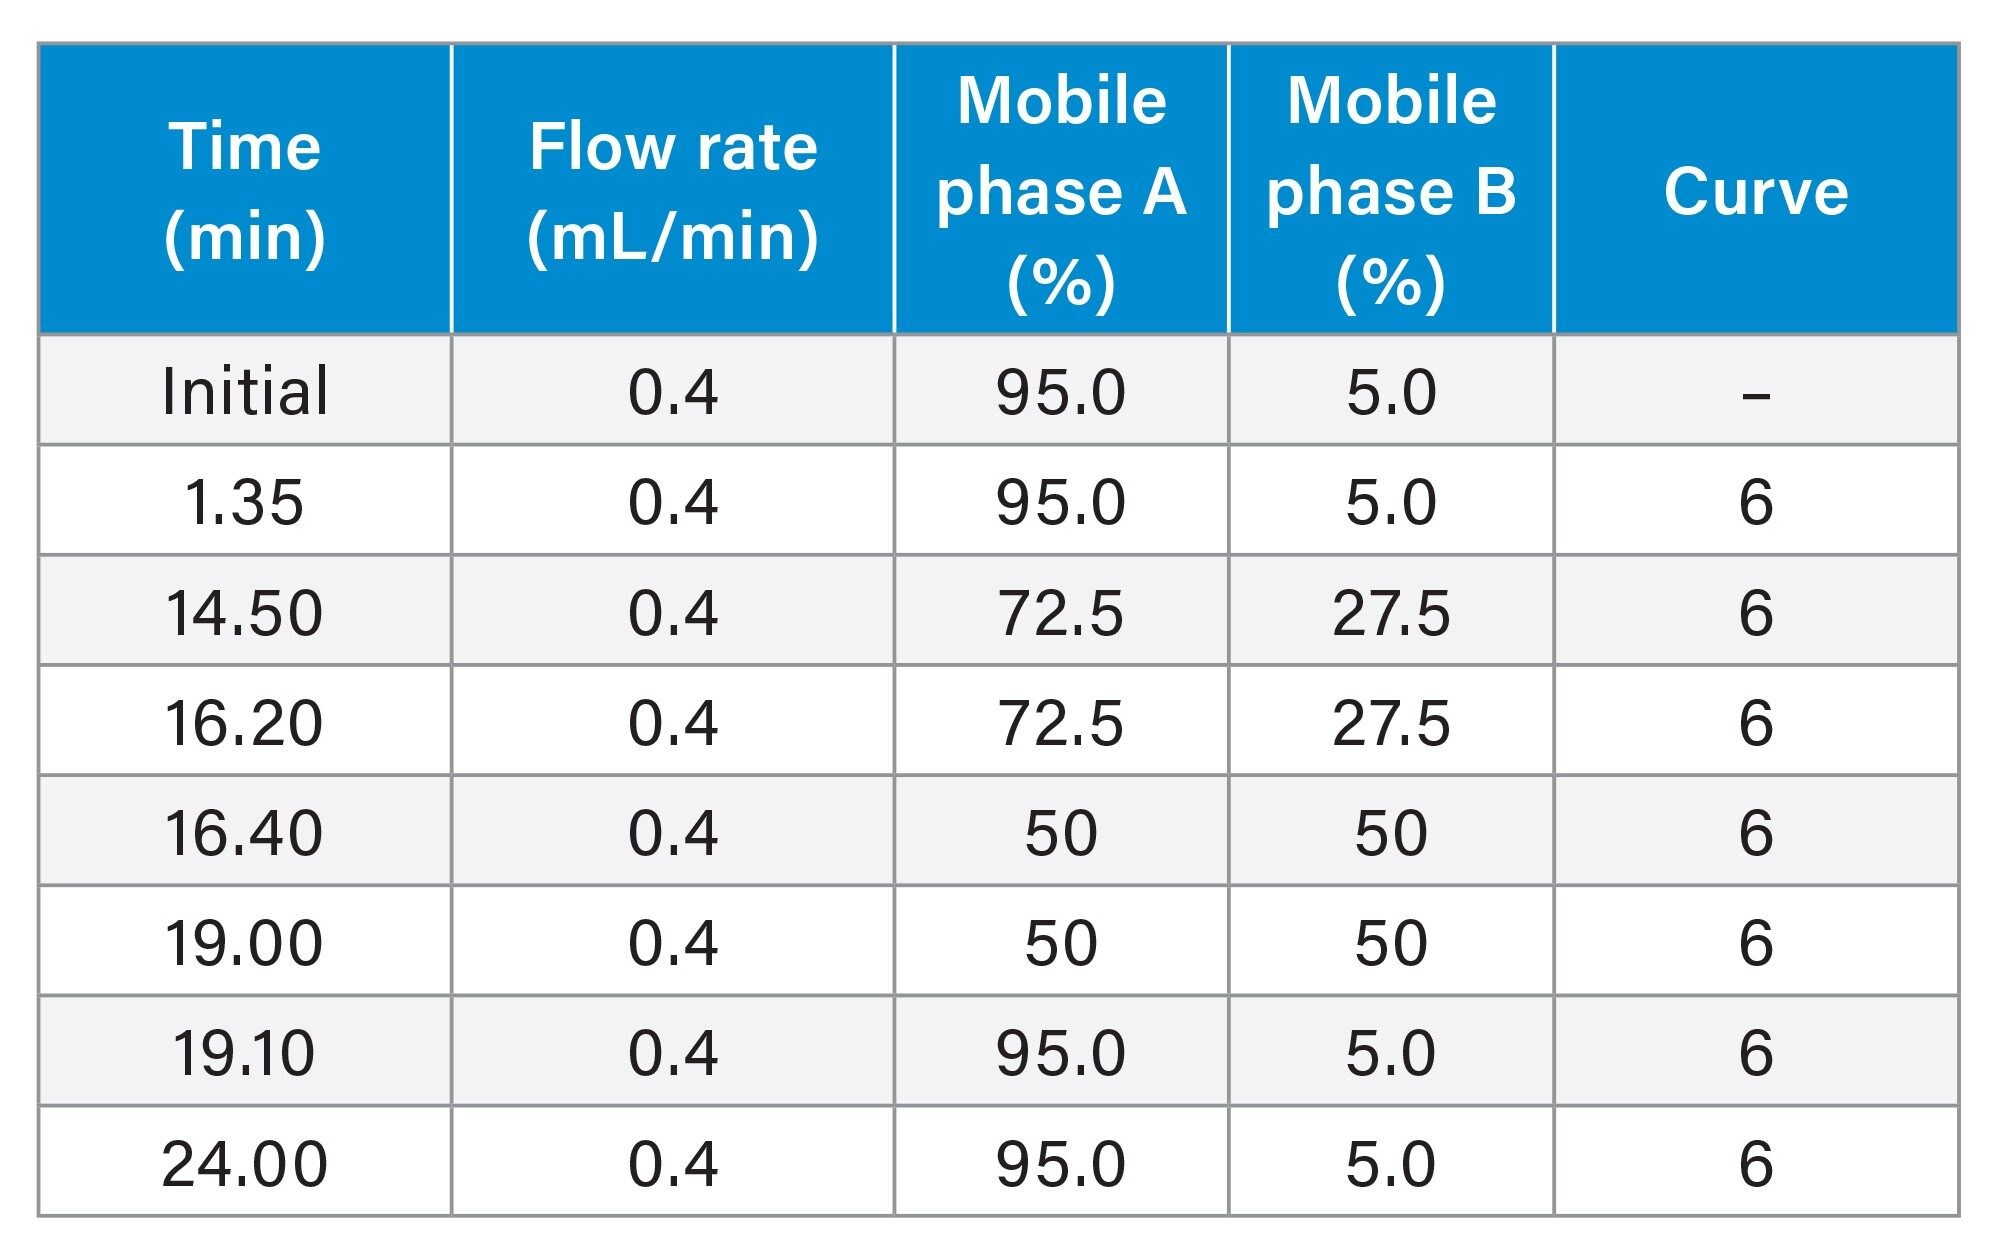 Table 3. Gradient elution program for ACQUITY UPLC HSS T3 Column.
Method Optimization: Design of Experiment
The gradient elution was first optimized using a uni-variate approach, then fine-tuned using a multi-variate approach. Briefly, three parameters in the gradient elution program that were found to have the biggest impact on resolution (during the uni-variate optimization), i.e., the initial mobile phase composition, the initial hold time, and the first gradient elution end time, were optimized using a design of experiment software (Fusion QbD® Software, S-Matrix Corp, Eureka, CA). Specifically, sample queues based on a central composite face design were created by Fusion QbD Software and exported to Empower 3 CDS. After sample queues were finished and the chromatographic data was processed in Empower 3 CDS, the results were retrieved by Fusion QbD Software for modeling and analysis. Based on the statistical analysis by Fusion QbD Software, an acceptable performance region for resolution ≥1.70 was obtained, and the optimal chromatographic conditions were determined. Robustness testing at the optimal conditions was also conducted with the assist of Fusion QbD Software. A sample queue based on a full factorial design at 2 levels that deviated from the optimal conditions was created (by Fusion QbD software), and the effects of a small deviation from the optimal conditions on the separation resolutions were investigated.
Results and Discussion
Method Development
We screened five C18 columns using the same gradient elution program that has been recommended by FAO/WHO JECFA Monograph 26. The screened columns are listed in Table 4. All columns showed comparable separations, however, the XSelect Premier HSS T3 Column showed the best resolution for the critical pair (Reb A/SV). Further optimization of the separation conditions for better resolution was carried out on the XSelect Premier HSS T3 Column. The conditions that have been investigated include column temperatures (30 °C–45 °C), flow rates (0.7–1.0 mL/min), and gradient elution. These conditions were investigated using a uni-variate approach. A resolution of 1.5 for the critical pair (Reb A/SV) was achieved in this initial optimization.
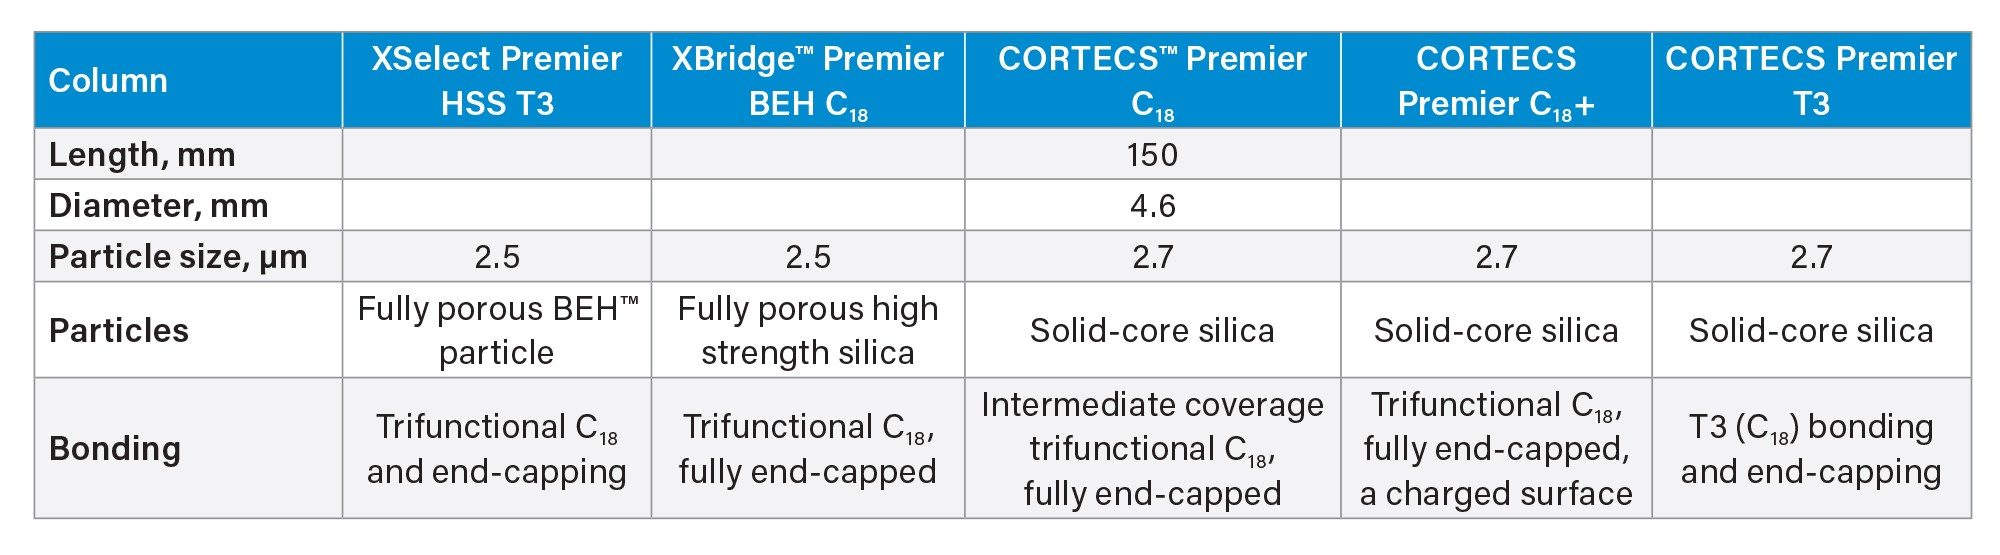 Table 4. Details of the screened columns in this study.
The gradient elution parameters, such as elution times and the mobile phase composition, were strongly interdependent on each other, therefore, a multi-variate approach was adopted in fine-tuning the gradient elution conditions for the optimal separation resolution. A multi-variate approach is recommended by the ICH Q14 guideline.7 A resolution of 1.7 for the critical pair was achieved by fine-tuning the elution conditions. Figure 2. shows the acceptable performance region for resolutions of at least 1.70 for the four most challenging pairs. Robustness testing around the optimal LC conditions was also conducted following the ICH Q14 guideline. Figure 3. shows the robustness testing results. A resolution minimum of 1.50 for the critical pair (Reb A/SV) and 1.70 for other challenging SG pairs (Reb O/Reb D, Reb E/Reb O, and SV/Iso Reb A) were obtained. Table 5. shows the range of deviation used in the robustness testing.
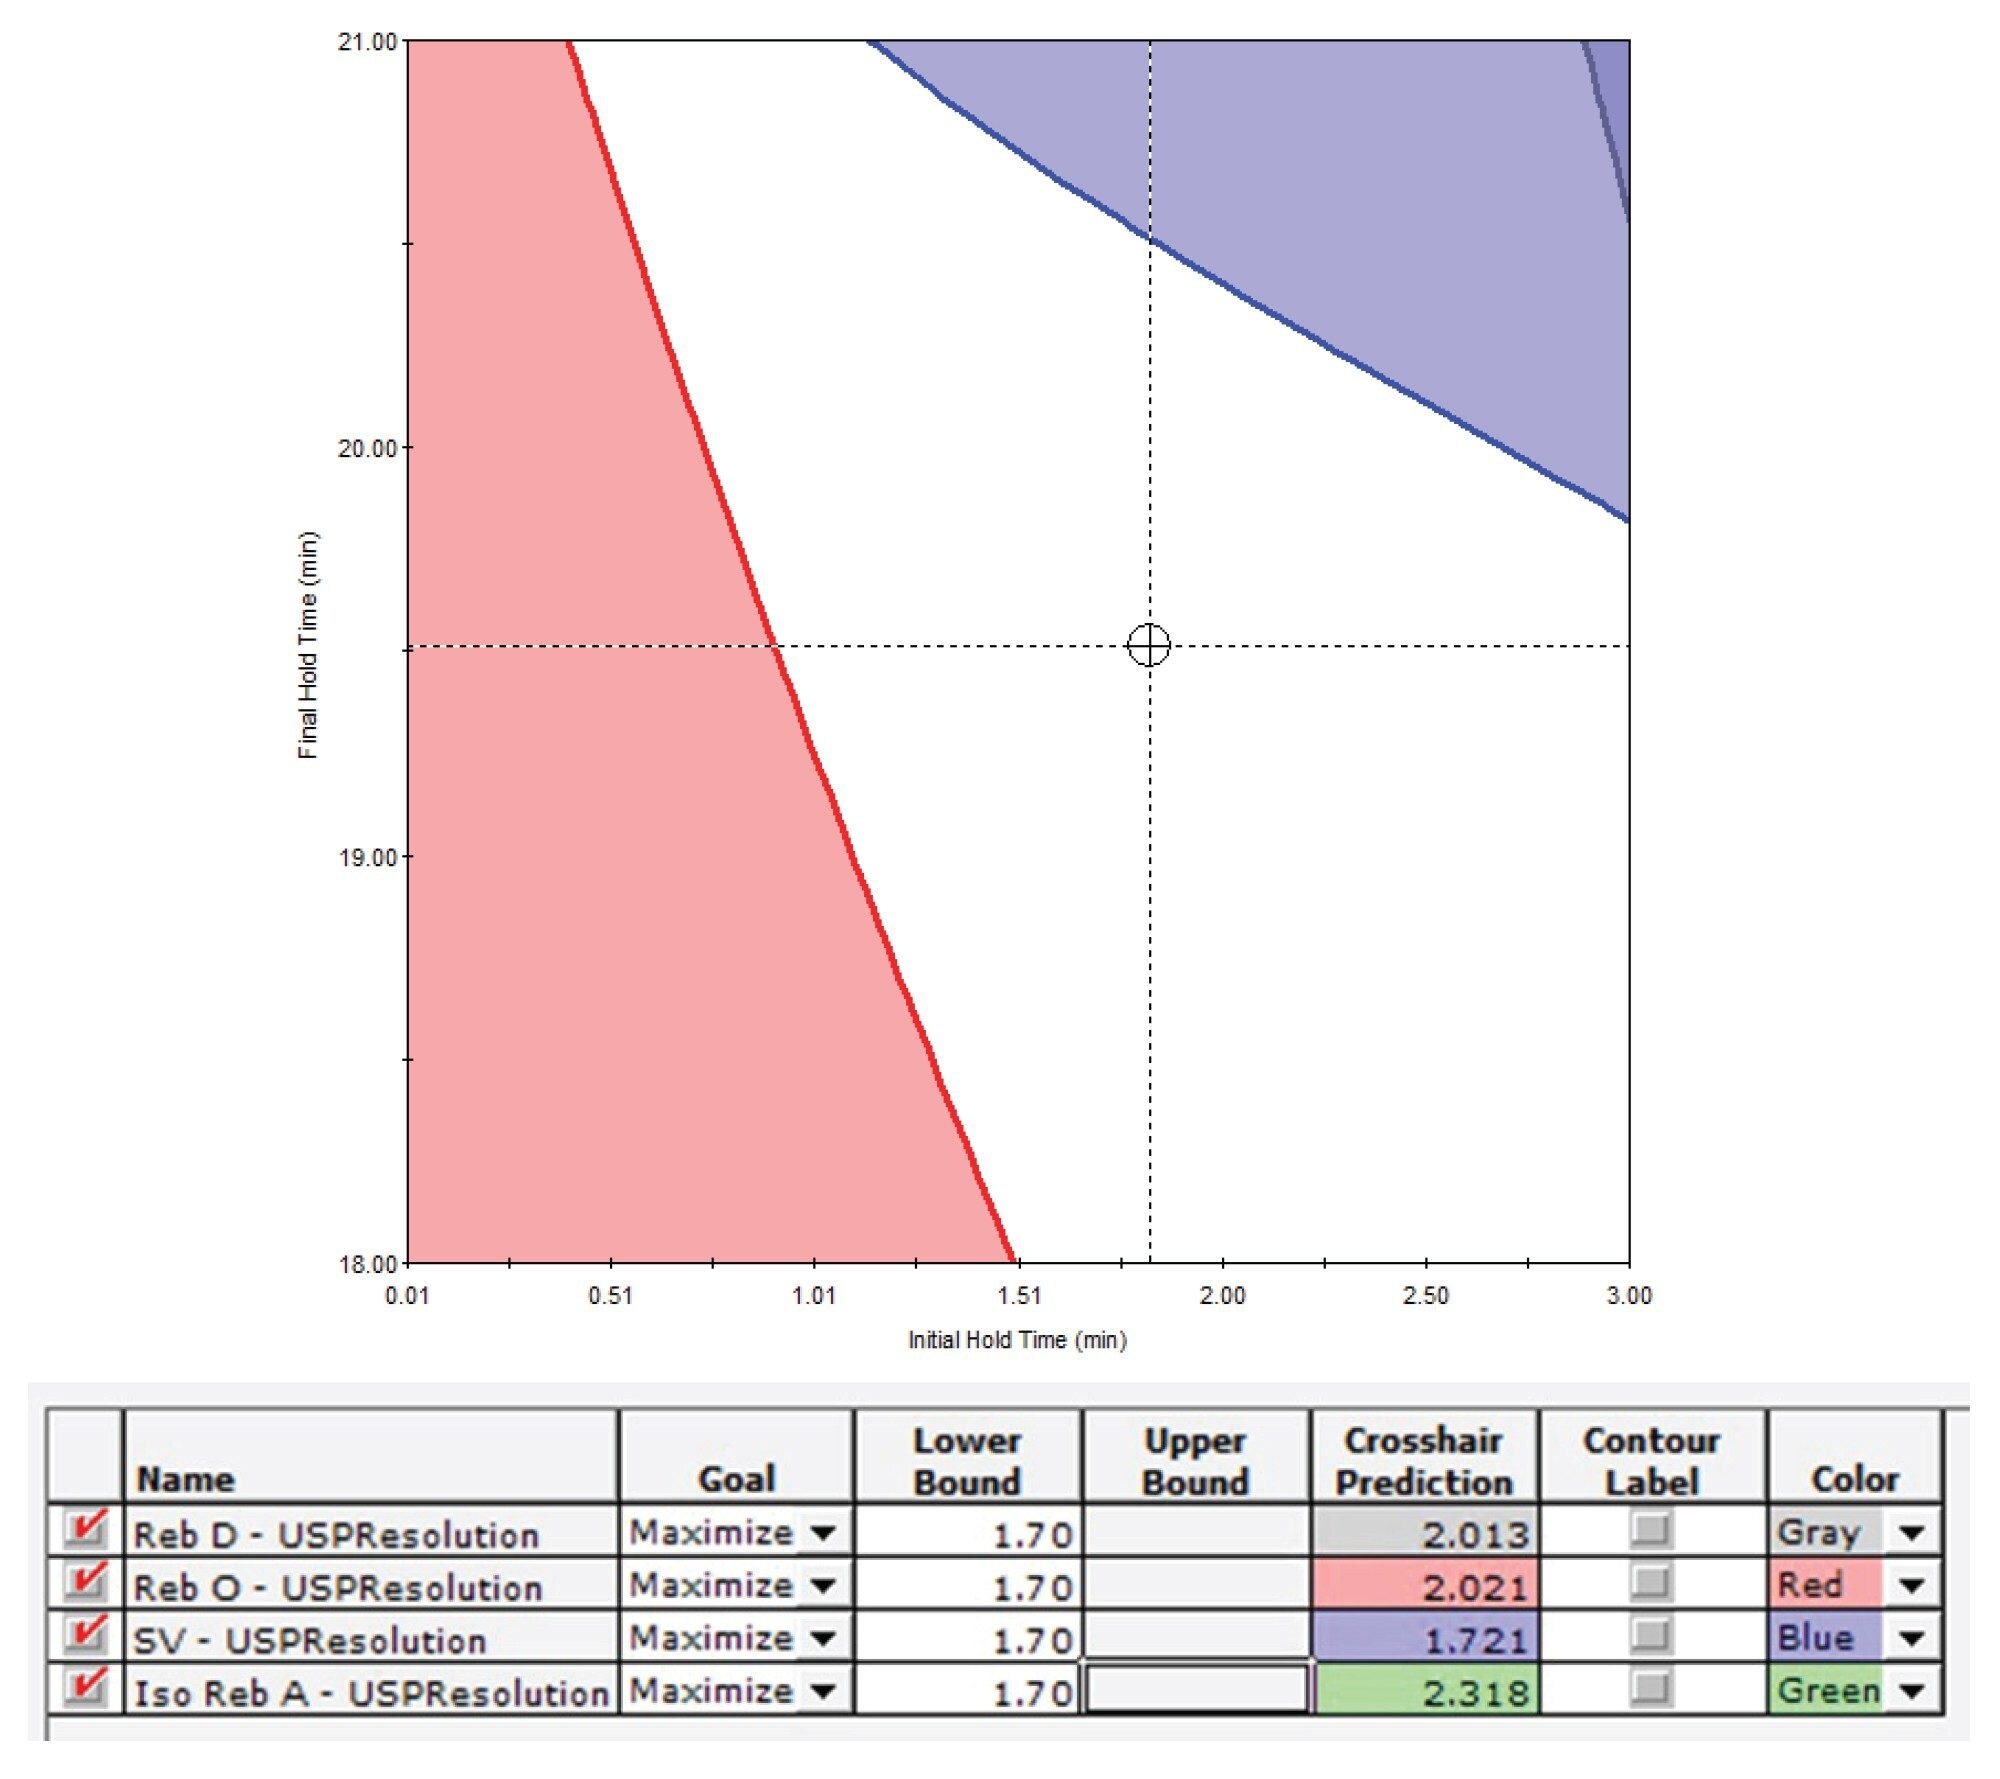 Figure 2. Acceptable performance region (blank region) for resolutions of at least 1.70 obtained at the initial mobile phase composition of 5% B. The resolutions of critical pairs of Reb E/Reb D (shown as Reb D), Reb D/Reb O (shown as Reb O), Reb A/SV (shown as SV), and SV/Iso Reb A (shown as Iso Reb A) were set as goals in the optimization.
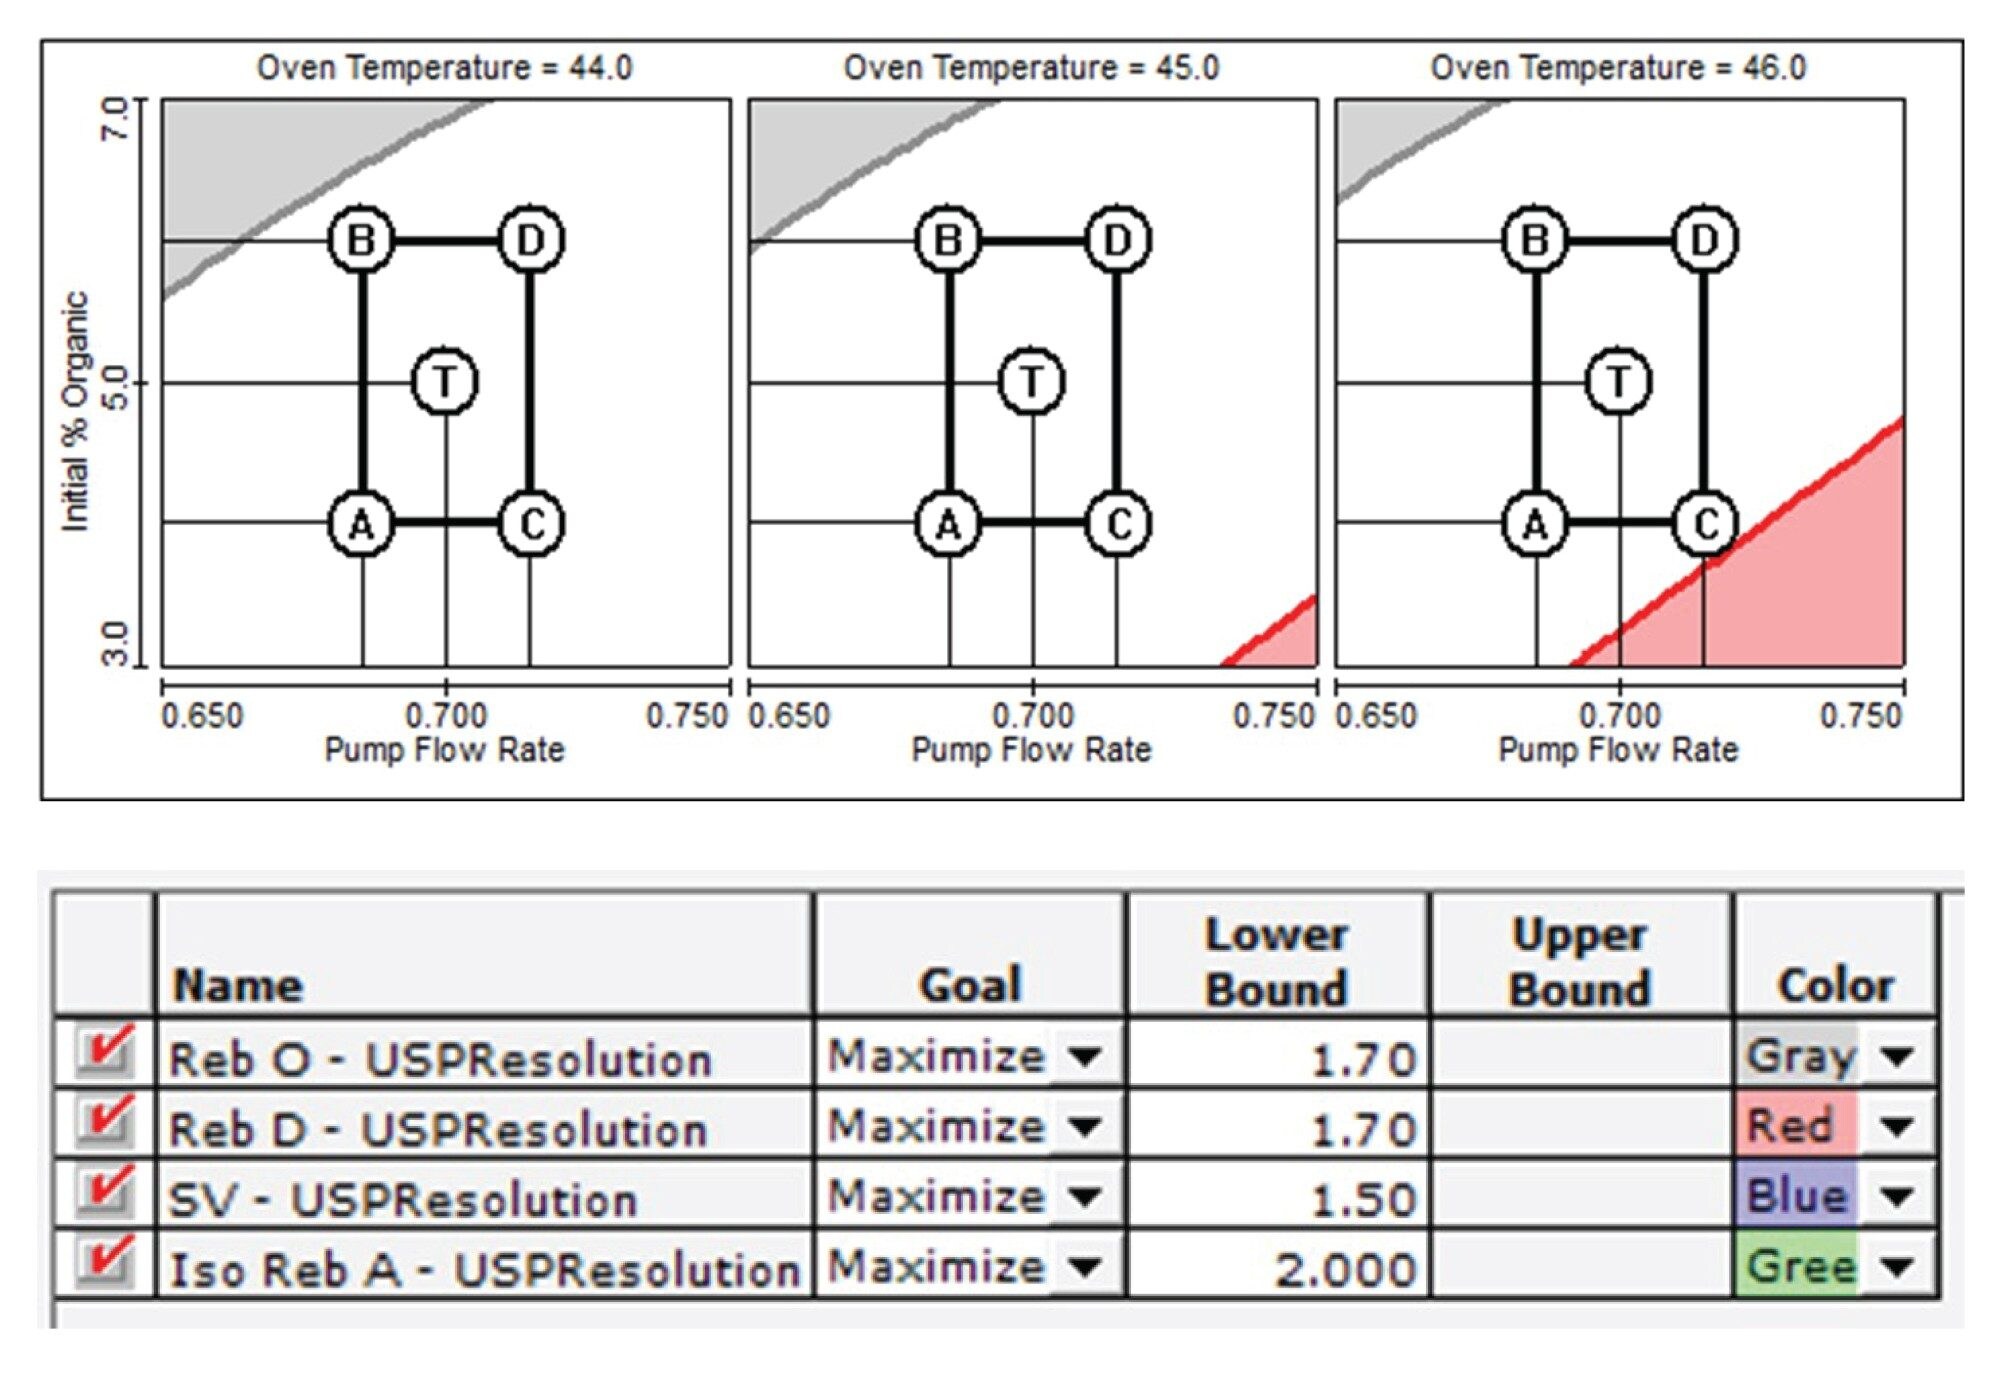 Figure 3. Robustness testing results. A minimum of 1.50 in resolution for the critical pair (Reb A/SV) and 1.70 for other steviol glycoside pairs were obtained. In the table, Reb O, Reb D, SV, and Iso Reb A represent the pair of Reb E/Reb O, Reb O/Reb D, Reb A/SV, and SV/Iso Reb A, respectively.
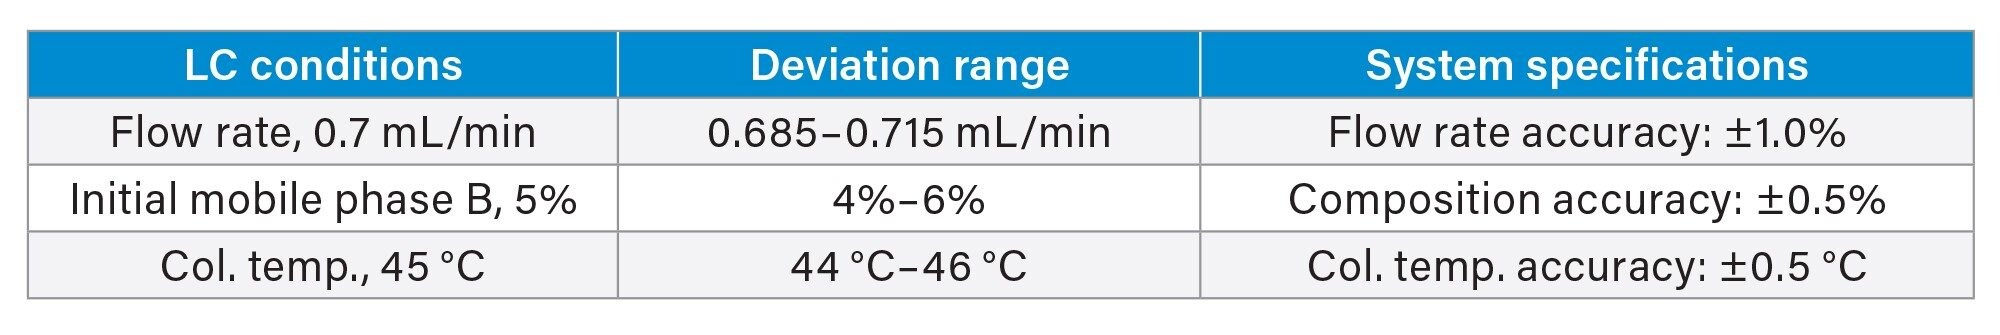 Table 5. LC conditions deviation range in the robustness testing and the relevant system specifications.
Method Performance
A PDA library was created in Empower 3 CDS to archive the UV/Vis spectra of each standard and their retention times. Peaks were identified by the retention times and the UV/Vis spectra. The peak purity function in Empower was also used to confirm there was no co-elution of peaks. Since SG shared similar UV/Vis spectra, the retention times were found the most reliable parameter in peak identification (for SG where standards were available).
The linear relationship between the peak area and the concentration was demonstrated for all 15 SG (Table 6). The calibration curves (lines) were fitted by the least square regression model. A coefficient of determination (R2) of at least 0.999 was obtained for all compounds. The limit of quantification (LOQ) for these compounds were estimated at ten times the standard deviation (n=5) in response (peak area) obtained at the lowest concentration level in calibration divided by the slope of calibration curve. The estimated LOQs are in the range of 0.001 to 0.004 mg/mL. (Table 6).
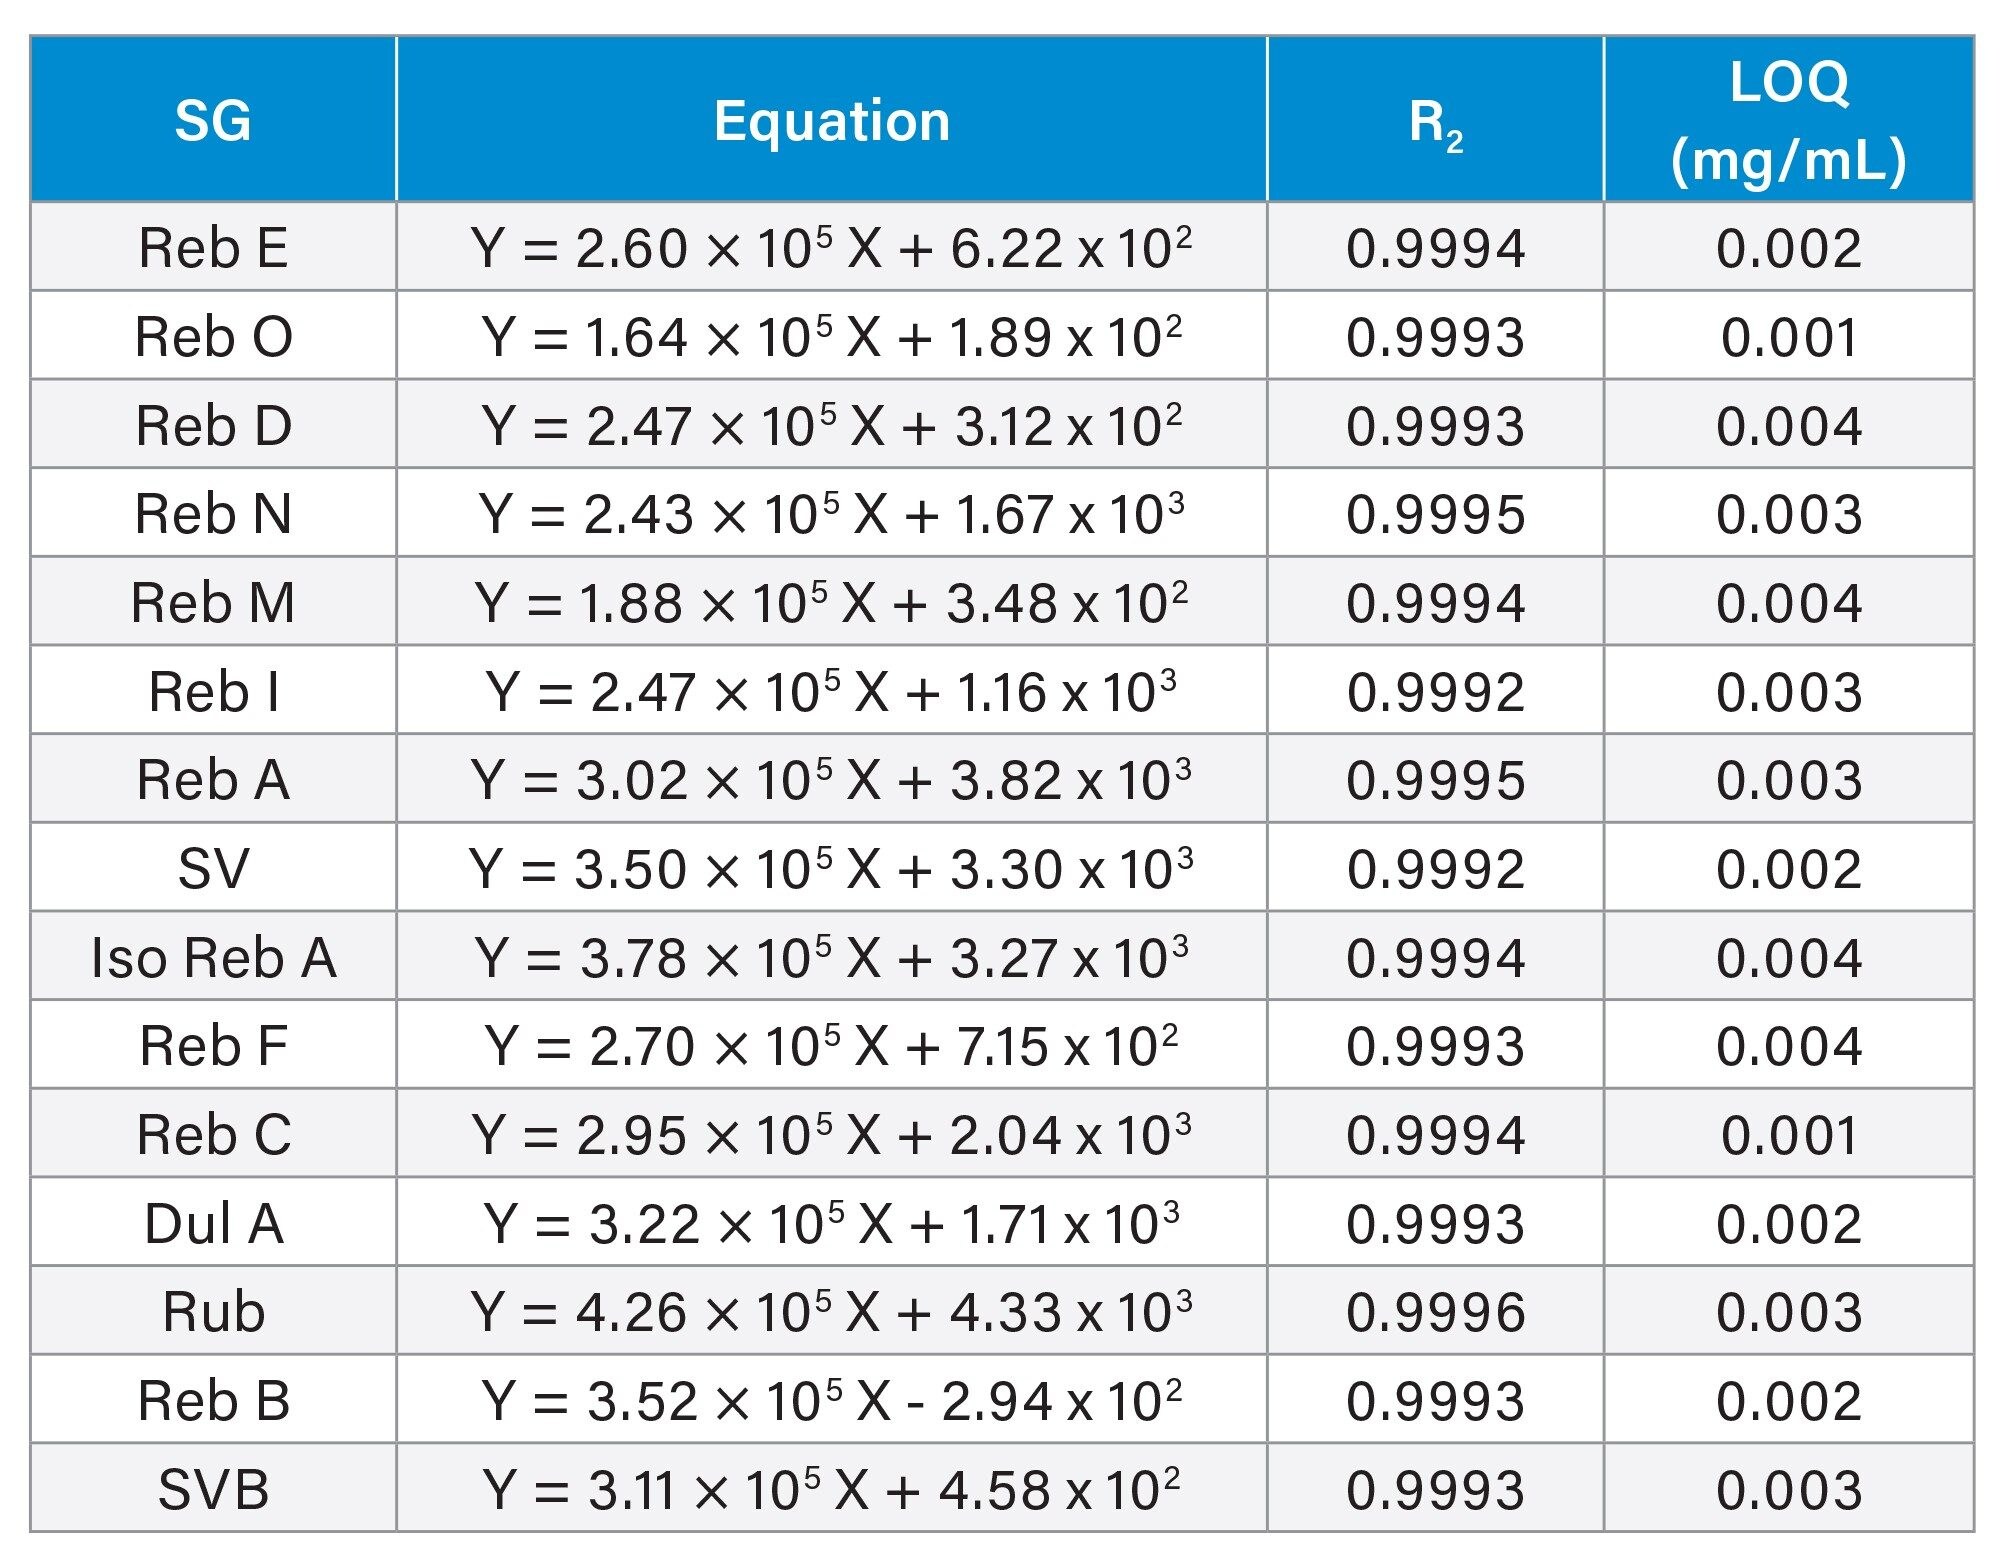 Table 6. Linear relationship between the peak area and the concentration and the estimated limit of quantification.
The accuracy of analysis was evaluated by spiking SG (Reb N and Reb M) at two spiking levels on three samples that come in different forms (liquid and powder) and various ingredients (see Table 1 for sample details). Table 7. shows the spiking results. In most cases, the mean recovery (n=2) data were within 100±10%, the exception was one result for Reb M at low spiking level in sample B (111.8%).
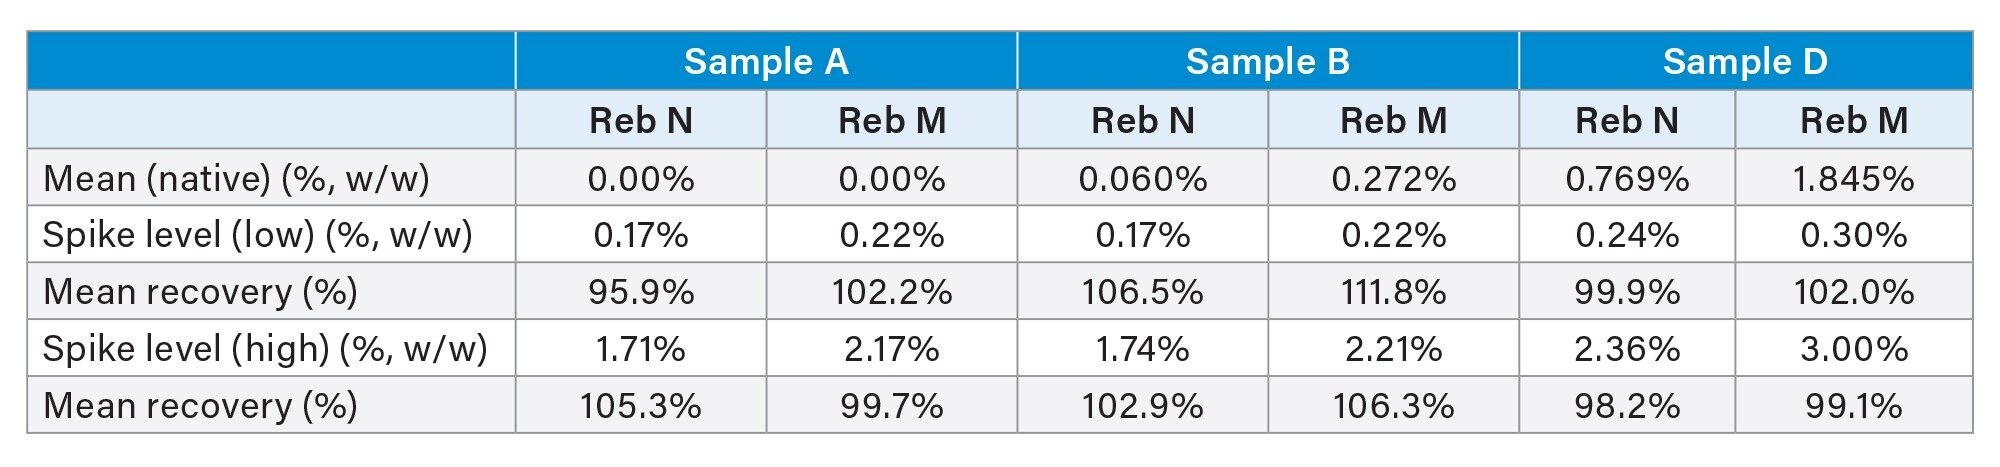 Table 7. Spiking recovery results on three sample matrices for steviol glycosides.
The precision in retention time was evaluated using a QC standard in sample analysis. The relative standard deviation in retention times for 15 SG were in the range from 0.15% to 0.33% (results not shown).
The method robustness was evaluated during method development as previously discussed (see Method Development section). Furthermore, this method was tested on two additional HSS T3 columns that had minor variations in column hardware. One was a XSelect Premier HSS T3 VanGuard FIT Column (2.5 µm, 4.6 mm x 150 mm) which was fitted with a Guard Column (2.5 µm, 3.9 x 5 mm). The other one was a XSelect HSS T3 Column (2.5 µm, 4.6 mm x 150 mm) which was packed in a conventional stainless-steel hardware (no MaxPeak™ High Performance Surface). The packing materials and the column dimensions were essentially the same for all these columns. The results are compared in Table 8. Excellent resolutions were obtained on all three columns (2.5 µm) with the minimum resolutions of 1.51 for the critical pair (Reb A/SV) and 1.89 for rest of SG. The columns with MaxPeak High Performance Surface (Premier Columns) showed better resolutions than the conventional column (with the same particle size), more details on the benefits of the MaxPeak High Performance Surface for this analysis are discussed elsewhere.8 The results obtained on a sub-2 micron particle column (ACQUITY UPLC HSS T3 Column) was also included in Table 8. These results will be discussed in the last section.
 Table 8. Resolutions for LC-UV separation of steviol glycosides on various HSS T3 Columns.
Sample Analysis
Stevia extract samples were analyzed using the developed method (chromatographic conditions for 2.5 µm particle-size columns shown in the Experimental section) and results are shown in Table 9. HPLC-UV chromatograms of standard mix and samples are shown in Figure 4. Sample A shows a simple SG profile with Reb A as the major component. Other samples such as B, C, D, F, show more complicated SG chromatographic profiles. There are many peaks (probably minor SG) in these samples that could not be identified by this HPLC-UV method. A mass spectrometer, as recommended by the JECFA Monograph 26, may be needed to help with compound identification in the analysis of stevia extract with such complex SG profiles.
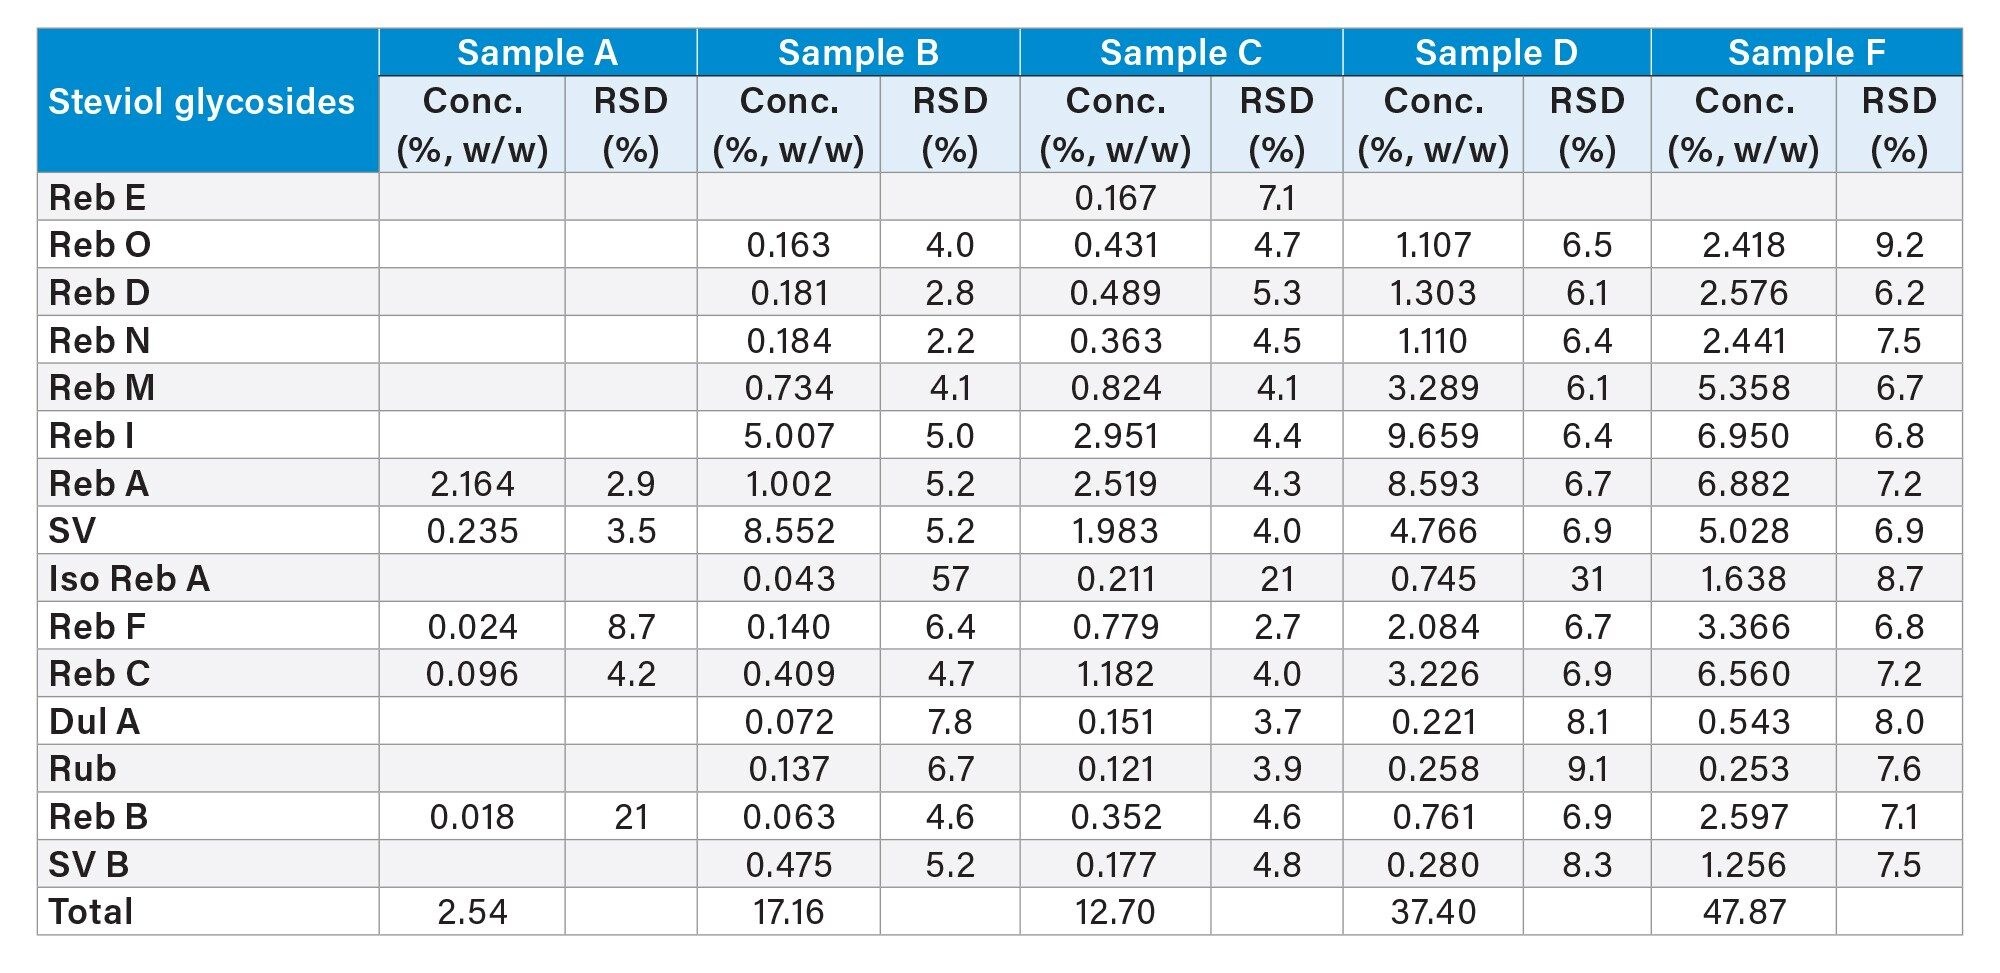 Table 9. Stevia Extract sample analysis results summary.
 Figure 4. HPLC-UV chromatograms of 15 steviol glycoside standard mixture and stevia extract products (Sample A, B, C, D, F) on Xselect Premier HSS T3 VanGuard FIT Column (2.5 µm, 4.6 mm x 150 mm) under the developed conditions.
Further Improvement on Resolution Through the Use of Sub-2 Micron Columns
As shown in Figure 4, the complex SG profiles in stevia extracts demand even higher chromatographic resolution. To achieve higher resolution, this developed method was transferred to a sub-2 micron column with the same stationary phase (ACQUITY UPLC HSS T3 Column, 1.8 µm, 3 x 150 mm) and the gradient elution parameters were converted to new parameters for the 1.8 µm particle-sized column (3 x 150 mm) using a Column Calculator App (ver 2.0, Waters™ Corp.; details of sub-2 micron particle-size columns and related chromatographic conditions are listed under in the Experimental section). Using the sub-2 micron column, resolution of at least 2.0 was achieved for all SG pairs (see Table 8). The smaller particle sizes and larger column-length to particle-size ratio (L/dp) helped to improve the chromatographic resolution. The ACQUITY UPLC HSS T3 Column could be a better choice when ultimate chromatographic resolution is needed in SG analysis. Please note that the MaxPeak High Performance Surface version of the ACQUITY UPLC HSS T3 Column was not available when this study was conducted.
Conclusion
We optimized a JECFA gradient LC-UV method for the analysis of steviol glycosides on an Arc Premier System coupled with a 2998 PDA Detector and an XSelect Premier HSS T3 Column. Chromatographic resolution of SG has been significantly improved. Resolution of 1.5 and higher for the critical pair (Reb A/SV) was reliably achieved on the XSelect Premier HSS T3 Columns (2.5 µm, 4.6 mm x 150 mm), and resolution of 2.0 (for the same critical pair) was achieved on an ACQUITY UPLC HSS T3 Column (1.8 µm, 3 mm x 150 mm). Excellent analytical performance in linearity, sensitivity, accuracy, precision, and robustness has also been demonstrated. This developed method could be a useful alternative method for the analysis of steviol glycosides.
References
- FAO and WHO. 2021. Compendium of Food Additive Specifications. Joint FAO/WHO Expert Committee on Food Additives (JECFA), 91st Meeting – Virtual meeting, 1–12 February 2021. FAO JECFA Monographs No. 26. Rome. https://doi.org/10.4060/cb4737en.
- Prakash, I.; Markosyan, A.; and Bunders, C. Development of Next Generation Stevia Sweetener: Rebaudioside M. Foods 2014, 3, 162–175; doi: 10.3390/foods3010162.
- Bartholomees, U.; Struyf, T.; Lauwers, O.; Ceunen, S.; Geuns, J. M. C. Validation of an HPLC Method for Direct Measurement of Steviol Equivalents in Foods. Food Chem. 2016, 190, 270–275.
- Bergs, D.; Burghoff, B.; Joehnck, M.; Martin, G.; Schembecker, G. Fast and Isocratic HPLC-Method for Steviol Glycosides Analysis from Stevia Rebaudiana Leaves. J. Verbraucherschutz Lebensmittelsicherh. 2012, 7, 147–154.
- Zimmermann, B.F. Beaming steviol Glycoside Analysis into the Next Dimension. Food Chem. 2018, 241, 150–153.
- Gardana, C.; Scaglianti, M.; and Simonetti, P. Evaluation of steviol and its Glycosides in Stevia Rebaudiana Leaves and Commercial Sweetener by Ultra-High-Performance Liquid Chromatography-Mass Spectrometry. J. Chromatogr. A 1217 (2010) 1463–1470.
- ICH. Analytical Procedure Development Q14, (Final Version, 1 Nov 2023) https://database.ich.org/sites/default/files/ICH_Q14_Guideline_2023_1116.pdf. Accessed 1 January 2024.
- Yang, J; Rainville, P.; Harden, S. Reversed-Phase Liquid Chromatography of Steviol Glycosides - Benefits of MaxPeak High Performance Surfaces. Waters Application Brief, 720008234, 2024.
720008236, February 2024