• Application Note

Quantification of Polysorbate Using the ACQUITY UPLC H-Class Bio System with ELS Detection

Quantification of Polysorbate Using the ACQUITY UPLC H-Class Bio System with ELS Detection

  • Sean M. McCarthy
  • Waters Corporation

Abstract

The analysis of detergents in biopharmaceutical formulations is a required but often challenging task in the laboratory. The ACQUITY UPLC H-Class System with ELSD and column manager in a trap-and-elute configuration provides a comprehensive system for performing these analyses. As shown, the integrated valves on the ACQUITY UPLC Column Manager provides reproducible results without the need for additional external switching valves. In addition, the ACQUITY UPLC ELSD yields a linear response for quantification.

Benefits

The ACQUITY UPLC H-Class Bio System, configured with an ACQUITY UPLC Column Manager and ACQUITY UPLC ELS Detector, is an ideal system for the quantification of detergents commonly used in biopharmaceutical formulations.

Introduction

Biotherapeutics formulations are complex and their composition is tightly controlled to ensure product stability, and efficacy. Formulations of biotherapeutics contain detergents that are used to prevent denaturation and aggregation of the active pharmaceutical ingredient. Of the detergents used, polysorbates 20 and 80 are very common due to their low toxicity and biocompatibility.

By their nature, polysorbates are structurally and chemically heterogeneous mixtures of species, making their quantification challenging. There are recent reports that demonstrate the use of a trap-and-elute strategy for detergent analysis in formulated biopharmaceuticals.1 Often, analysis of detergent in formulated samples is necessary to ensure stability of the detergents. These strategies provide a rapid and robust process for separating the therapeutic and other excipients from the detergent in the formulation.

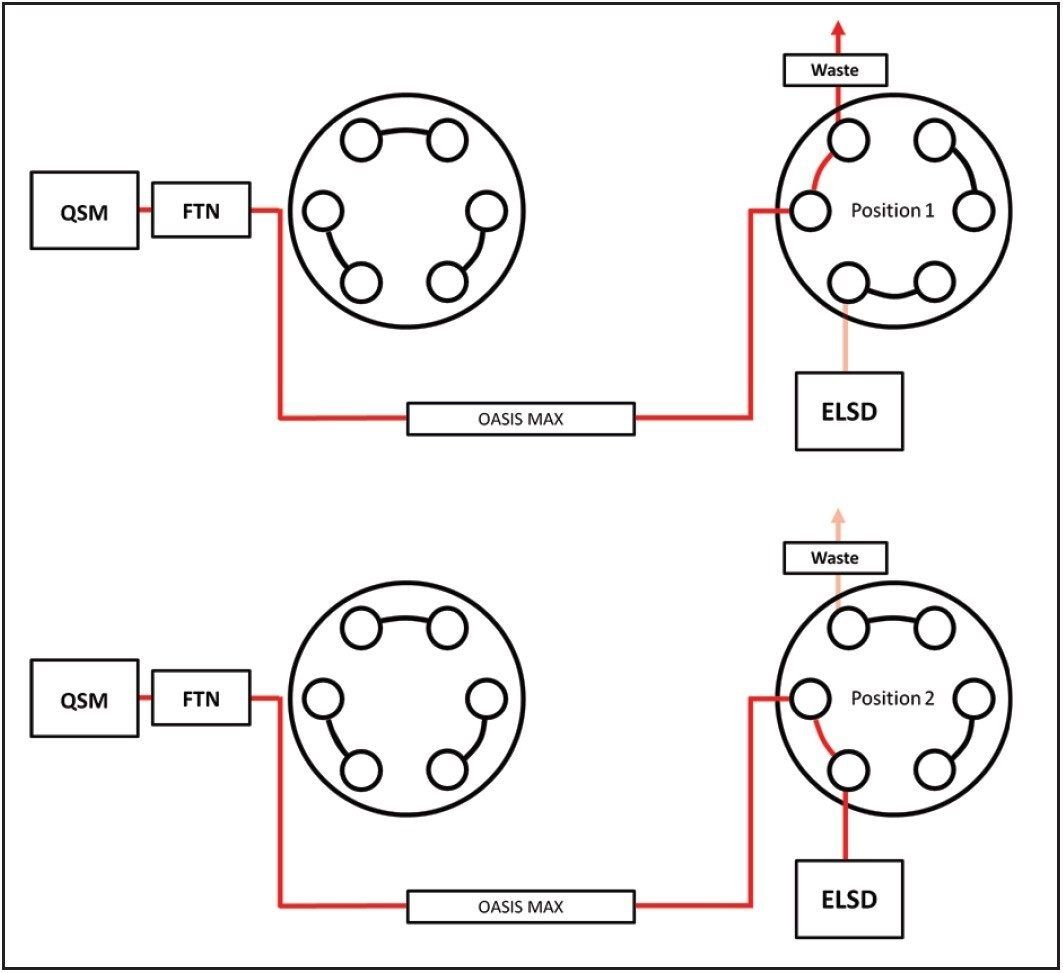
In this work, we present the use of the ACQUITY UPLC H-Class Bio System with a Column Manager and an evaporative light scattering detector (ELSD) for determining the concentration of polysorbate in formulated samples. Using the mixed-mode Oasis MAX online cartridge, we effectively trap polysorbate at low pH while the therapeutic and other excipients are unretained. Using the ACQUITY UPLC Column Manager equipped with a switching valve, unretained components are diverted to waste, then the valve position is changed so flow is directed to the ELSD prior to elution of polysorbate from the column. The proposed workflow represents a straightforward and efficient method for analyzing polysorbate content in biotherapeutic formulations.

Experimental

Polysorbate 20, Polysorbate 80, and bovine serum albumin were purchased from Sigma Aldrich. Stock solutions of each were prepared in Milli-Q water at 1 mg/mL. Stock solutions were prepared for each polysorbate as follows: 0.4, 0.3, 0.2, 0.1, and 0.05 mg/mL for polysorbate 20 and 0.3, 0.2, 0.1, 0.05, and 0.025 mg/mL for polysorbate 80. Each sample was spiked with bovine serum albumin to a concentration to 30 mg/mL.

LC Conditions

Mobile phase A:

2% formic acid in water

Mobile phase B:

2% formic acid in isopropanol

Seal wash:

10% acetonitrile in water

Seal wash period:

5 min.

Advanced mode:

For plumbing diagram, see Figure 1

Column:

Oasis MAX, 30 μm, 2.1 x 20 mm

Gradient:

Time

Flow (mL/min)

%A

%B

%C

%D

Curve

Initial

1.0

90

10

0

0

Initial

1.0

1.0

80

20

0

0

6

3.4

1.0

80

20

0

0

6

3.5

1.0

0

100

0

0

6

4.5

1.0

0

100

0

0

6

4.6

1.0

90

10

0

0

6

6.6

1.0

90

10

0

0

6

Events:

Time(min)

Event

Action

2.8

Right valve

Position 2

6.5

Right valve

Position 1

ELSD

Gain:

100

Data rate:

2 pps

Time constant:

Slow

Mode:

Heating

Power level:

75%

Temp.:

80 °C

Gas pressure:

20 psi (1.64 slpm)

Results and Discussion

Instrument configuration and plumbing

To prevent fouling of the ELS detector, we configured our system to efficiently divert unretained protein and other excipient material to waste following injection. This was accomplished using 6-port, 2-position valves in the column manager while operating in advanced mode. As shown in Figure 1, the right valve is configured so that the LC flow can be directed as needed during the separation. In position 1 (top) LC flow is directed to waste. In position 2 (bottom) LC flow is directed to the ELS detector. At the end of the separation, the valve is returned to position 1 for the following injection. Programming the valve switch is accomplished within the inlet method editor without the need for additional components or connections.

Figure 1. Fluidic diagram of column manager.

Evaluation of chromatographic reproducibility

For routine use, methods used for quantitation need to be reproducible in retention time and area. Since our configuration utilized both a trap-and-elute method as well as a diversion valve, we evaluated the reproducibility of the separation at each of the mass load levels for polysorbate 20 and 80.

Shown in Figure 2 is an overlay of triplicate injections for each polysorbate 80 standard prepared as described above, containing 30 mg/mL protein with varying levels of polysorbate. As shown, the separations are reproducible both within and between polysorbate concentrations. From this data we determined that both the instrument and the plumbing configuration used were acceptable for routine polysorbate analysis.

Figure 2. Overlay of triplicate injections of polysorbate 80 at five concentration levels.

Evaluation of assay linearity

After determining that our system configuration was suitable for polysorbate analysis, we generated calibration curves for polysorbate 20 and 80. The calibration curves were constructed in Empower 3 Software using Quickset and defining concentration levels. The data was then processed using a basic processing method and the calibration curve was generated within Empower. The data was plotted using a log vs. log scale, yielding a linear relationship between concentration and response. As shown in Figures 3 and 4, excellent linearity was achieved for polysorbate 20 and 80, respectively.

Figure 3. Polysorbate 20 calibration curve. Data points were collected in triplicate.
Figure 4. Polysorbate 80 calibration curve. Data points were collected in triplicate.

Conclusion

The analysis of detergents in biopharmaceutical formulations is a required but often challenging task in the laboratory. The ACQUITY UPLC H-Class System with ELSD and column manager in a trap-and-elute configuration provides a comprehensive system for performing these analyses. As shown, the integrated valves on the ACQUITY UPLC Column Manager provides reproducible results without the need for additional external switching valves. In addition, the ACQUITY UPLC ELSD yields a linear response for quantification.

References

  1. Hewitt D, Zhang T, Kao YH. Quantitation of polysorbate 20 in protein solutions using mixed-mode chromatography and evaporative light scattering detection. J Chromatogr A. 2008 Dec 26;1215(1–2):156 60. doi: 10.1016/j.chroma.2008.11.017.
  2. Megoulas NC, Koupparis MA. Twenty years of evaporative light scattering detection. Crit. Rev. Anal. Chem. 2005;35:301–16.

720005323, March 2015

Back To Top Back To Top