This is an Application Brief and does not contain a detailed Experimental section.
This Application brief demonstrates Tof MRM acquisition of commercially available peptide mixture MSQC1 using ionKey/Xevo G2-XS QTof platform for peptide bioanalysis.
Quantitation for serial diluted samples shows ionKey/Xevo G2-XS is well suited for peptide characterization and quantitation with excellent sensitivity and linear response.
The rise of biotherapeutics in the drug discovery and development pipeline has resulted in the increasing demand for protein/peptide bioanalysis by LC-MS techniques. This has led to a renewed interest in high resolution mass spectrometry (HRMS) platforms for use in quantitation because they enable both a larger mass range and additional options for selectivity. HRMS platforms retain the ability to quickly switch back to characterization mode to elucidate or resolve qualitative, underlying matrix issues with the assay. In this way, both peptide mapping and quantitation can be performed on the same platform.
In addition to full scan data acquisition, newer targeted HRMS modes enable faster tandem-like throughput, while avoiding some of the complexity of full scan approaches. Currently, quantitation through a surrogate peptide approach remains the most popular practice for large molecule bioanalysis. In this approach, proteins and peptides are prepared through enzyme digestion. The resulting mixture is analyzed first to map out peptides thus formed and to search for signature peptides. Informatics tools such as Skyline are tailored for developing quantitative methods.
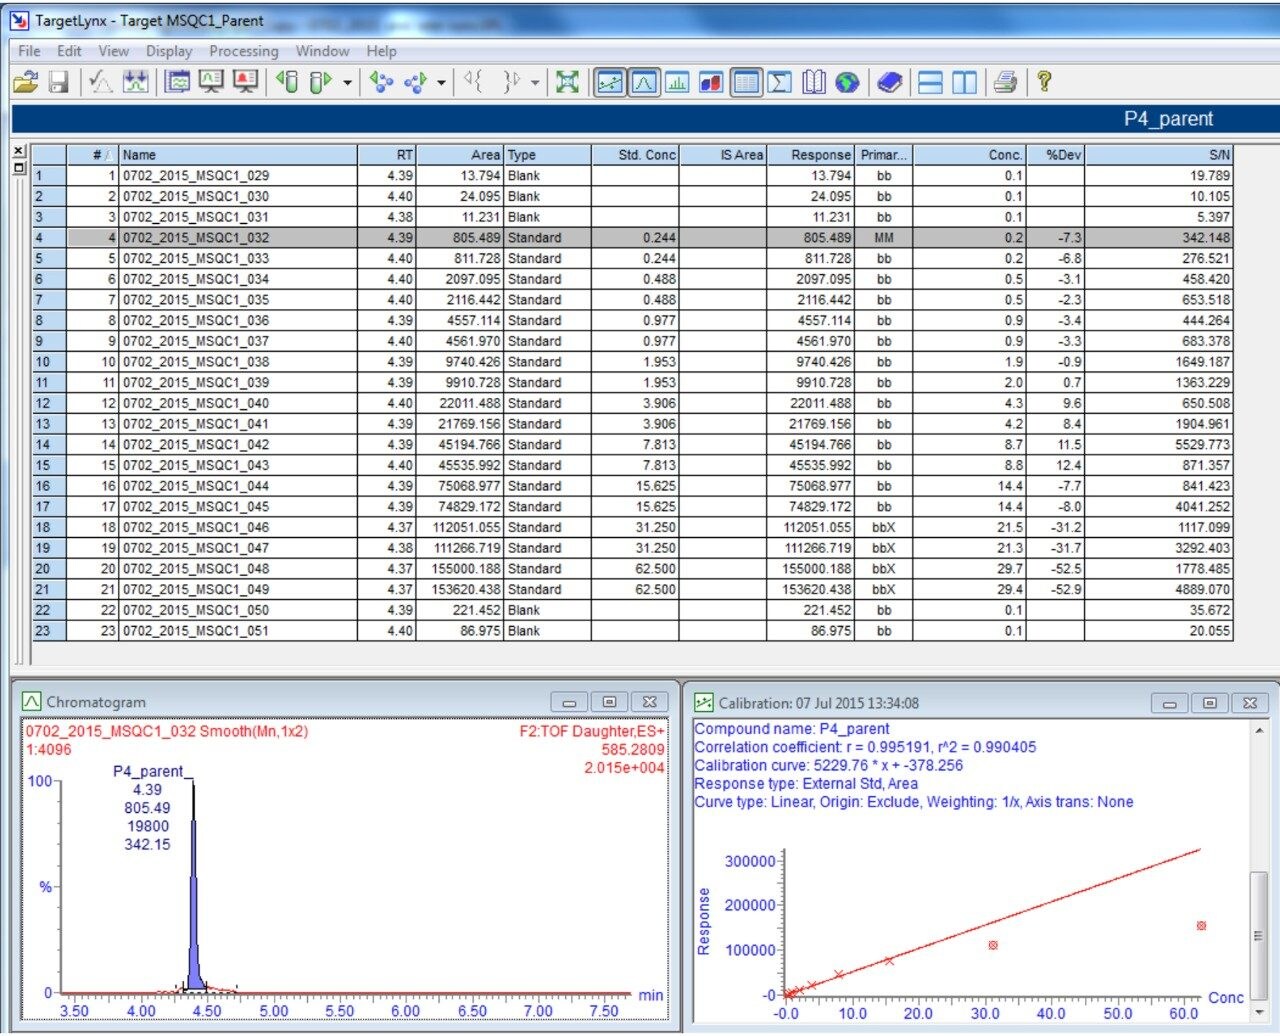
Once the signature peptides are identified, subsequent peptide quantitation is carried out using either tandem quadrupoles or high resolution mass spectrometers.
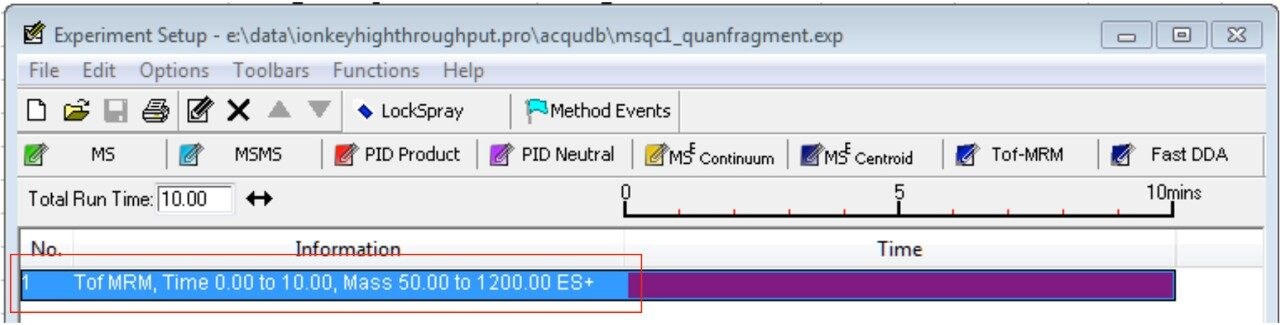
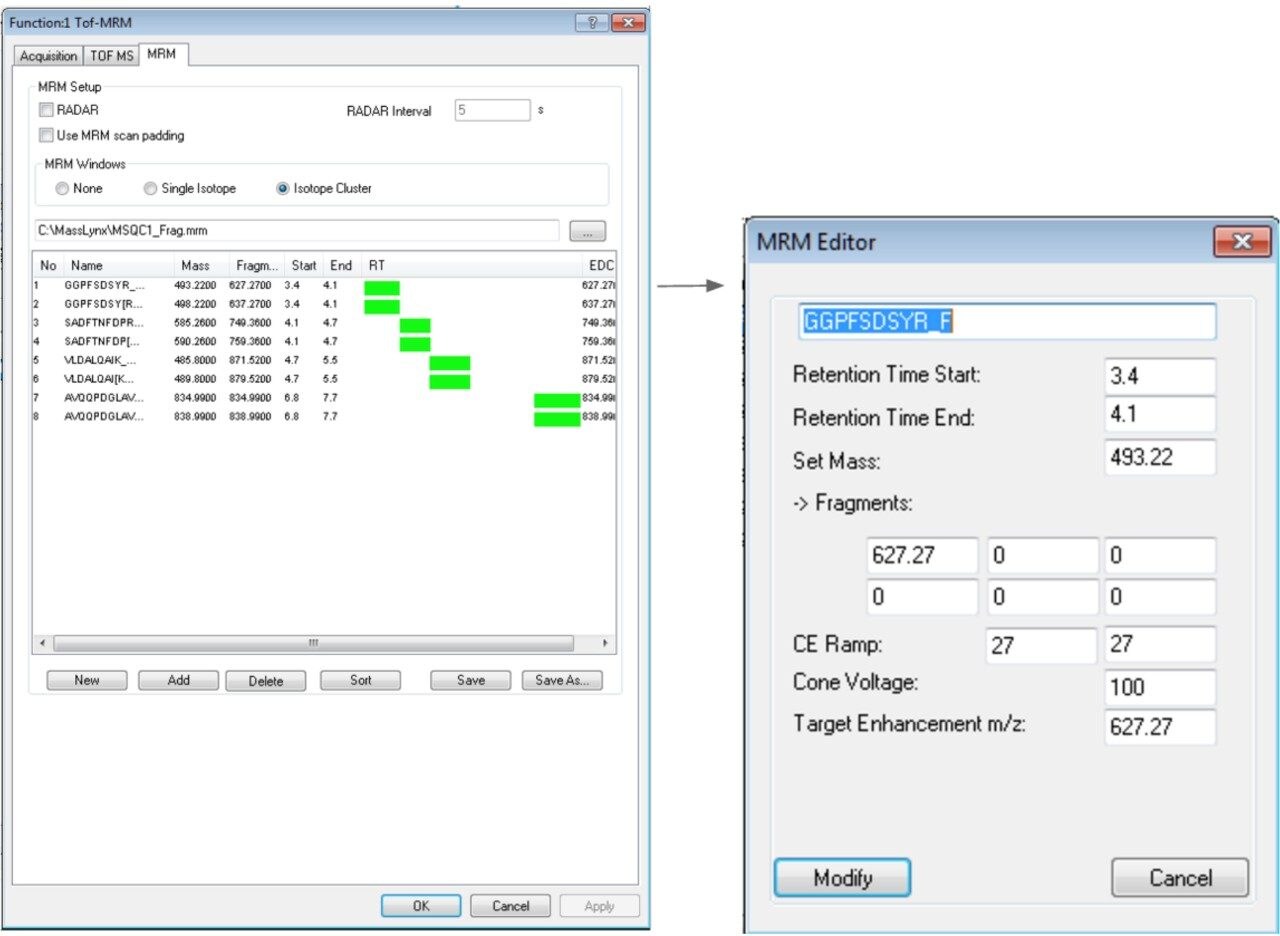
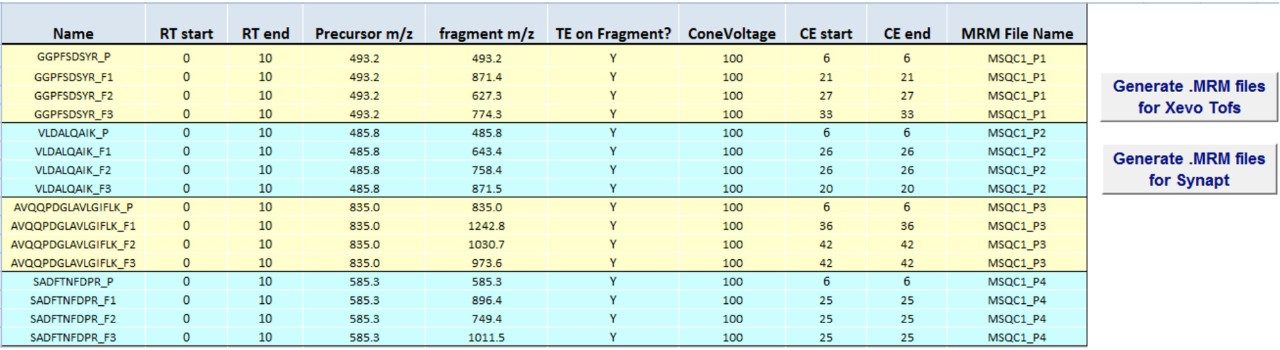
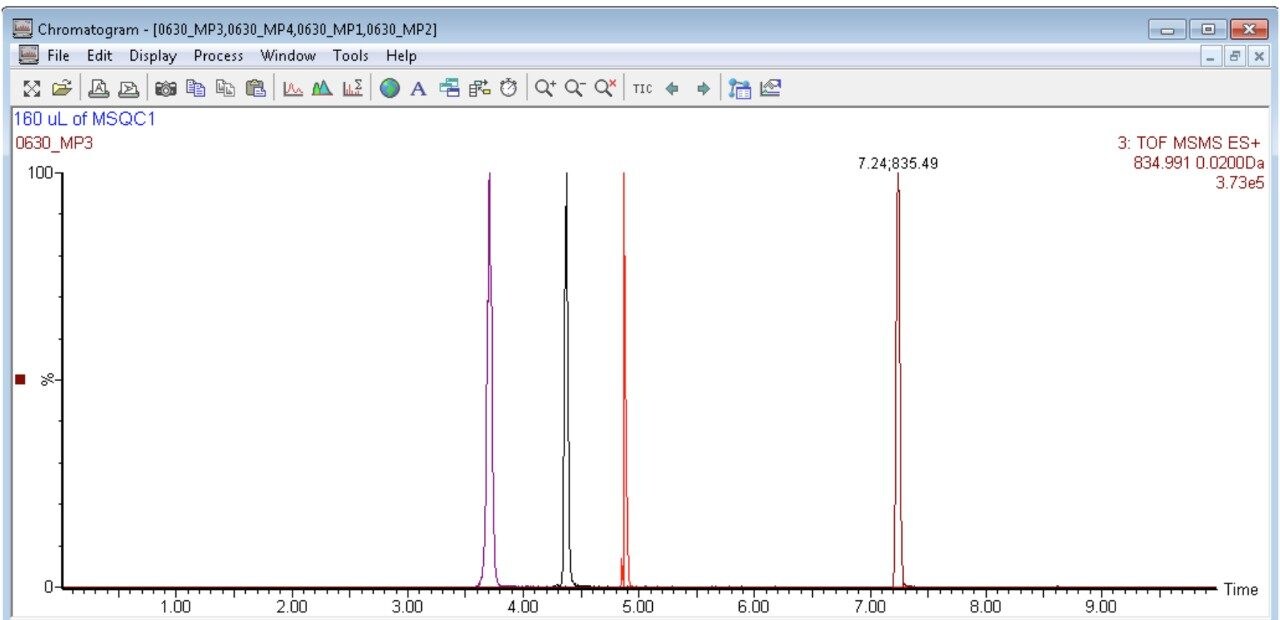
In this app brief, peptide quantitation using HRMS is demonstrated using ionKey/MS and Xevo G2-XS with Tof MRM mode for data acquisition (although the acquisition/data processing is amenable to all inlets available at Waters). Tof MRM, or target enhancement mode of acquisition, provides a selectivity and sensitivity boost for enhanced HRMS quantitation. Microfluidics such as ionKey also produce enhanced selectivity and sensitivity across small and large molecules, particularly with intact molecule characterization for both surrogate and intact quantitation.
A commercially available peptide mixture called MSQC1 (Sigma Aldrich) is used in the present study. Peptide composition of the mixture, its sequence, and corresponding light/heavy (L/H) stable isotope ratios are summarized in Table 1. The mixture is frequently used by labs as QC standards before running peptides of interest. Table 2 is a summary of the first four peptides which are used to describe the process of creating Tof MRM methods and building a targeted Tof MRM HRMS method.
Results are described in three sections:
I – Setting up a Tof MRM experiment in MassLynx
II – Developing a Tof MRM scouting experiment to identify the best peptide transitions and also the best conditions (CE) to monitor the peptide
III – Quantification using TargetLynx
Step 1. Open MS method editor and choose “Tof-MRM” function. A function line appears in the function table as shown in Figure 1.
Step 2. Click on the function to open a new window/dialog. In the first tab, “Acquisition,” enter acquisition time, polarity, etc. as shown in Figure 2a. Next, click on the “TOF MS” tab and enter mass range and scan time as shown in Figure 2b. Mass ranges from 50 to 1200 or 50 to 2000 m/z and scan time of 0.1 s are typical. Scan time should be adjusted based on run time and peak width to ensure a minimum of 10 data points base-to-base are collected across the peaks for the number of MRMs scanning concurrently.
Compound information is entered in the third tab called “MRM” as shown in Figure 3. In this tab, choosing the “Add” button opens the MRM editor. Enter the time window and set mass, CE, CV, and “Target Enhancement m/z” to the appropriate cells shown. Additional fragments may be entered for monitoring, but typically only one is chosen for maximum sensitivity and entered in fragment box 1. “Set Mass” and “Target enhancement m/z” are critical for data acquisition. Repeat this process for all the transitions of interest. In this example four peptides along with their internal standards are being monitored. A time window is entered for each peptide providing maximum signal for each pair. For the time window, ending at 1.0 min and starting next at 1.0 min is considered overlapping, which results in two traces of data. Try to start the second window at 1.01 min to produce one data trace.
Once all information is entered, click “Save” to store the MRM table as a “.mrm” file. A .mrm file is a collection of compounds, time window, and other information shown in the MRM editor page. Once it is created, it can be imported to easily create the MRM function. An Excel Macro file to help generate .mrm files is freely available from Waters upon request.
Because data acquisition reads from the .mrm file, if the “Save” button is not clicked, any modified information is not used. If one also wants to collect full scan spectrum simultaneously, the “RADAR” box should be checked (note: this reduces the duty cycle and is recommended for method development, but not final assay method). MRM window choices describe the tolerance of data shown with the target enhancement region of about 50 Da around the target mass. “None” indicates the entire 50 Da range centered around ion of interest; “single isotope” only retains the single isotope (1 Da), the “isotope cluster” retains a 5 Da window. In all cases, the data can be further extracted during the XIC creation to an HRMS mDa tolerance, thus further increasing specificity of the extracted ion chromatogram (XIC).
The first set of MRM experiments is carried out to select the best transitions for eventual quantitation for each of the peptides. The transitions tested are the three precursor>fragment transitions provided in the catalog (Table 2), and a fourth transition based on precursor>precursor without fragmentation (tuneless transition). A spreadsheet containing the transitions is shown (Figure 4) and when translated to a .mrm file it can be imported or transcribed into the Tof MRM method editor.
A resulting XIC for each of the peptides is then overlaid. Peptide 1 and peptide 2 are shown in Figure 5 and Figure 6 as an example. As expected, the precursor>precursor transition produces the highest signal for all four peptides. In this example the precursor>precursor transition and one of the precursor>fragment transitions with the highest response for subsequent quantitation and instrument performance check are chosen.
A standard curve is prepared for MSQC1 by successive 1:2 dilutions based on instruction from Sigma Aldrich. The range of the dilution starts with 1:16 down to 1:4096 fold. Four peptides are monitored simultaneously according to the time window shown in Figure 3. A sample chromatogram is shown in Figure 7. Gradient conditions for ionKey are shown in Figure 8.
Figure 9 shows TargetLynx results of Peptide 4 based on precursor>precursor transition. A good linear range from 1:64 to 1:4096 fold dilution is obtained with R2 = 0.99. Above 1:64 fold, the signal suggests saturation of the mass detector. At the lowest prepared concentration of 1:4096 fold, the average signal-to-noise ratio is 310, indicating low detection limit has not been reached and the mass spec is capable of detecting sample at lower concentration.
Figure 10 shows TargetLynx results of Peptide 4 based on isotope labeled precursor>precursor transition. As expected, the lower abundance of the labeled peptide produces a lower response. The linear range now extends to all concentrations with no signal saturation at higher concentration. An R2 of 0.99 is also obtained. The average signal-to-noise ratio at 1:4096 fold dilution is 25 which is expected based on lower response observed.
Tof MRM mode of data acquisition provides an effective approach for analyte quantitation using HRMS. Setting up the Tof MRM MS method is straightforward. In the present example, Tof MRM mode of data acquisition is used for the identification of the monitoring mass of a representative peptide in MSQC1. Subsequent quantitation for serial diluted samples shows that the ionKey/Xevo G2-XS is well suited for the peptide characterization and quantitation with excellent sensitivity and linear response. In this way, one can go from characterization to high performance quantitative method using a single MS platform. The use of a simple turnkey microfluidics technology such as ionKey offers high sensitivity. In summary, the coupling of targeted HRMS (Tof MRM with target enhancement) on the Xevo G2-XS HRMS QTof with ionKey microfluidics, offers a powerful, simple workflow for HRMS peptide bioanalysis.
720005593, February 2016