‘Dioxins’ refers to a group of chemical compounds that share certain similar chemical structures and biological characteristics. Several hundred of these toxic compounds exist and are members of three closely related families: the polychlorinated dibenzop-dioxins (PCDDs), polychlorinated dibenzofurans (PCDFs), and certain polychlorinated biphenyls (PCBs).
Sometimes the term dioxin is also used to refer to the best studied and one of the most toxic dioxins, 2, 3, 7, 8-tetrachlorodibenzo-p-dioxin (TCDD). PCDDs and PCDFs are not created intentionally, but are produced inadvertently by a number of human activities. Natural processes also produce PCDDs and PCDFs.
Over the past decade, regulatory environmental agencies and industries have worked together to dramatically reduce dioxin emissions. Because dioxins are extremely persistent compounds, levels of dioxins still exist in the environment from both man-made and natural sources and will take years to decline.
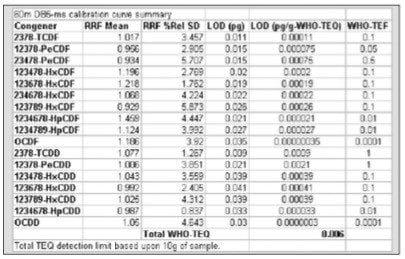
The detection and quantification of dioxins is a particularly demanding analysis due to the low level of regulatory exposure limits and the variety of complex sample matrices encountered. High Resolution Gas Chromatography (HRGC), coupled with High Resolution Mass Spectrometry (HRMS) offers the high sensitivity, selectivity, and quantitative dynamic range for this application and as such, is the technique of choice.
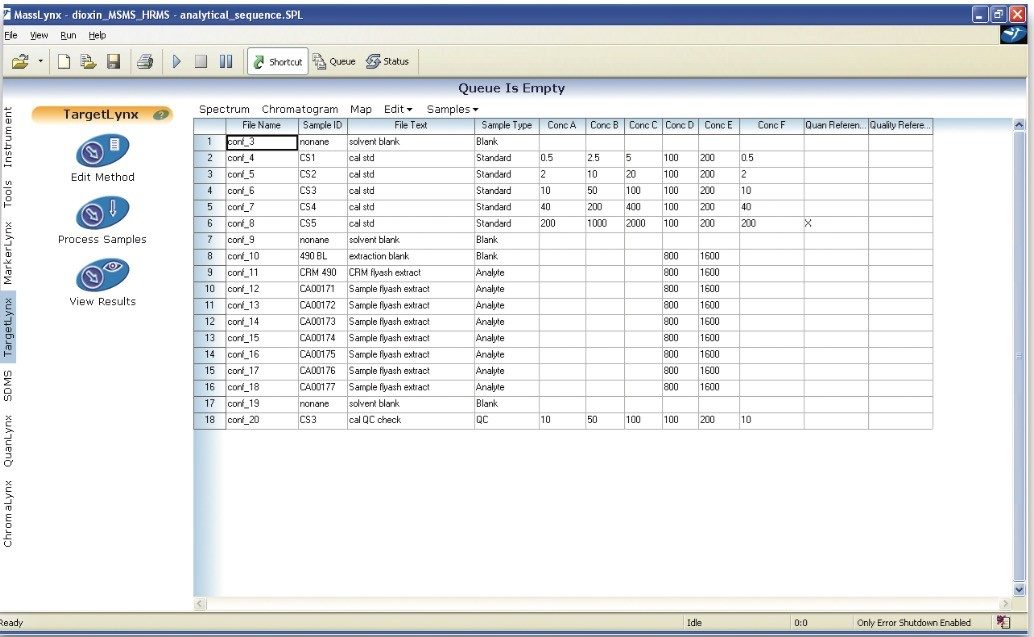
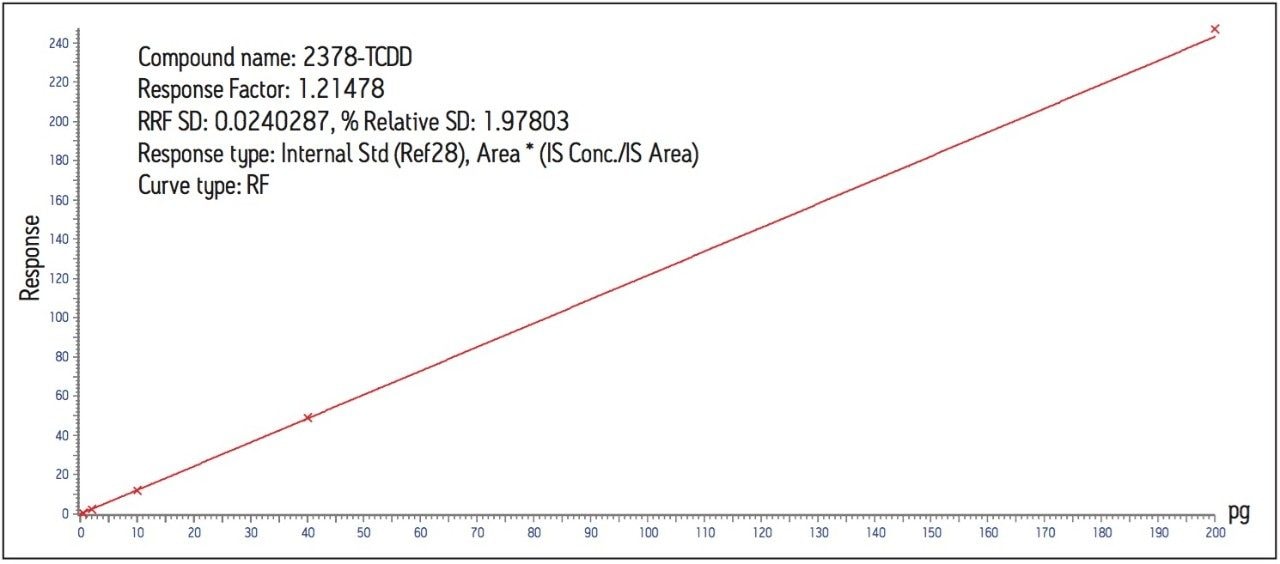
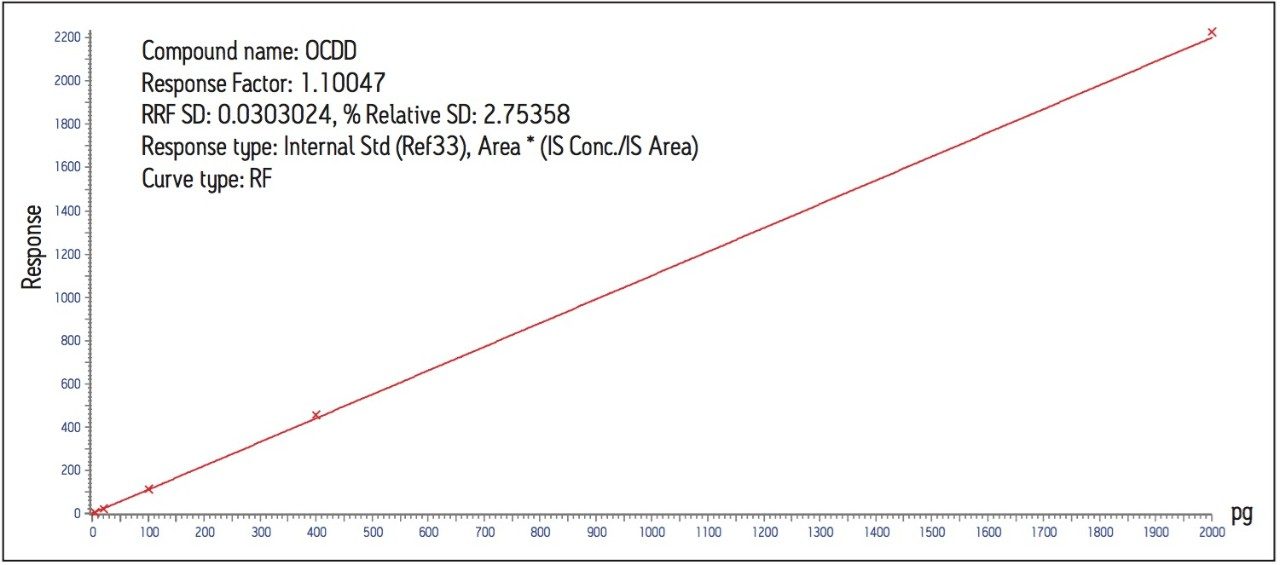
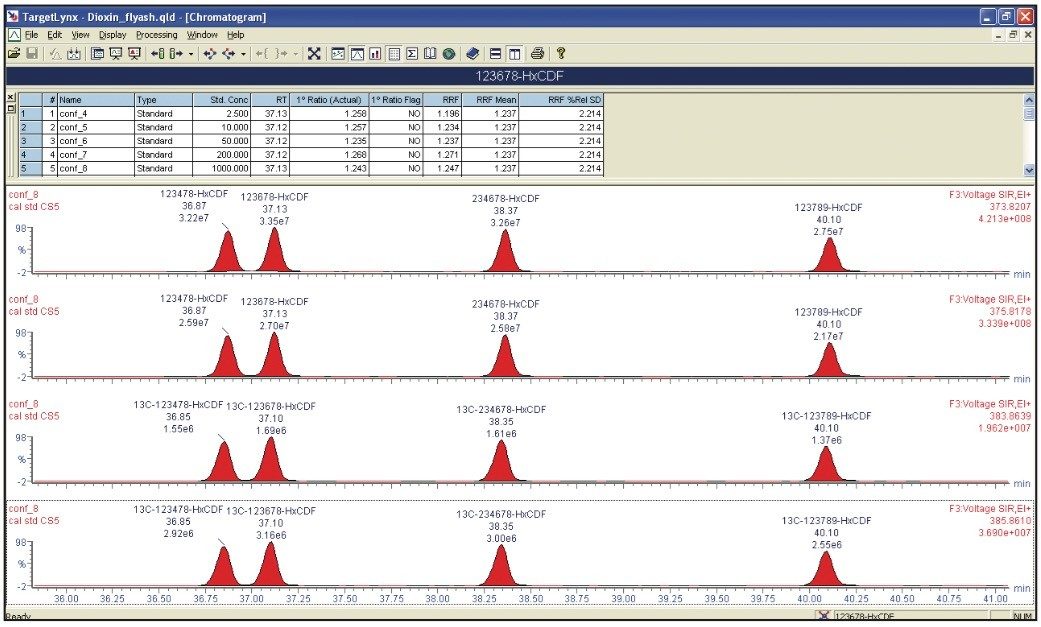
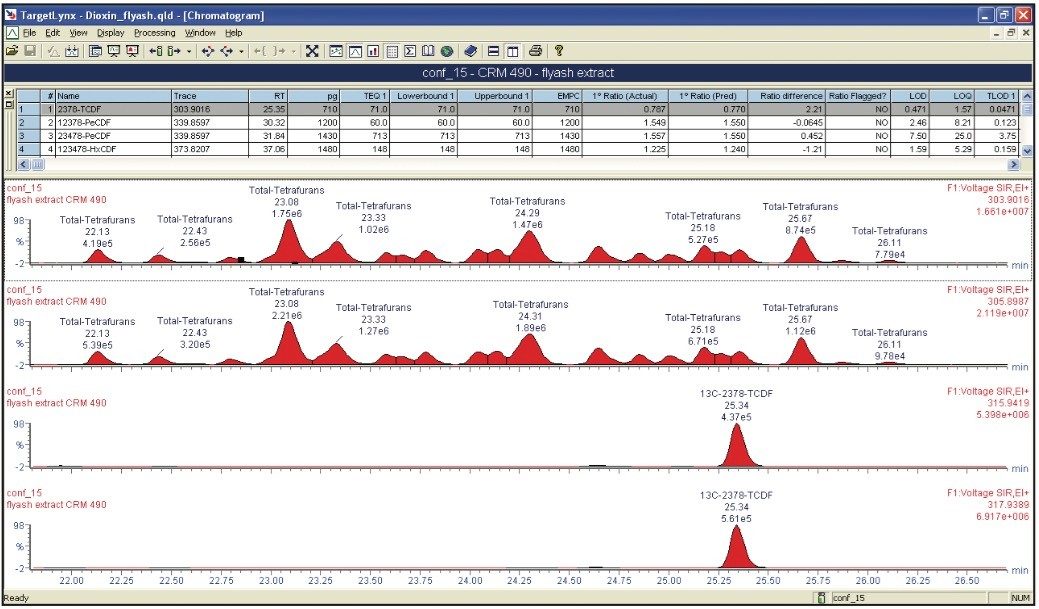
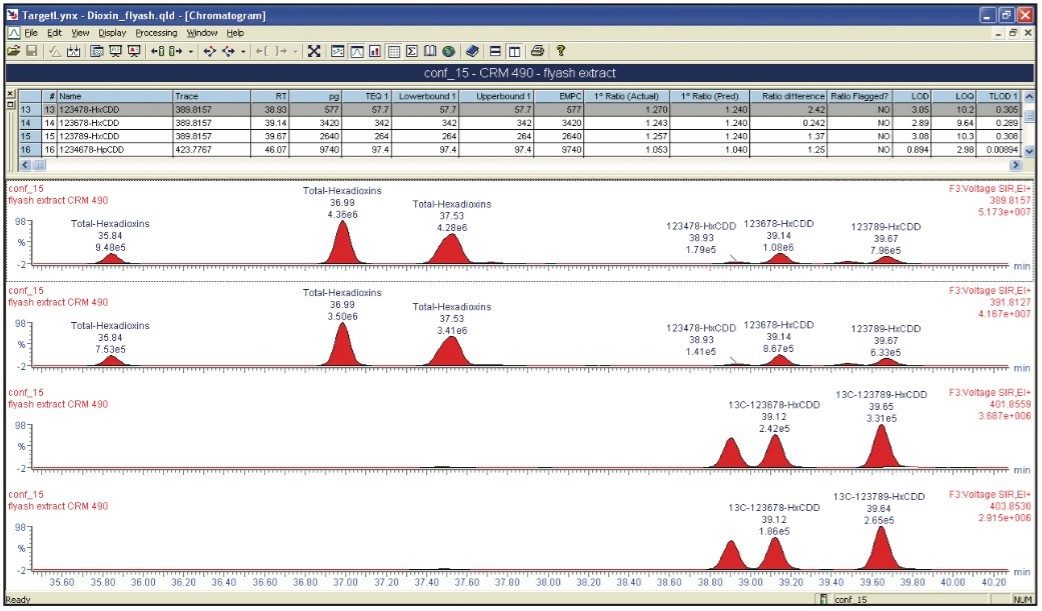
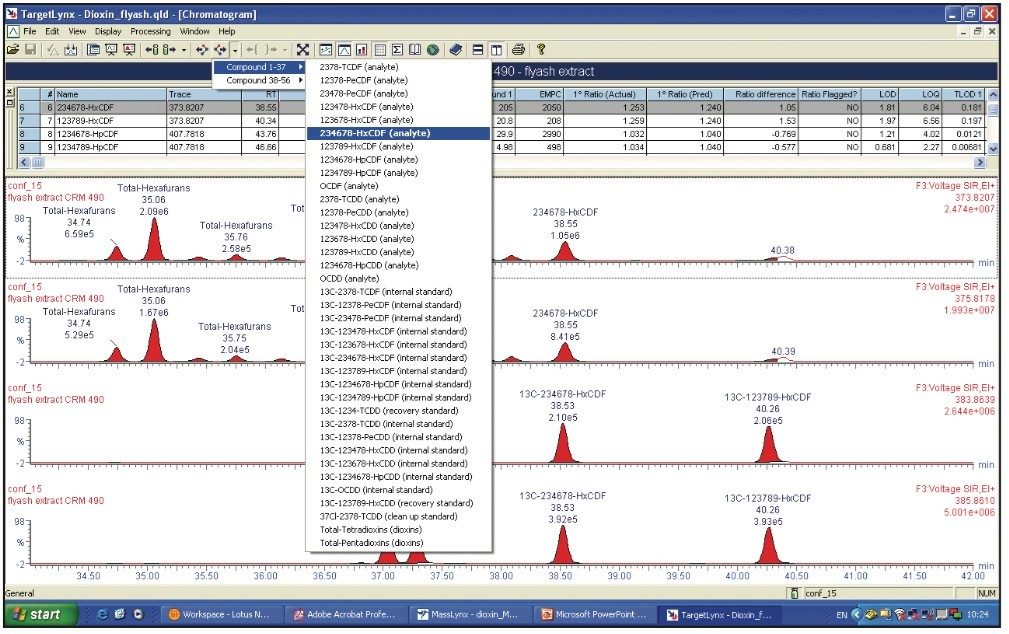
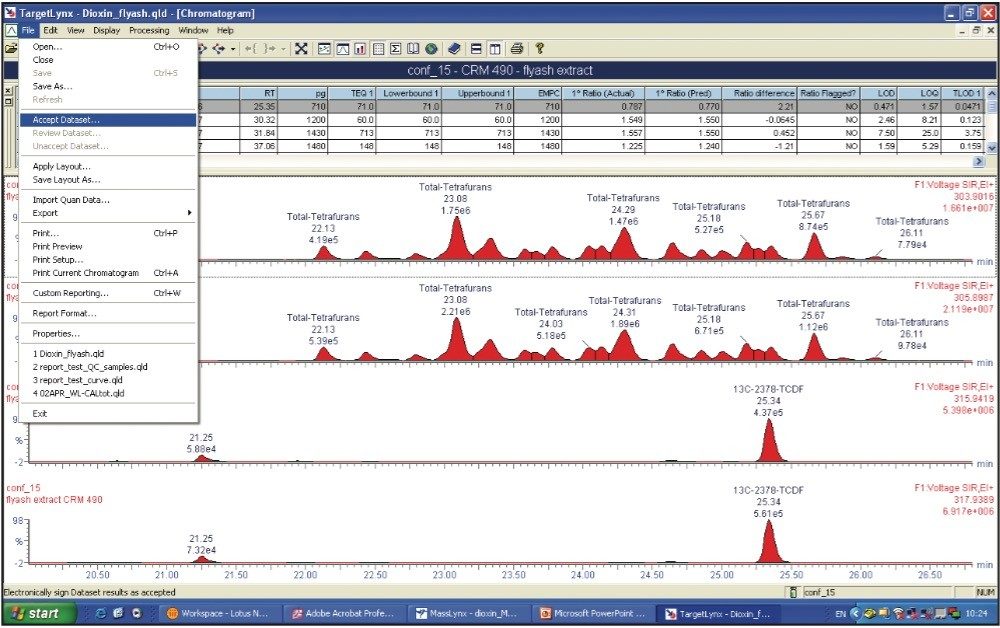
This application note gives examples of the performance of the Waters Micromass AutoSpec Ultima NT and describes QuanLynx Application Manager, the most advanced quantification software for dioxin and furan analysis, illustrating why this combination is the market leader in the field.