Rapid Analyses of mAb Subunits and Intact mAb with 20 mm Polyphenyl Reversed-Phase Columns
Abstract
The rapid growth of biopharmaceuticals such as monoclonal antibodies (mAb) demands high throughput characterization throughout the entire development process. Here, we present rapid Reversed-Phase methods using a 20 mm BioResolve™ Premier RP mAb Polyphenyl 450 Å, 2.7 µm Column for mAb subunit and intact mAb LC-MS analyses. In comparison with a 100 mm column, the performance of the 20 mm column provides five to seven times faster analysis times with comparable mass identification and confirmation, despite proportionally lower chromatographic resolutions. In addition, the reproducibility and robustness of the 20 mm column is demonstrated.
Benefits
- Rapid LC-MS analyses of mAb subunit and intact mAb for mass identification and confirmation using 2.1 x 20 mm BioResolve Premier RP mAb Polyphenyl 450 Å, 2.7 µm Column.
- Demonstration of column reproducibility and robustness over 600 analyses
Introduction
Biopharmaceuticals such as mAb, antibody drug conjugates (ADCs) and other proteins have become an important class of therapeutics. High throughput characterization can benefit the entire development process of these therapeutics. It has been shown that reduced analytical LC column lengths can often provide adequate peak resolutions for biopharmaceutical characterization, while decreasing analysis times.1 Here, we present rapid reversed-phase methods using BioResolve Premier RP mAb Polyphenyl 450 Å, 2.7 µm particles in a 20 mm length column.
Experimental
LC Conditions
|
LC system: |
ACQUITY™ UPLC I-Class PLUS |
|
Detection: |
TUV at 280 nm, Xevo™ G2-XS QTof MS Detection |
|
Column(s): |
BioResolve Premier RP Polyphenyl 450 Å 2.7 µm 2.1 x 20 mm, (p/n: 186011019) BioResolve RP Polyphenyl 450 Å 2.7 µm 2.1 x 100 mm, (p/n: 186008945) |
|
Column temperature: |
80 °C |
|
Sample temperature: |
10 °C |
|
Injection volume: |
1–5 µL |
|
Flow rate: |
0.4 mL/min; for lifetime: 0.8 mL/min |
|
Mobiles phases: |
A: 0.1% formic acid or TFA in H2O B: 0.1% formic acid or TFA in acetonitrile For lifetime: A: 0.1% TFA in H2O B: 0.05% TFA in acetonitrile |
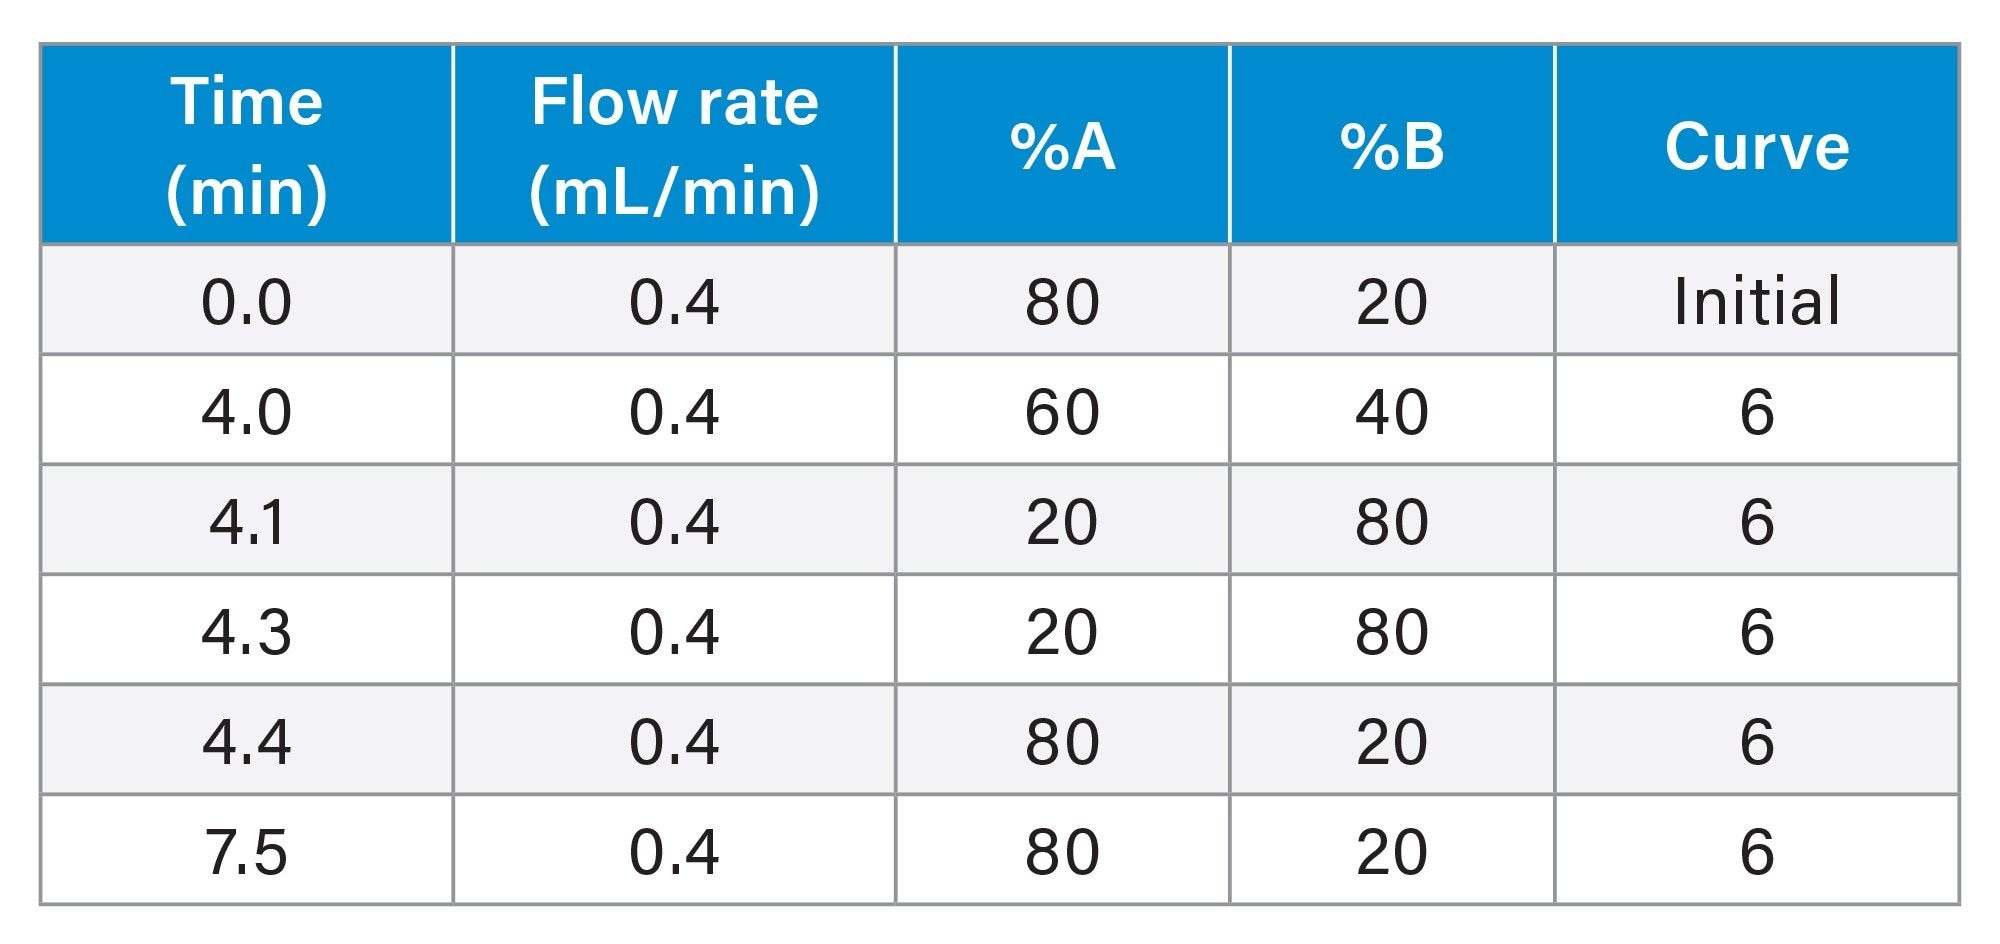
Gradient Table for mAb subunit analysis on the 20 mm column*
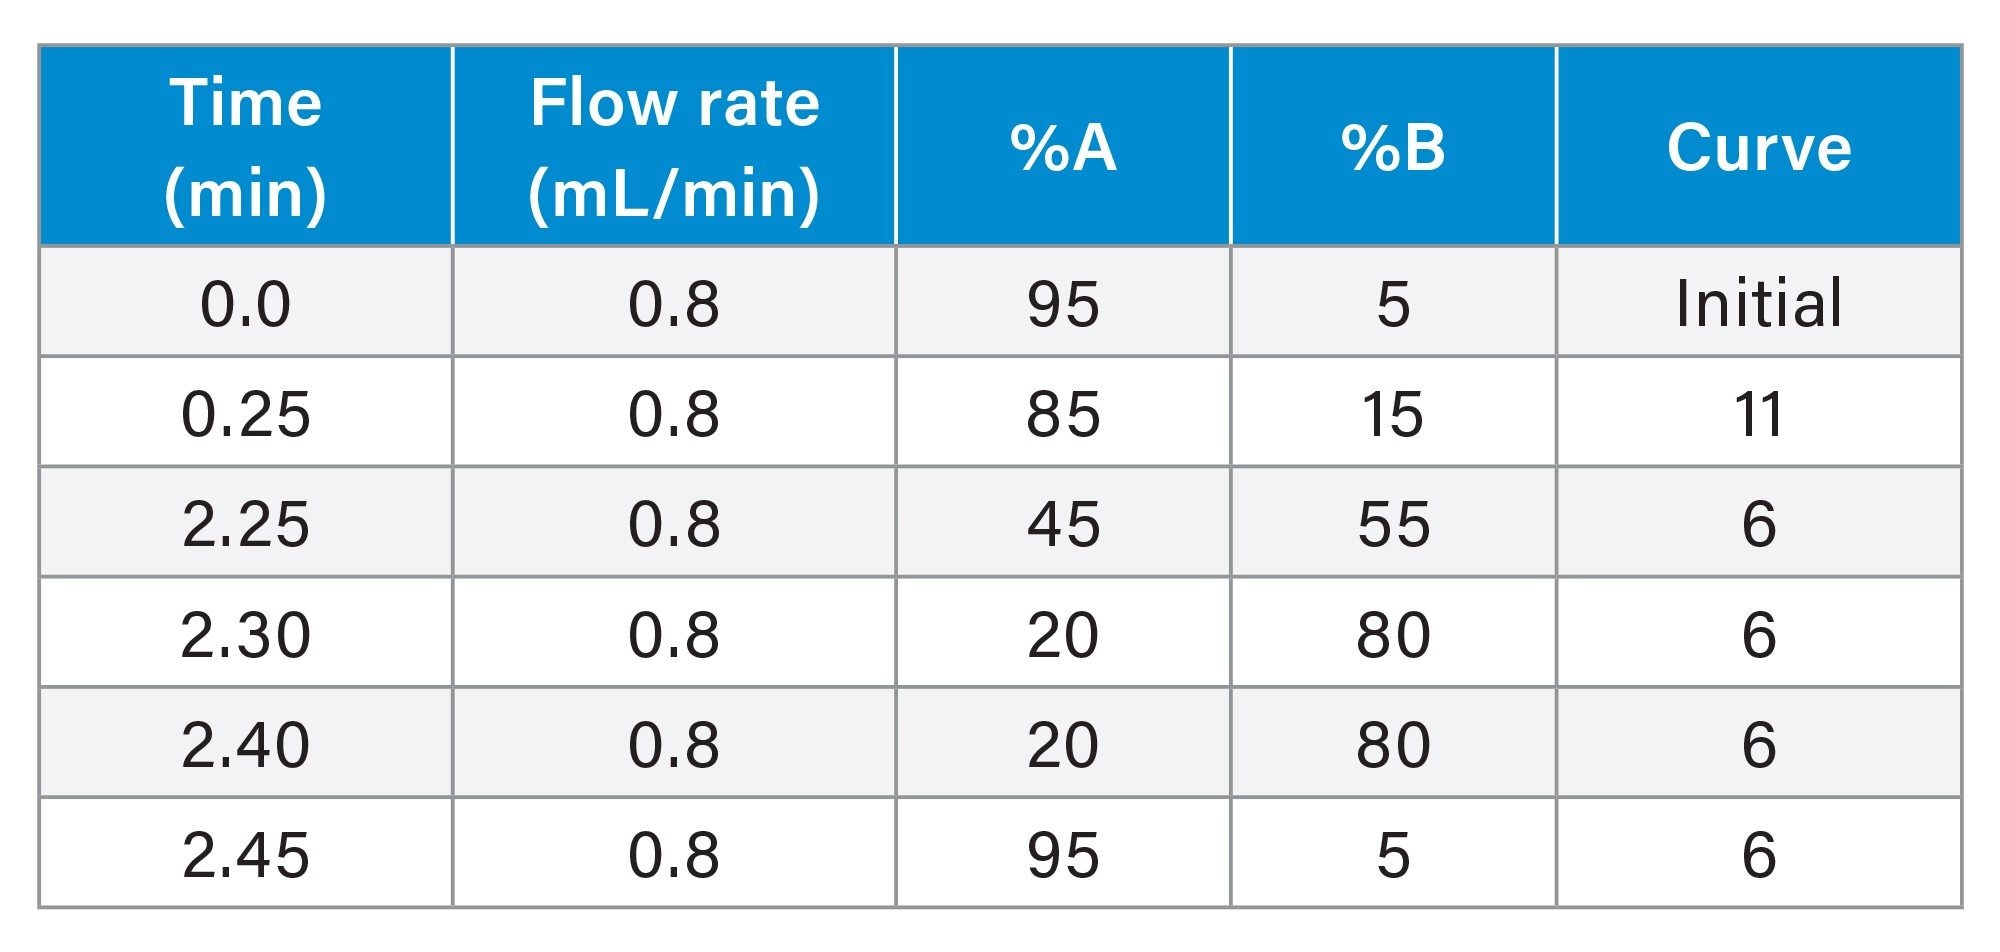
Gradient Table for intact mAb analysis on the 20 mm column*
 *For the 100 mm column, the run time is scaled as five times 5x longer.
Gradient for lifetime study (Figure 2)
 For lifetime study, 600 injections were made by injecting the mAb subunit standard after every 24 injections of H2O.
Xevo G2 QTof Settings
|
Mode: |
MS Experiment |
|
Mass range: |
50–5000 m/z |
|
Polarity: |
positive |
|
Sample rate: |
2 Hz |
|
Cone voltage: |
70 V (subunit), 150 V (intact mAb) |
|
Capillary voltage: |
2.75 kV (subunit), 2.25 kV (intact mAb) |
|
Source temperature: |
125 °C (subunit), 150 °C (intact mAb) |
|
Desolvation temperature: |
500 °C |
Data Management
|
LC software: |
Empower™ 3 |
|
LC/MS software: |
waters_connect™ |
Results and Discussion
The 2.1 x 20 mm BioResolve Premier RP Polyphenyl 450 Å 2.7 µm column delivered excellent reproducibility with different batches of MaxPeak™ High Performance Surfaces (HPS) column hardware. As shown in Figure 1, separation of mAb subunit standard resulted in average peak capacity %RSD values of 2.51% and 2.27% with formic acid and TFA mobile phases. The robustness of this column is also demonstrated, as the retention time and peak capacity did not change significantly over 600 injections at 0.8 mL/min and 80 °C column temperature with 0.1% TFA mobile phases (Figure 2).
 Figure 1. Excellent reproducibility was obtained in separation of mAb Subunit Standard on three 2.1 x 20 mm BioResolve Premier RP mAb Polyphenyl 450 Å 2.7 µm columns with different batches of HPS column hardware. Formic acid mobile phases, 15–55 %B in 4 minutes, 0.4 mL/min, 80 °C column temperature. Peak 1: Fc/2, Peak 2: LC, Peak 3: Fd’.
 Figure 2. Robustness of the 2.1 x 20 mm BioResolve Premier RP mAb Polyphenyl 450 Å 2.7 µm Column was demonstrated by injecting the mAb subunit standard after every 24 injections of H2O. Retention time and peak capacity did not change significantly over 600 injections. TFA mobile phases, 15–55 %B in 2 minutes, 0.8 mL/min, 80 °C column temperature.
mAb Subunit Analysis
Figure 3 shows the separation of mAb subunits using a 2.1 x 20 mm column (0.25 µg sample load) and a 2.1 x 100 mm column (1.25 µg sample load), keeping the same gradient slope with regard to column volumes. The three main subunit peaks (Peak 1: Fc/2, Peak 2: LC, Peak 3: Fd’) were well separated on the 20 mm column.2 As expected, some of the low abundant species that were observed as shoulder peaks on the 100 mm column were not separated from the main peaks on the 20 mm column, due to reduced separation efficiency. On the other hand, the analysis time for the 20 mm column was five times shorter than that of the 100 mm column. As an added benefit, sample volume and mobile phase use were also five times lower.
The analysis time can be further reduced by reducing the gradient time (Figure 4) while the flow rate was kept at 0.4 mL/min to maintain MS ionization efficiency. As a result, the gradient slope becomes steeper, leading to lower resolution. Despite loss of resolution, the three main peaks were effectively separated using a 1-minute gradient, and the mass data were comparable to those obtained from the 4-minute gradient time as well as the 20-minute gradient on the 100 mm column (Figure 5).
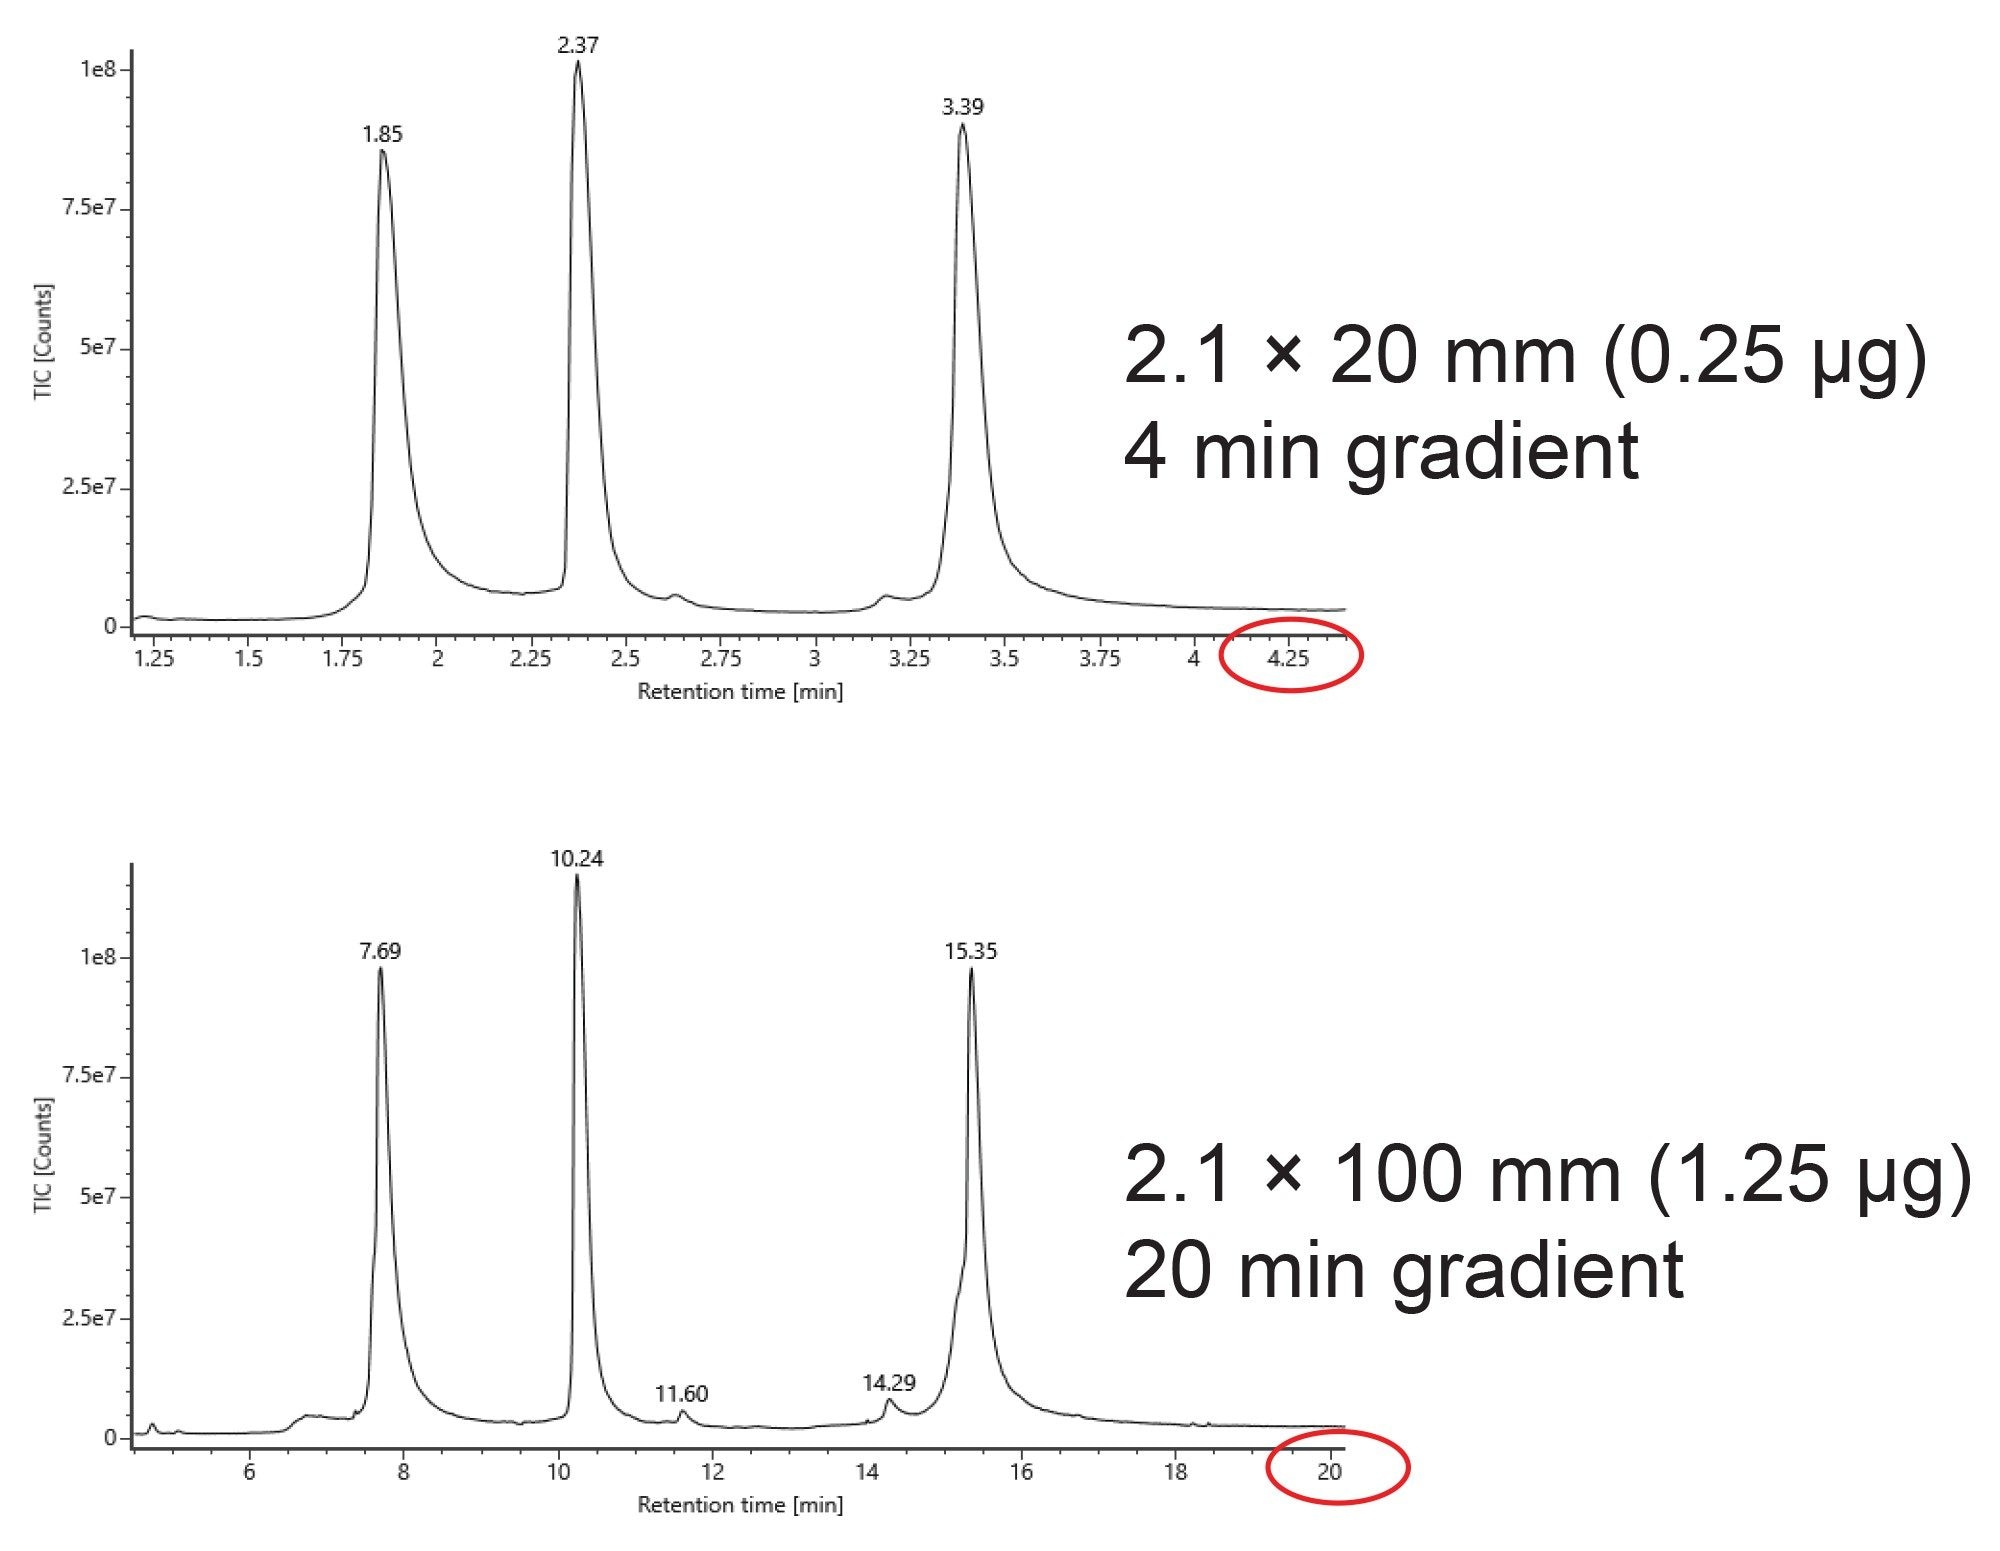 Figure 3. Comparison of LC-MS separation of the mAb Subunit Standard on a 2.1 x 20 mm BioResolve Premier RP mAb Polyphenyl 450 Å 2.7 µm Column (4-minute gradient) and a 2.1 x 100 mm BioResolve RP mAb Polyphenyl 450 Å 2.7 µm Column (20-minute gradient).
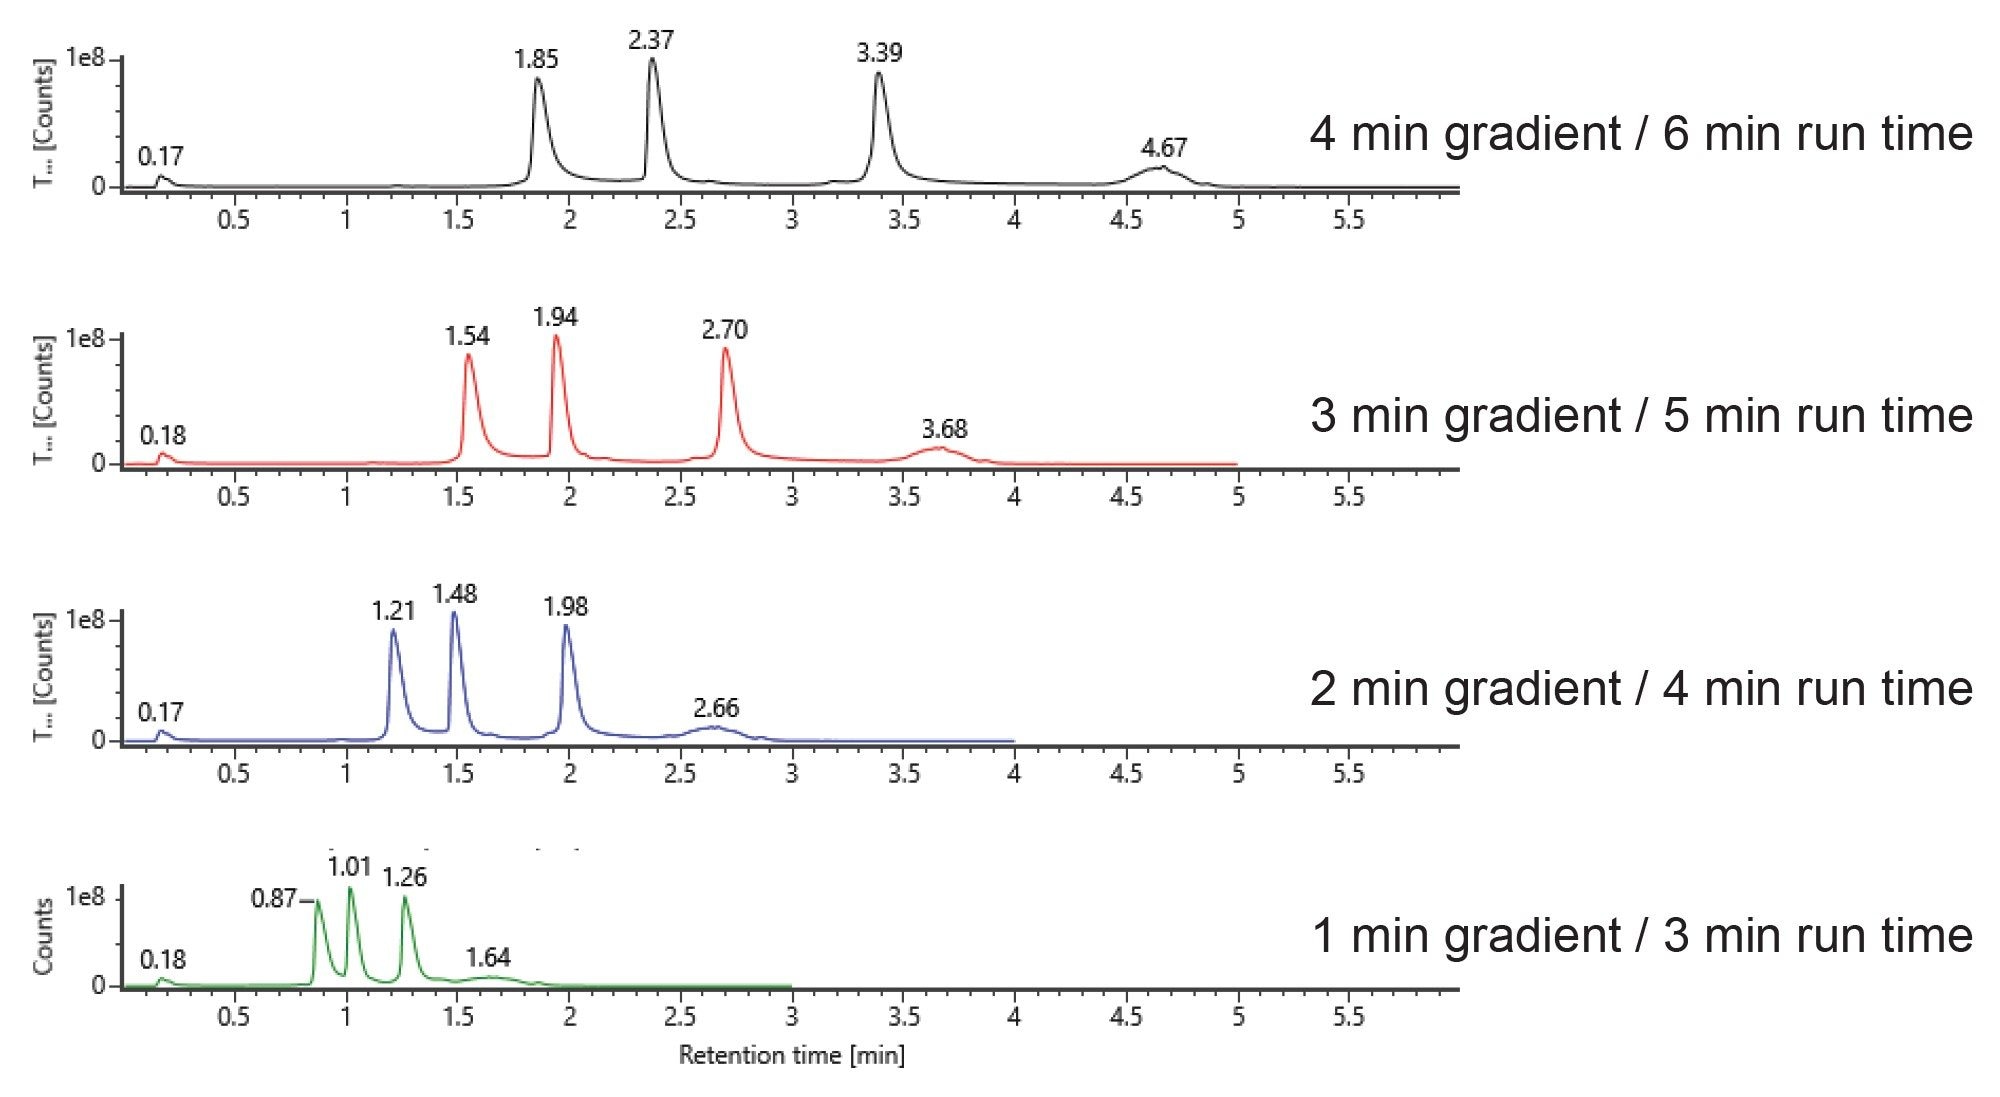 Figure 4. Comparison of LC-MS separation of the mAb Subunit Standard on a 2.1 x 20 mm BioResolve Premier RP mAb Polyphenyl 450 Å 2.7 µm Column with one to four minute gradient time.
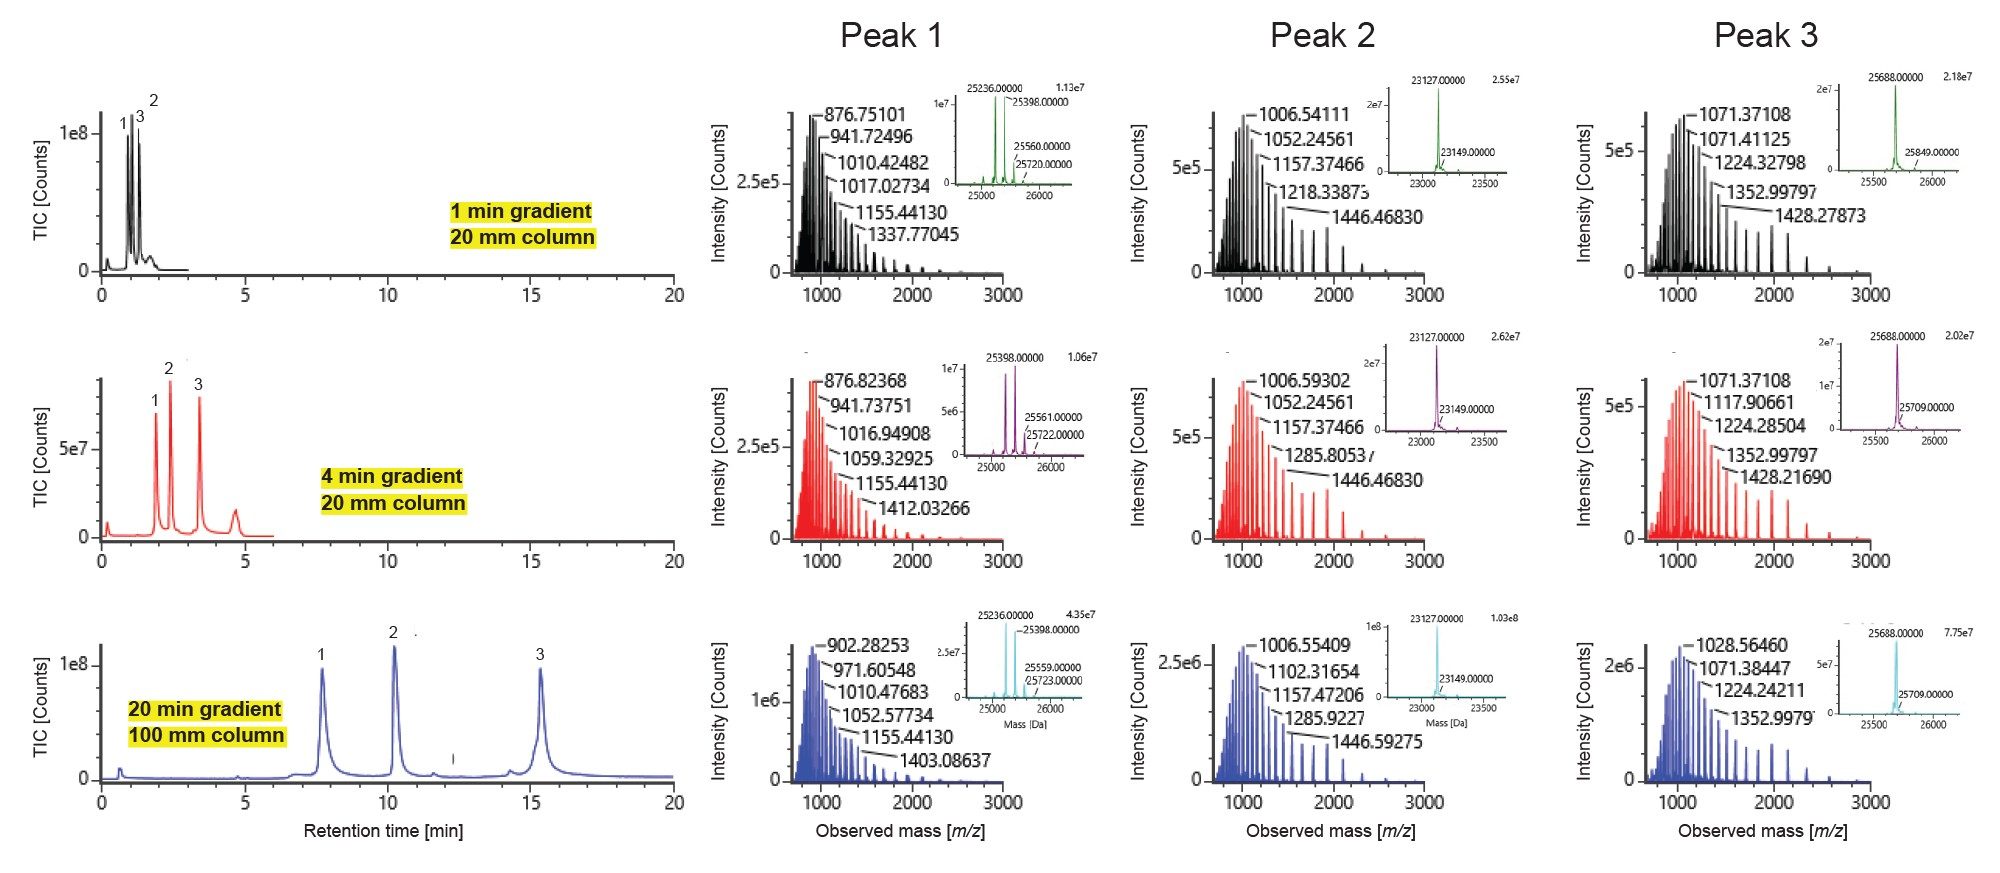 Figure 5. Separation of the mAb Subunit Standard using 1-minute and 4-minute gradient on the 20 mm column, as well as 20-min gradient on the 100 column. Comparable combined spectra of the three main peaks and the deconvoluted mass (insert) were obtained.
Intact mAb Analysis
Figure 6a shows the LC-MS analysis of the intact NIST mAb (Humanized mAb Mass Check Standard) using a 2.1 x 20 mm column (0.25 µg sample load) and a 2.1 x 100 mm column (1.25 µg sample load) with the same gradient slope with regard to column volumes.3,4 Similar to the observations for the mAb subunit standard separation, significant reduction in analysis time, sample volume and mobile phase use were achieved using the 20 mm column, despite some loss of resolution between the main peak and low abundance shoulder peaks. The combined spectra, single charge state and deconvoluted mass spectra of the main peak are shown on Figure 6b and 6c for the 20 mm column and the 100 mm column. The mass data obtained from the 1-minute gradient on the 20 mm column were comparable to those obtained from the 5-minute gradient on the 100 mm column.
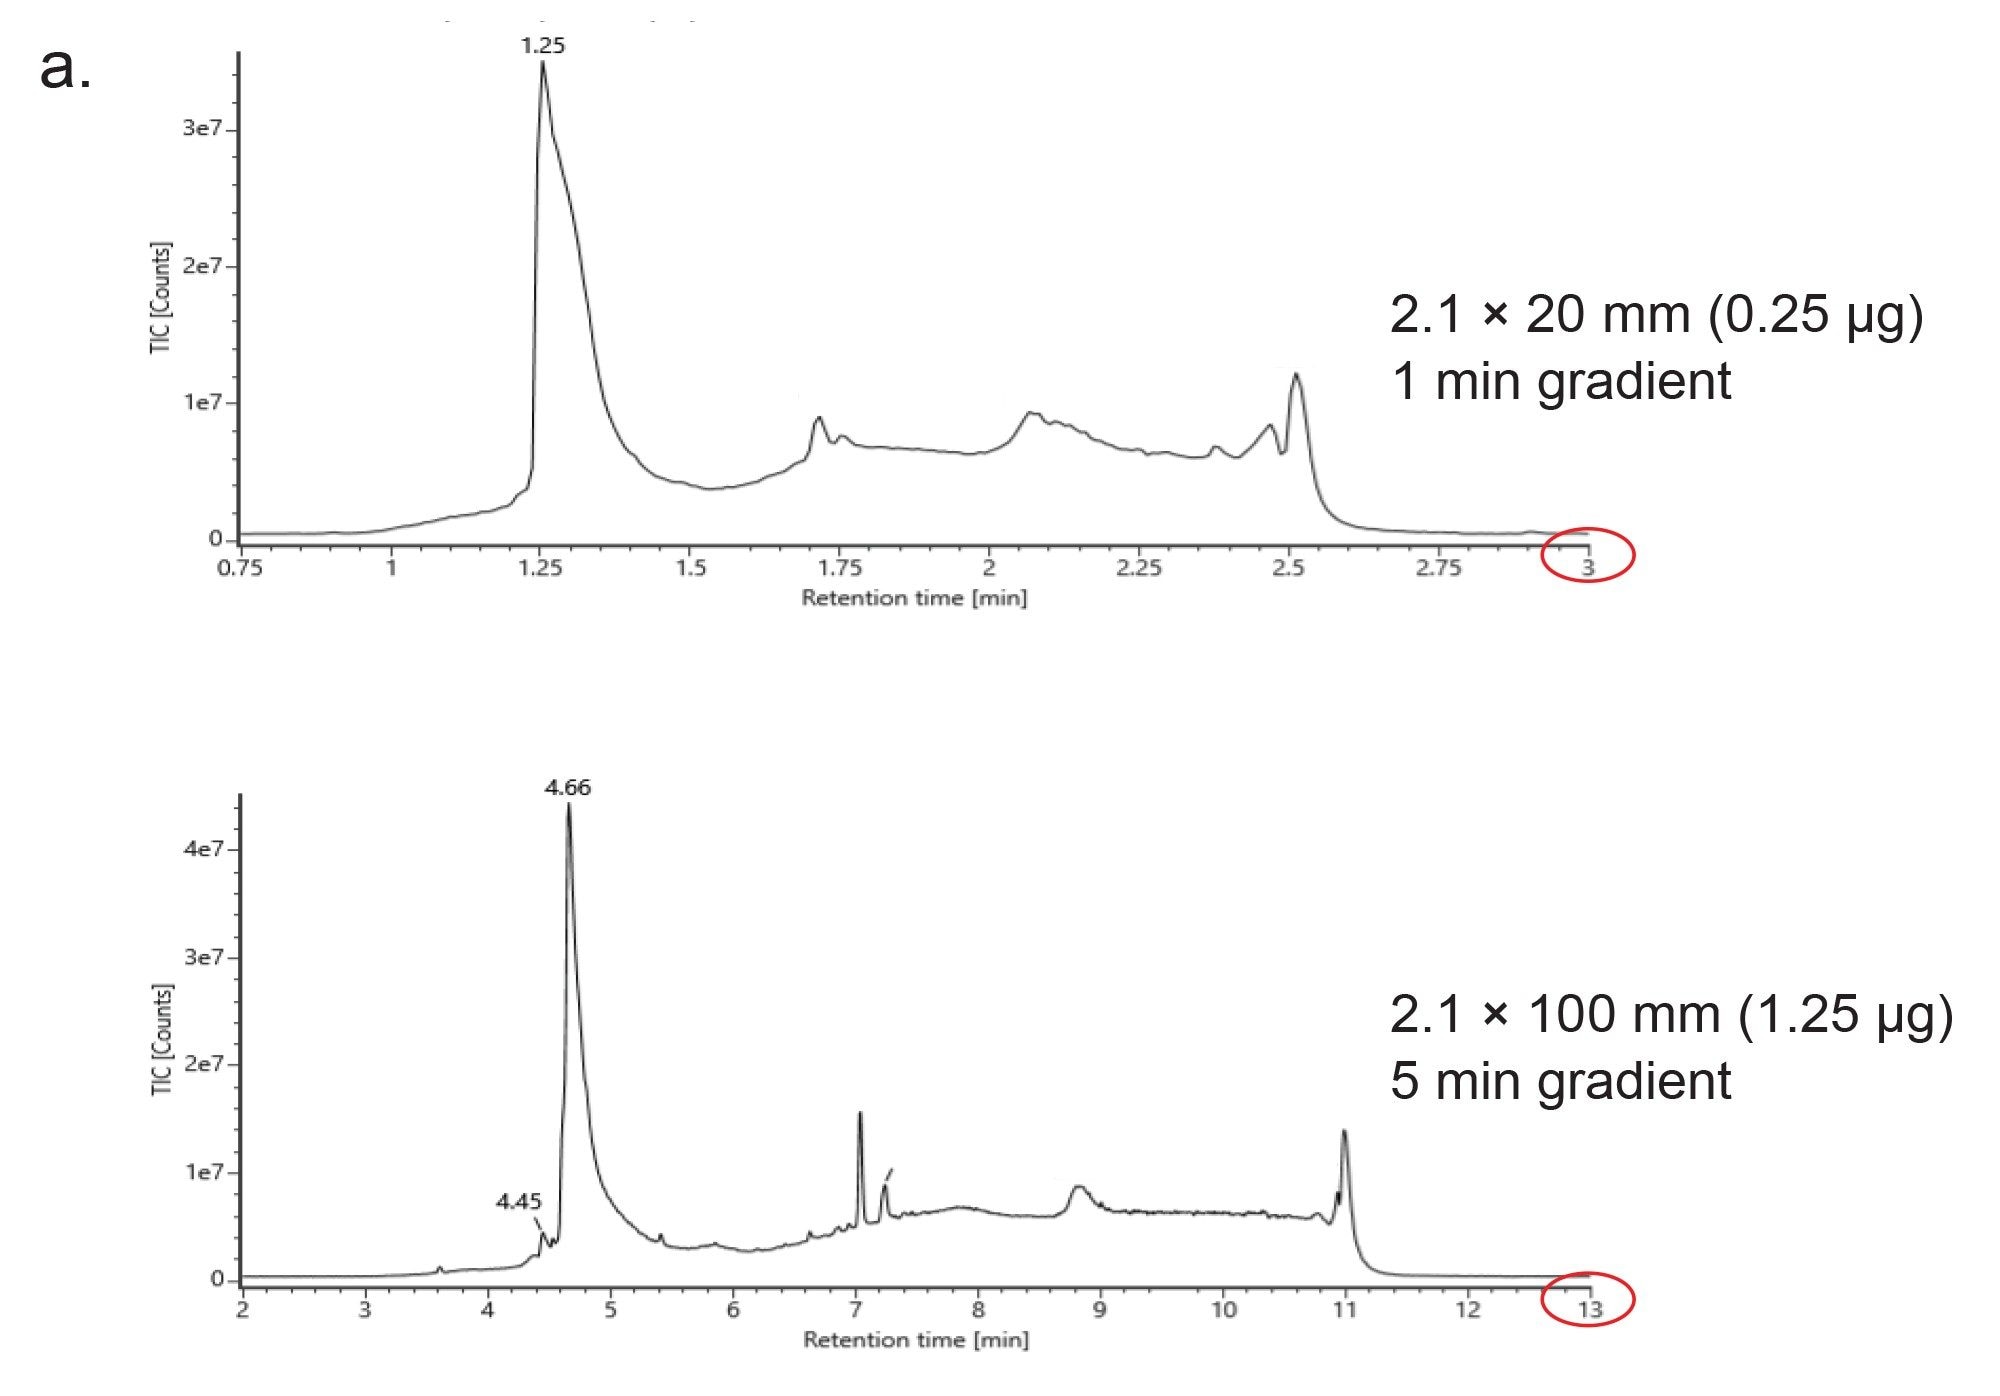 Figure 6. LC-MS analysis of the intact NIST mAb (Humanized mAb Mass Check Standard).
a. Comparison of LC-MS separation of the intact NISt mAb on a 2.1 x 20 mm BioResolve Premier RP mAb Polyphenyl 450 Å 2.7 µm Column (1-minute gradient) and a 2.1 x 100 mm BioResolve RP mAb Polyphenyl 450 Å 2.7 µm Column (5-minute gradient).
 Figure 6. LC-MS analysis of the intact NIST mAb (Humanized mAb Mass Check Standard).
b. Combined spectra, single charge state (insert) and the deconvoluted mass obtained using the 20 mm column.
 Figure 6. LC-MS analysis of the intact NIST mAb (Humanized mAb Mass Check Standard).
c. Combined spectra, single charge state (insert) and the deconvoluted mass obtained using the 100 mm column. The grey blocks indicate where the spectra were combined.
Conclusion
It has been demonstrated that the 2.1 x 20 mm BioResolve Premier RP Polyphenyl 450 Å 2.7 µm column is reproducible and robust. The rapid reversed-phase method run on this short column (≤ three minute run time) provides effective separation for mAb subunits. Despite proportionally lower chromatographic resolutions, the mass spectra and deconvoluted mass were comparable to those obtained from a 20-minute gradient on the 100 mm column. Similarly, a rapid LC-MS method (≤ three minute run time) for intact mAb analysis using the 20 mm column format can be used for mass identification.
References
- Fekete S. and Guillarme D. Ultra-short Columns for the Chromatographic Analysis of Large Molecules. Journal of Chromatography A 1706 (2023) 464285.
- Ranbaduge N, Shion H, Lauber M.A., and Yu Y.Q., LC-MS Characterization of mAb Subunits Using a BioResolve RP mAb Column. Waters Technology Brief. 720006199. 2018.
- Shion H., Yu Y.Q., and Chen W. Enabling Routine and Reproducible Intact Mass Analysis When Data Integrity Matters. Waters Application Note. 720006472. 2020.
- Humanized mAb Mass Check Standard. Waters Care and Use Manual. 720006358. 2019.
720008299, April 2024