This application note describes the 23 compounds which were analyzed with a UPLC-MS/MS protocol including MS multiple reaction monitoring (MRM) parameter optimization, MS acquisition method creation, data acquisition, data processing, and report generation.
Determining solubility has become an essential step in the early stages of the drug discovery process. Solubility is important because the ratio of the anticipated dose of a given drug to its solubility, together with the dissolution rate, determine the fraction of the dose available for absorption. Because gastric and intestinal fluids are a complex mixture of natural surfactants, salts, and buffers, it is also important to determine the effect of pH, salts, and surfactants on a drug’s solubility.
Potentiometric titration and nephelometry are two popular methods for the fast determination of drug solubility. While these methods may be high throughput, the solubility range is limited by the sensitivity of the detection methods and the concentration of the stock DMSO solutions.
Results obtained via these methods are also less reliable for designing in vivo animal toxicity and drug metabolism and pharmacokinetics (DMPK) studies, in which solubilization of the drug substance in proper media is often required to prepare liquid formulations at various concentrations.
UltraPerformance LC (UPLC) technology can be used to measure compound solubility in either an aqueous buffer solution or mixtures of co-solvents with relatively high-throughput capability, while maintaining adequate accuracy of results.
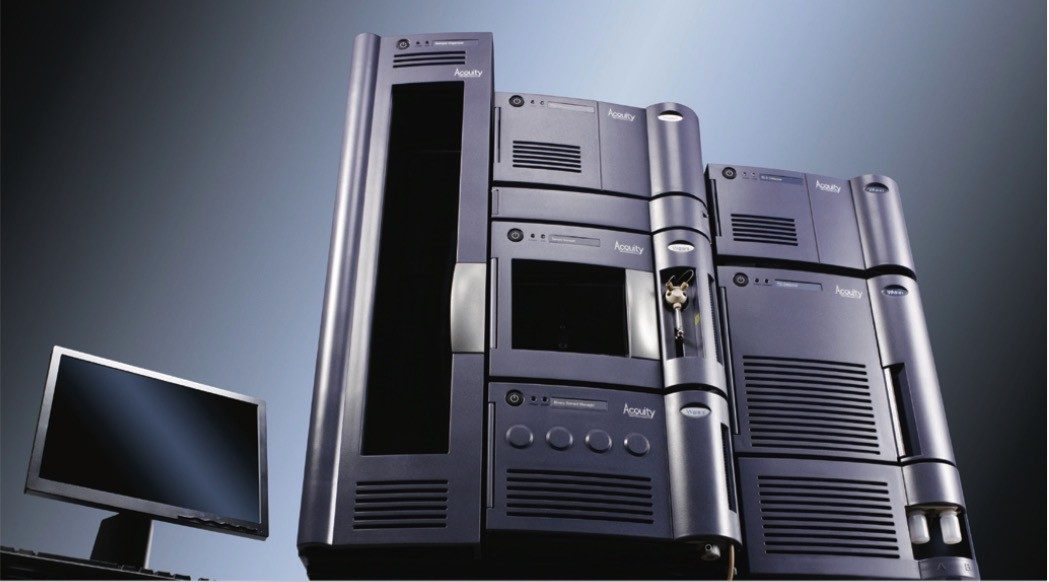
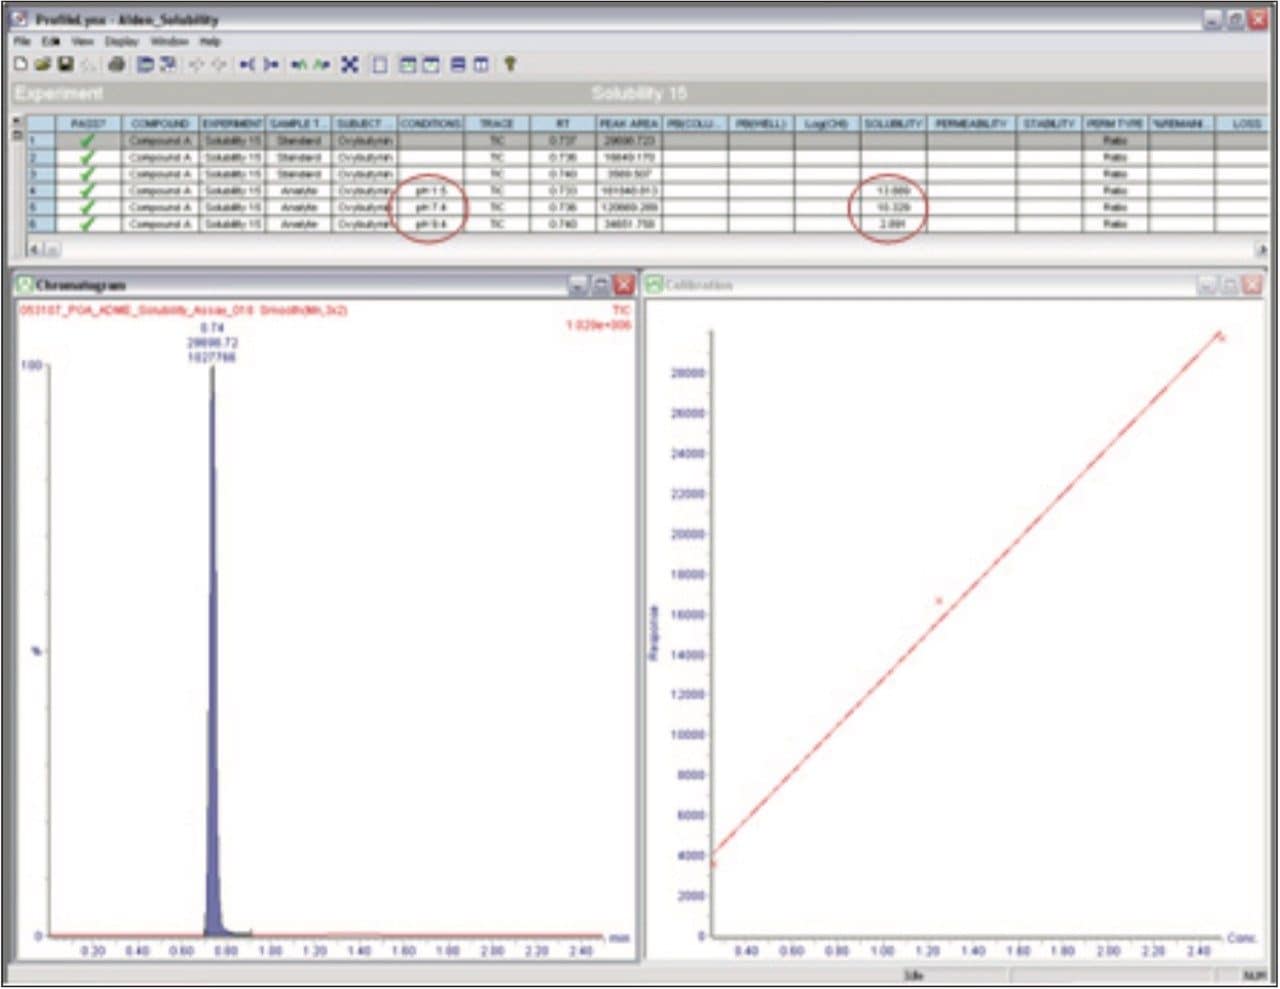
Given the selectivity and sensitivity of MS/MS detection, UPLC-MS/MS analysis with the Waters ACQUITY TQD System (Figure 1) in combination with specialized software, ProfileLynx and QuanOptimize Application Managers, is the ideal choice for quantitation of a solubility screen.
A set of 23 commercially available compounds were randomly chosen to demonstrate the ProfileLynx Application Manager.
Individual stock solutions of the 23-compound library were prepared in a 96-well plate at a concentration of 5 mM in dimethylsulfoxide (DMSO). The three different pH buffer solutions were prepared in the following manner:
For each different pH assay, 50 μL of each 5 mM stock solution was transferred to a 2-mL, 96-well plate. 950 μL of the appropriate pH buffer was added to each well in the plate resulting in compound concentrations of 250 μM.
The plate was shaken gently on a shaker for 1.5 hours at room temperature. The well contents were transferred to a Sirocco plate and were vacuum-filtered for ~30 to 60 seconds into a collection plate.
The sample/pH buffer solutions were diluted 1:100 in 50:50 acetonitrile/water, resulting in sample concentrations of a maximum of 2.5 μM (assuming that the compound was completely soluble at 250 μM in pH buffer). Samples were injected (5 μL injections) at this concentration.
A three-point calibration of standards was used for quantitation of the sample solutions. Standards were prepared at concentrations of 0.25 μM, 1.25 μM, and 2.5 μM. 5 mM stock solutions of the compounds in DMSO were diluted 1:100 in 50:50 acetonitrile/water to a concentration of 50 μM.
The 50 μM stock solutions were diluted 1:20 in 50:50 acetonitrile/water resulting in the 2.5 μM standard solutions. The 2.5 μM standard solutions were diluted 1:10 to give 0.25 μM standard solutions, which were then diluted 1:2 to give 1.25 μM standard solutions.
These samples and standards were analyzed by UPLC-MS/MS. The QuanOptimize Application Manager was used for the automated optimization of the MS multiple reaction monitoring (MRM) conditions for each compound.
LC system: |
Waters ACQUITY TQD System |
Column: |
ACQUITY UPLC BEH C18 Column 2.1 x 50 mm, 1.7 μm |
Column temp: |
40 °C |
Flow rate: |
600 μL/min |
Mobile phase A: |
0.1% Formic acid in water |
Mobile phase B: |
0.1% Formic acid in acetonitrile |
Gradient: |
5 to 95% B/1.3 min |
MS system: |
Waters TQ Detector |
Ionization mode: |
ESI Positive |
Capillary voltage: |
3200 V |
Source temp: |
150 °C |
Desolvation temp: |
450 °C |
Desolvation gas: |
900 L/hr |
Cone gas flow: |
50 L/hr |
Inter-scan delay: |
20 ms |
Inter-channel delay: |
5 ms |
Dwell: |
200 ms |
Acquisition range: |
100 to 1000 m/z |
Because the solubility assay of the compounds is carried out at 250 μM and the samples are diluted 1:100 before UPLC analysis, the concentrations determined by UPLC-MS/MS must be multiplied by a factor of 100 to get the final solubility. If this final measured concentration is 250 μM, then the compound has a solubility greater than or equal to 250 μM at the pH of the buffer.
Solubility was determined using MassLynx Software’s ProfileLynx Application Manager. Each compound was identified within the sample list and the sample type (standard or analyte) was specified. The solubility concentration of the analytes was determined using a calibration curve generated by a concentration series of each standard.
Any solubility values outside of a specified minimum and maximum range were automatically flagged within the ProfileLynx Results Browser (Figure 3). For this experiment, the minimum was set at 0.0 mg/mL and the maximum at 2.5 mg/mL.
The interactive browser allowed for the editing of peak integration. Peak assignments were easily changed and peak integrations were quickly optimized. Results were then exported in a format amenable to the corporate database.
The data in Figure 3 show a typical solubility result. The solubility of Oxybutynin is nearly 10-fold lower at high pH than at low pH. Table 1 summarizes the solubility results for all 23 compounds tested.
In addition to determining any pH effects on the solubility of the various compounds, this assay will ensure that all samples have sufficient solubility to remain in solution under the conditions used for subsequent ADME assays.
All of the compounds exhibited high solubility such that the measured apparent solubility was greater than 250 μM for all samples. If the actual intrinsic solubility for these compounds is required, an equilibrium solubility assay using saturated solutions at an appropriate pH should be employed to ensure the compounds are not ionized.
The 23 compounds were analyzed with a UPLC-MS/MS protocol including MS multiple reaction monitoring (MRM) parameter optimization, MS acquisition method creation, data acquisition, data processing, and report generation.
Data generated from the variety of assays were all automatically processed with the same software. A single report was created for the 23 compounds containing the solubility results, enabling the researcher to analyze results quickly, thus increasing laboratory throughput. Results are displayed in an interactive, graphical summary format based on sample or experiment.
Using the method outlined here, compounds can be quickly and easily screened for solubility. MS detection ensures that the correct compound is being analyzed, while UPLC separation allows for the analysis of impure samples.
The results from this screening can then be used to determine those candidates with solubility levels consistent with the bioavailability levels needed to proceed down the development pipeline.
Using ProfileLynx and QuanOptimize Application Managers allowed for:
720002612, May 2008