MALDI Imaging was used to asses tissue distribution of xanthohumol and its metabolites in rats after repeated oral administration. Preliminary data indicates that xanthohumol is beneficial for prevention of cancers of the GI tract.
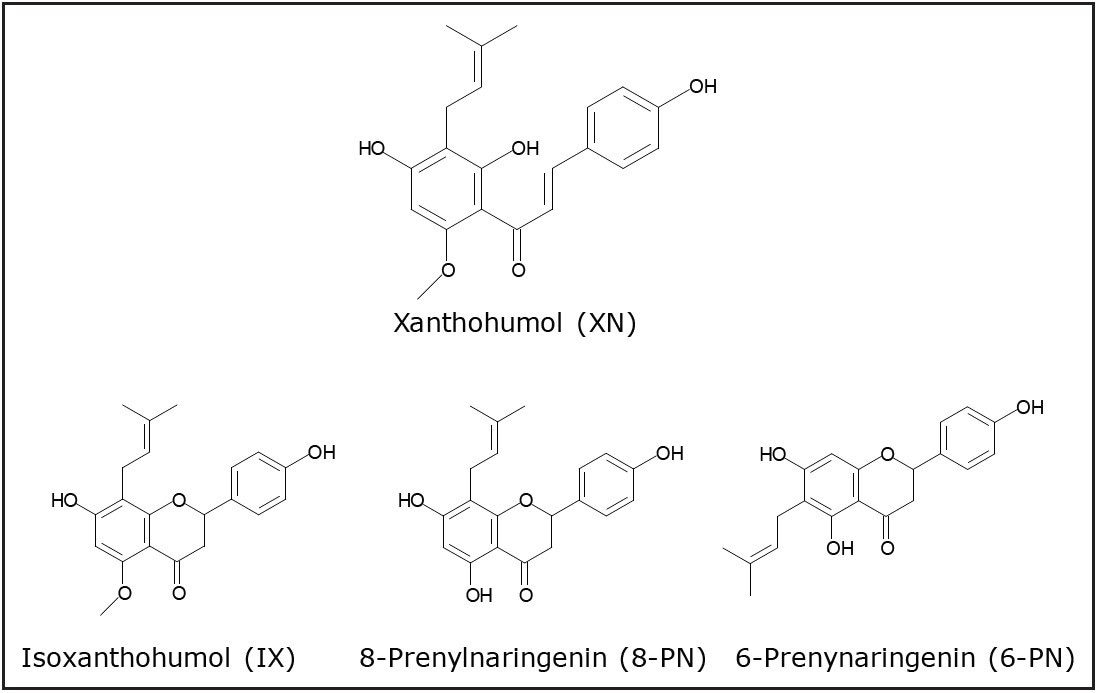
Hop (Humulus lupulus L.) cones are traditionally used as a flavoring agent for beer. Recently, there has been increased interest in studying this plant as alternative medicine for a variety of conditions, most notably for treatment of hot flashes due to its estrogenic activities as well as a potential chemopreventive agent. Various mechanisms of action have been proposed, such as induction of quinone reductase, induction of apoptosis, inhibition of aromatase, inhibition of angiogenesis, etc. Despite the extensive mechanistic work, pharmacokinetic properties of this compound are largely unknown. Limited in vivo studies suggest that xanthohumol is apparently able to reach systemic circulation upon oral ingestion. However, the exact organ distribution is not known.
Localization of a drug molecule’s distribution in its targeted tissue provides very important in vivo biological information. Traditionally, autoradiography and fluorescence spectroscopy have been used for molecular imaging of biological tissues. But there are significant limitations to these studies. For autoradiography, a radioactive isotope of the drug molecule is used. While for fluorescent spectroscopy, a fluorescent tag is used for the drug molecule. The distribution of the isotope or the tag of the drug molecule in a tissue is then tested. It is time-consuming and expensive to synthesize the isotopically labeled drug, or to tag the drug molecule. It can be difficult to differentiate the intact drug molecule signal to a metabolite signal that maintained the isotope label or retained the tag in such experiments. In addition, tags may change the pharmacological properties of a drug, and large fluorescence tags could affect the drug’s bioavailability and its distribution in the tissue.
Since MALDI imaging mass spectrometry was developed from Caprioli’s group1 at Vanderbilt University, it has become a very powerful tool in many fields, such as biological/cancer research and small molecule drug discovery and development. MALDI imaging mass spectrometry has the ability to detect multiple analytes with spatial correlation in the sample; it also monitors different types of compounds, such as small molecule drugs and metoblites, proteins, peptides, lipids, and polymers in their native sample forms without labeling or modifications.
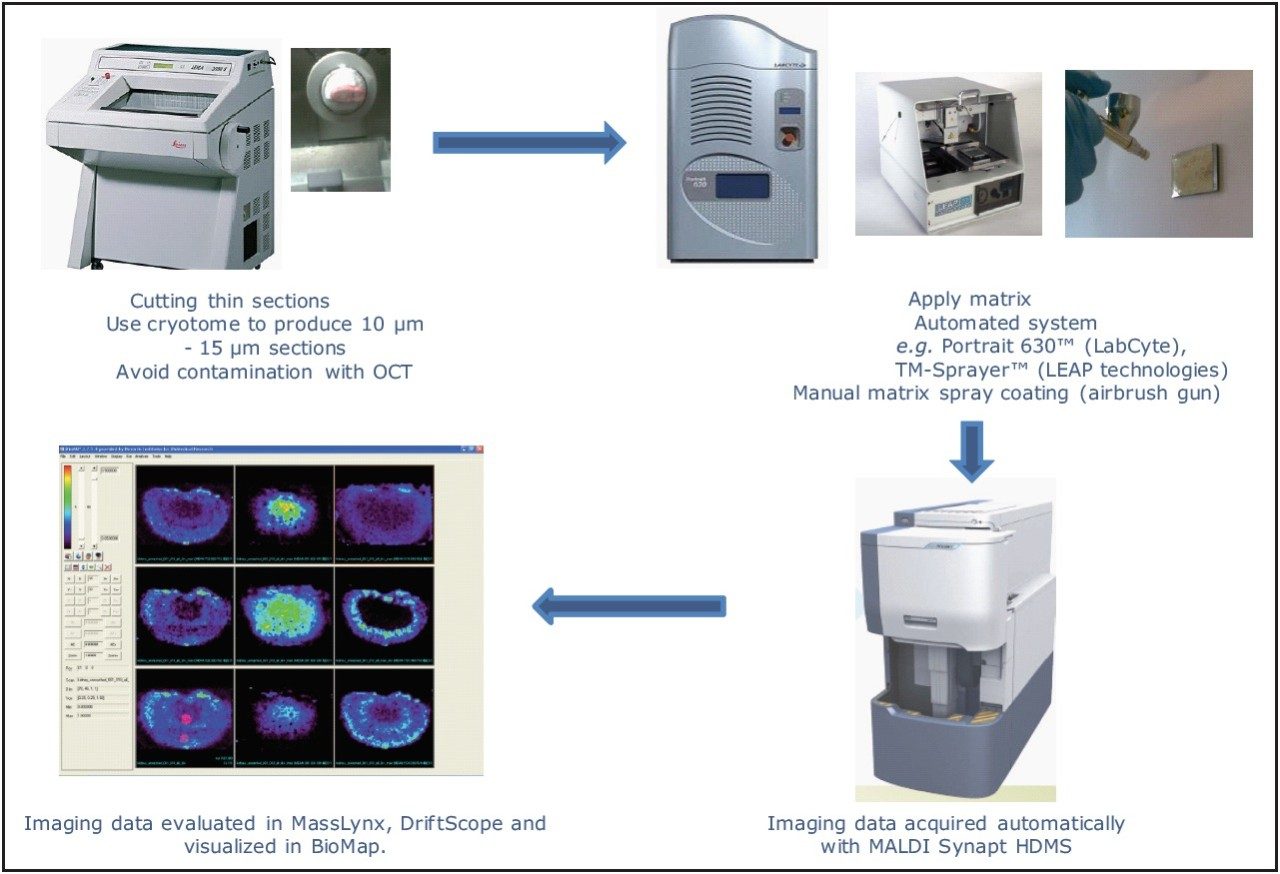
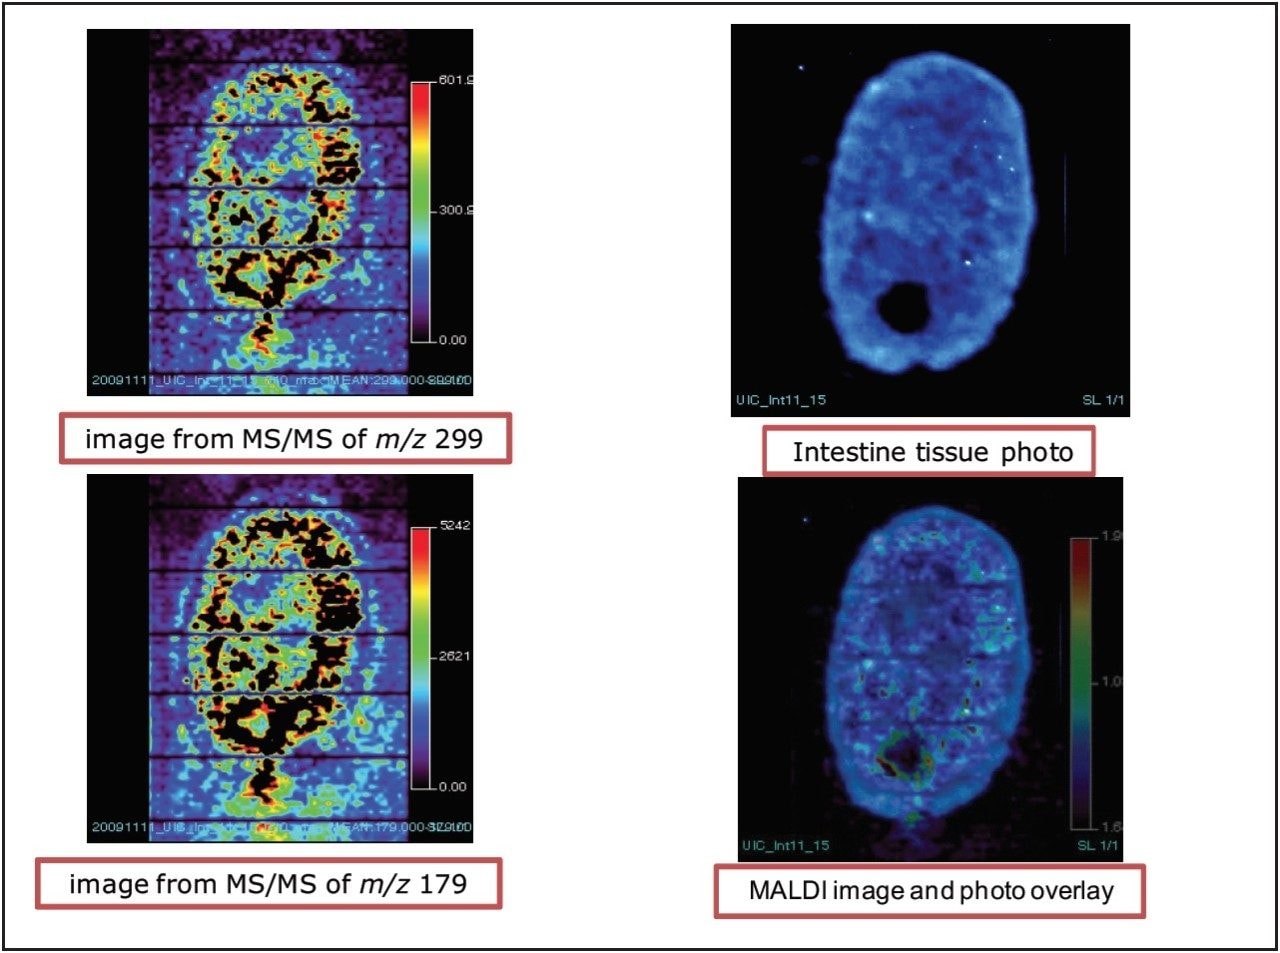
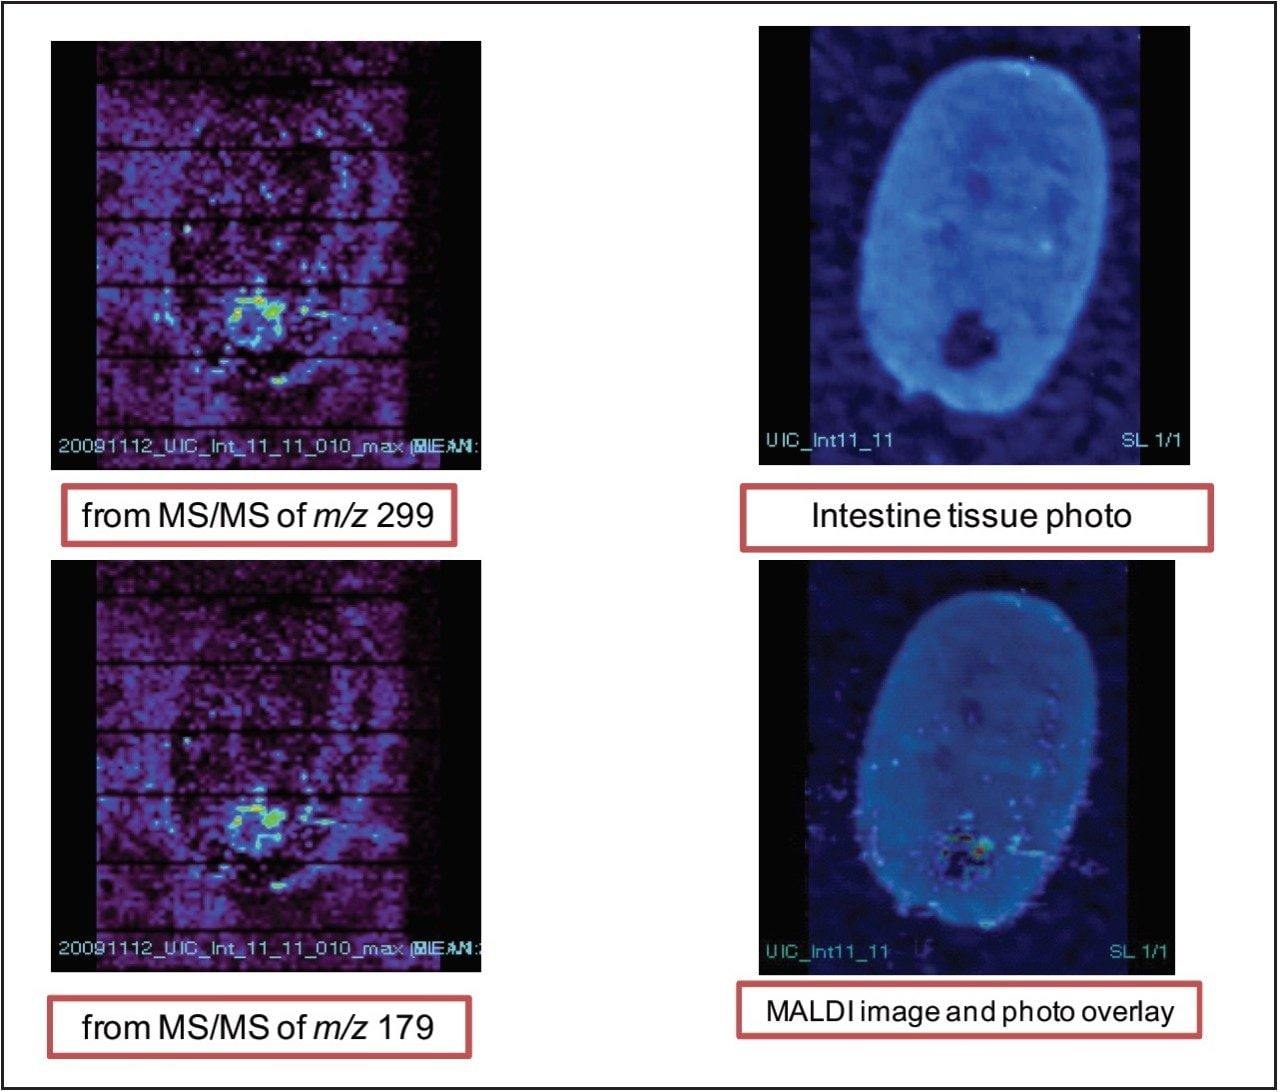
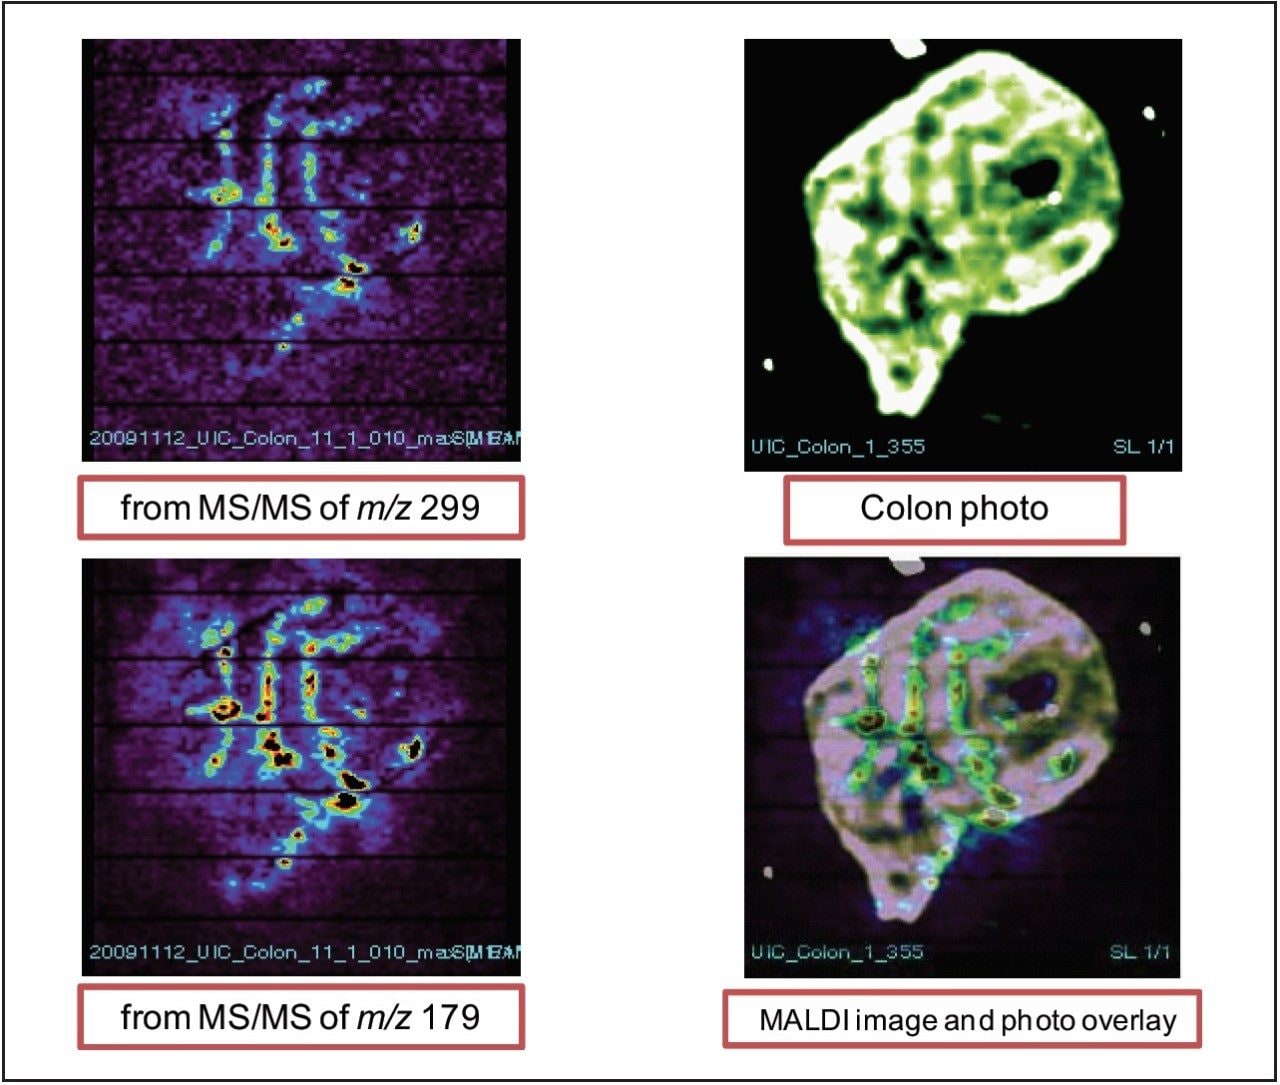
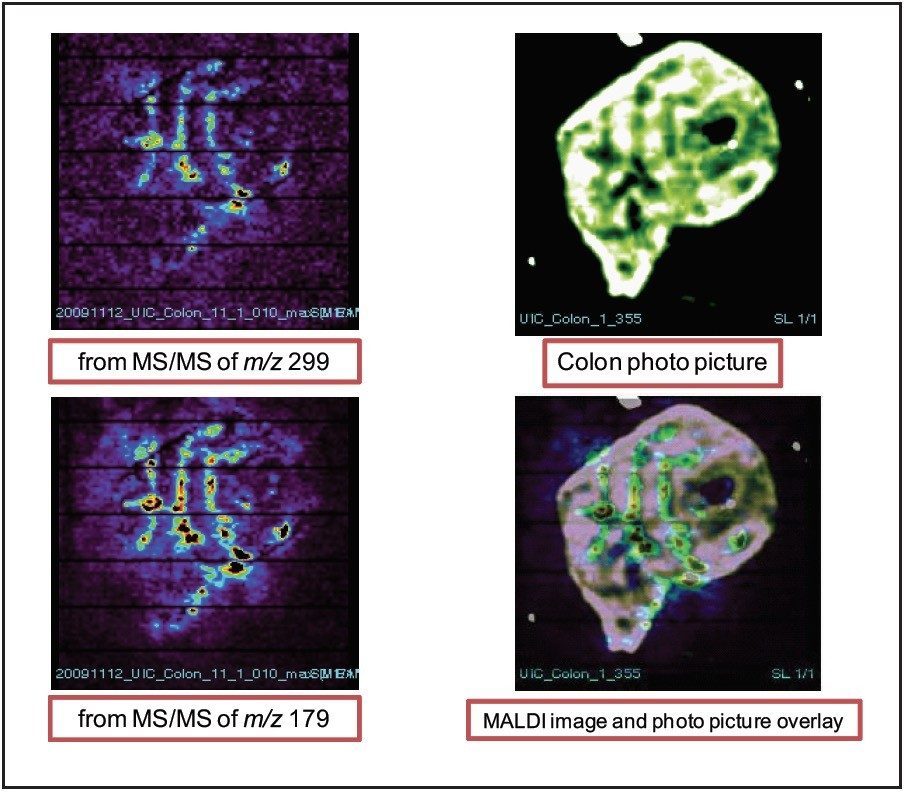
In this study, we used MALDI imaging to assess tissue distribution of xanthohumol and its metabolites in rats after repeated oral administration. The mass spectrometry system used in this study was Waters MALDI SYNAPT HDMS. The matrix (α-cyano-4-hydroxycinnamic acid, CHCA) was applied to the tissue surface through an air brush sprayer. BioMap2 3.7.5.5 (Norvatis Institute, Basel, Switzerland) was used for the visualization of MALDI imaging data.
Xanthohumol was administered in the form of an enriched hop extract standardized to 95% xanthohumol by quantitative NMR. The product was administered at 100 mg/kg dose, once a day for five days by oral gavage. The animals were sacrificed and organs were collected 24 hours after the last dose. Tissues were sliced to 12 μm thickness using a Cryostat (Leica CM-350, Leica Microsystems, Inc.) , and then placed onto microscopic slides.
An Iwata Eclipse-CS airbrush (Portland, OR, USA) with an Iwata Studio Series Power Jet Lite air compressor (Portland, OR, USA) were used to manually spray the matrix to coat the tissue. The matrix used for the analysis was CHCA, at a concentration of 15 mg/mL in acetonitrile/water/TFA (50:50/0.1, v:v:v). The frozen tissue samples on microscopic slides were thawed in a desiccator under vacuum for about two hours. The matrix solution was then applied to the tissue horizontally by passing the airbrush from left to right and top to bottom (in alternation) over the tissue, while continuously spraying the matrix at a distance of approximately 15 inches away from the tissue. The surface of the tissue section was then allowed to dry fully in ambient air (2 min). This process was repeated until 15 mL of matrix had been applied. The compressor pressure was set at 40 psi.
Digital scans of the tissue sections were obtained prior to the imaging experiment using HP ScanJet G4010 (Hewlett-Packard Company, Palo Alto, CA, USA), and imported into MALDI imaging Pattern Creator Software (Waters Corporation, Manchester, U.K.), where the area to be imaged was selected. MALDI Imaging MS analysis data were acquired using MALDI SYNAPT HDMS, operated in positive ion V-mode, as shown in Figure 2. The laser used was a frequency-tripled Nd:YAG laser (355 nm), firing at 200 Hz, at the energy level of 250 (a laser energy level of 500 corresponding to about 100 μJ), with a sample plate voltage of 10 V.Spatial resolution of 150 μm was selected, and 400 laser shots were acquired per pixel. Argon was used as the collision gas. The trap collision cell voltage was 6 V in MS mode and 25 V in MS/MS mode.
Data acquisition was performed on MS/MS with enhanced duty cycle (EDC) mode to increase the experiment selectivity and sensitivity. The m/z of precursor ion was set at m/z 355.20 for xanthohumul with its fragment ions at m/z 299.10 and 179.10; and at 531.20 for xanthohumul glucuronide metabolite with its fragment ion at m/z 299.10 and 179.10, based on the preliminary tests, as shown in Figure 3. Image data were generated using MassLynx Software and MALDI-Image converter, and handled with BioMap 3.7.5.5.
Figure 4 shows the images of xanthohumol aglycone in the liver slices for both fragment peaks of m/z 299 and 179. We observed a fairly diffuse distribution of the compounds throughout the tissue. The low-signal intensity towards the bottom of the tissue did not appear to be an artifact; xanthohumol filled up the tissue.
Figure 5 shows the images of xanthohumol aglycone in the intestines from both fragment peaks of m/z 299 and 179. It appears that xanthohumol is more concentrated on the outer portion of the tissue and it appears to suggest a diffuse mechanism as if xanthohumol is filling up the tissue from the outer portion into the center of the tissue cross section.
Figure 6 shows the images of xanthohumol glucuronide metabolite in the intestines from both fragment peaks of m/z 299 and 179. It appears that the metabolite is concentrated on the epithilium portion of the tissue, suggesting that the metabolite was excreted from the lumen of the intestine.
Figure 7 shows the images of xanthohumol in the colon tissue from both fragment peaks of m/z 299 and 179. It appears that xanthohumol is concentrated in the colon folds.
Figure 8 shows the images of xanthohumol glucuronide metabolite in the colon tissue from both fragment peaks of m/z 299 and 179. It appears that the metabolite has very similar distribution in the tissue as the aglycone and it is also concentrated in the colon folds.
720003707, September 2010