• Application Note

Automated Lipid Identification Using UPLC-HDMSE in Combination with SimLipid

Automated Lipid Identification Using UPLC-HDMSE in Combination with SimLipid

  • Giorgis Isaac
  • Stephen McDonald
  • Giuseppe Astarita
  • Waters Corporation

For research use only. Not for use in diagnostic procedures.

Abstract

This application note illustrates a streamlined workflow using UPLC with ion mobility time-of-flight MSE (HDMSE) in conjunction with SimLipid Software for the high throughput and automated identification of lipids in complex biological matrices. UPLC and HDMSE provide multiple degrees of orthogonal separation and unprecedented peak capacity, and, for lipidomic analyses, produce a large amount of data. SimLipid Software facilitates this data processing to increase confidence in interpreting lipidomics datasets and identifing lipids.

Benefits

Employs UPLC/ion mobility/time-of-flight (TOF) MSE (HDMSE) in combination with SimLipid Software for the high throughput and automated identification of lipids in complex biological matrices.

Introduction

Lipids constitute one of the largest classes of macromolecules, together with nucleic acids, proteins, and carbohydrates. Lipids play key biological roles in all organisms and therefore their analysis is of major interest in nutritional, pharmaceutical, and biological research. More recently, the ability of lipids to store energy have also attracted the interest of the biofuel community. Therefore, there is a need to develop comprehensive analytical approaches that allow for the automatic analysis and identification of lipids in complex biological mixtures.

Chemically, lipids are hydrophobic or amphipathic small molecules (<1,500 Da) of biosynthetic origin, which can be counted in the order of tens of thousands. Because their chemical structures vary widely, lipids are classified in eight main categories, each with its own sub-classification hierarchy according to the LIPID MAPS lipid classification system. 

To date, mass spectrometry (MS) is the technique of choice for a large scale lipid analysis (lipidomic analysis). MS-based lipidomic techniques are diverse in both method of sample introduction and detection. We have previously shown UPLC-based methods for lipid separation with a variety of unique chemistries.1-4 UPLC separation is needed to fully address the complexity of lipid analysis in biological samples, both for reducing ion suppression from highly abundant lipids, and for improving separation of isomeric lipid species. Detection and quantification of lipid species becomes possible over a large dynamic range with greater full scan sensitivity than traditional methods. 

However, UPLC-MS-based lipidomic analyses produce a large amount of data  and data processing is the slowest step in any lipidomic workflow. Currently there are several online resources that can be used to facilitate lipid identification. The limitations associated with these resources include limited automation and reporting. It is indeed extremely time-consuming and laborious to manually interpret lipidomics datasets and identify lipids. 

In this application note we introduce a combination of novel analytical (UPLC-HDMSE) and informatic (SimLipid) tools for higher throughput and automated identification of lipid species from biological tissues.

Experimental

Sample preparation

Total lipid extract from bovine liver was purchased from Avanti Polar Lipids and re-suspended in isopropanol/acetonitrile/water (2/1/1, v/v/v) at a final concentration of 0.1 mg/mL. 5 µL were injected into the system.

LC conditions

LC system:

ACQUITY UPLC

Column:

ACQUITY UPLC CSH C18 2.1 x 100 mm, 1.7 μm

Column temp.:

55 °C

Flow rate:

400 μL/min

Mobile phase A:

Acetonitrile/water (60:40) with 10 mM ammonium formate and 0.1% formic acid

Mobile phase B:

2-Propanol/acetonitrile (90:10) with 10 mM ammonium formate and 0.1% formic acid

Injection volume:

5 μL

Weak wash:

Acetonitrile/water (60:40) in 0.1% formic acid

Strong wash:

2-Propanol/acetonitrile (90:10) in 0.1% formic acid

Gradient

Time (min)

%A

%B

Curve

Initial

60

40

Initial

2.0

57

43

6

2.1

50

50

1

12.0

46

54

6

12.1

30

70

1

18.0

1

99

6

18.1

60

40

6

20.0

60

40

1

MS conditions

MS system:

SYNAPT G2 HDMS

Acquisition mode:

MSE and HDMSE

Ionization mode:

ESI positive/negative

Capillary voltage:

2.0 KV (for positive)

1.0 KV (for negative)

Cone voltage:

30 V

Desolvation temp.:

550 °C

Desolvation gas:

900 L/Hr (nitrogen)

Source temp.:

120 °C

Acquisition range:

100 to 1200 m/z

Results and Discussion

UPLC-HDMSE analysis of lipids in real biological samples

To identify the complex variety of lipid species present in biological samples, a lipid analysis workflow was developed using the Waters UPLC/ion mobility/TOF MSE (HDMSE) SYNAPT G2 HDMS System. 

A lipid mixture from bovine liver was separated using Charged Surface Hybrid (CSH) C18 UPLC (for more details on the chromatographic method, please see Reference 1). CSH C18 was made by applying controlled low-level positive charges to Ethylene Bridged Hybrid (BEH) particle surface, which was then bonded with C18.5 These low-level charges enhanced the lipid separations based on their acidic, basic, and neutral properties, providing excellent separation, peak shape, and chromatographic reproducibility, as shown in Figure 1. 

Figure 1. Representative ULPC-HDMSE chromatogram. UPLC-HDMSE increases peak capacity through the added dimension of ion mobility separation, which increases the specificity of lipid identification.

After chromatographic separation, lipids were ionized and entered in the mass spectrometer, where they passed through the Ion Mobility Separation (IMS) cell. A T-Wave mobility separator uses a repeating train of DC pulses to propel ions through the gas-filled cell in a mobility dependent manner. Lipids migrate with characteristic mobility times (drift times) according to their size and shape. For example, differences in the acyl chain length or number of double bonds affect the shape and size of lipid molecules, resulting in characteristic drift times. 

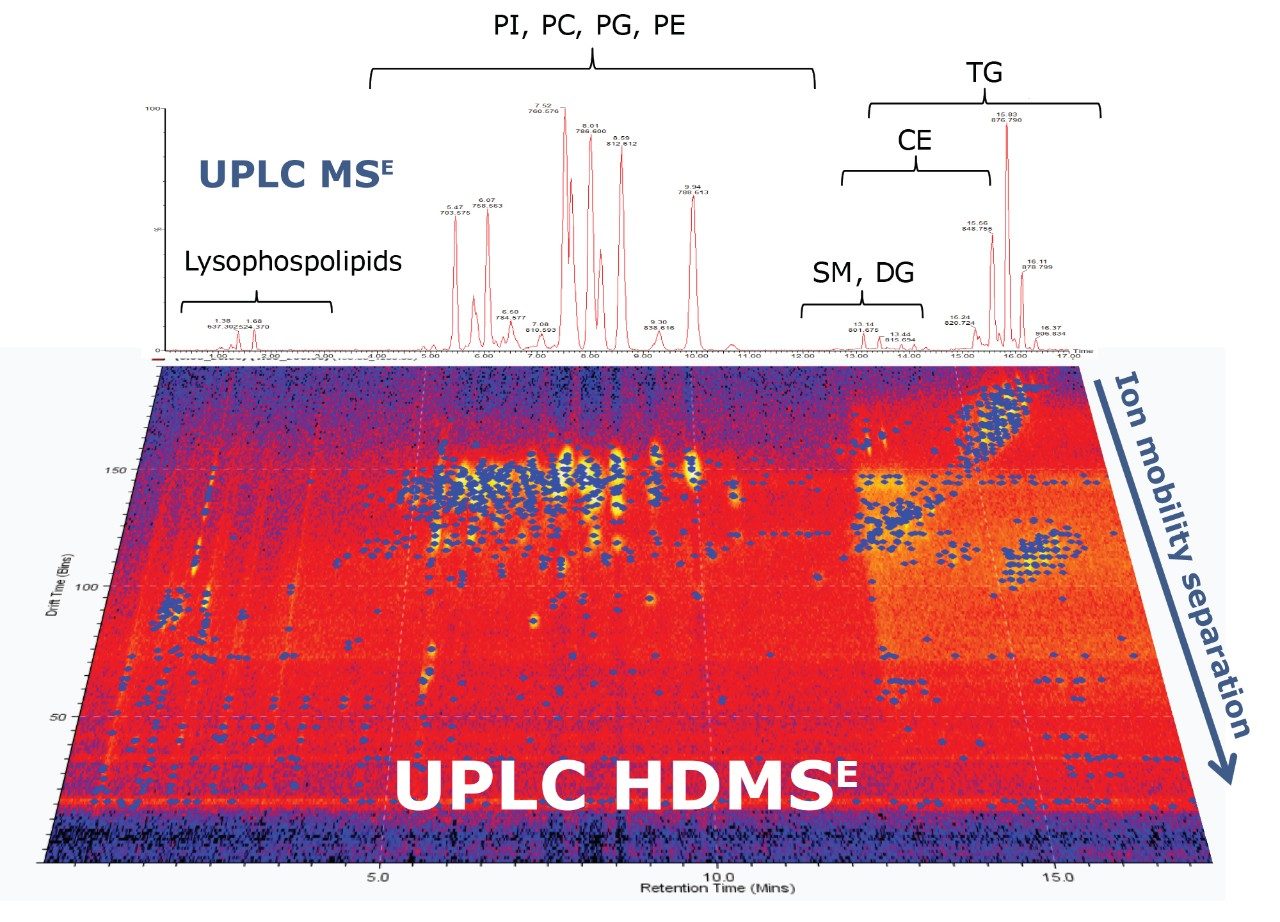
Therefore, IMS provides an additional degree of separation besides chromatography, improving peak capacity over conventional UPLC, as shown in Figure 1. This leads to a better separation of lipid species and increased selectivity. 

Finally, the lipid ions exiting the IMS cell were fragmented in the transfer T-Wave cell in MSE mode, which utilizes parallel low and elevated collision energy to acquire both precursor and product information for virtually every detectable ion in a single analytical run.4 The transfer T-Wave delivers the mobility separated ions to the time-of-flight mass analyzer, which records ion arrival times (or drift times).

The combination of IMS and MSE – known as HDMSE – provides increased specificity and hence confidence for lipid identification in complex biological mixtures, reducing false-positive identifications. HDMSE has several advantages over previous methods traditionally used to obtain the product ion data, such as multiple reaction monitoring or data dependent acquisition. Indeed, no prior knowledge of the lipid ions of interest is required and there is no loss of data due to poor duty cycle. Therefore, HDMSE acquisition is ideal for the rapid analysis of unknown lipid mixtures in biological samples. 

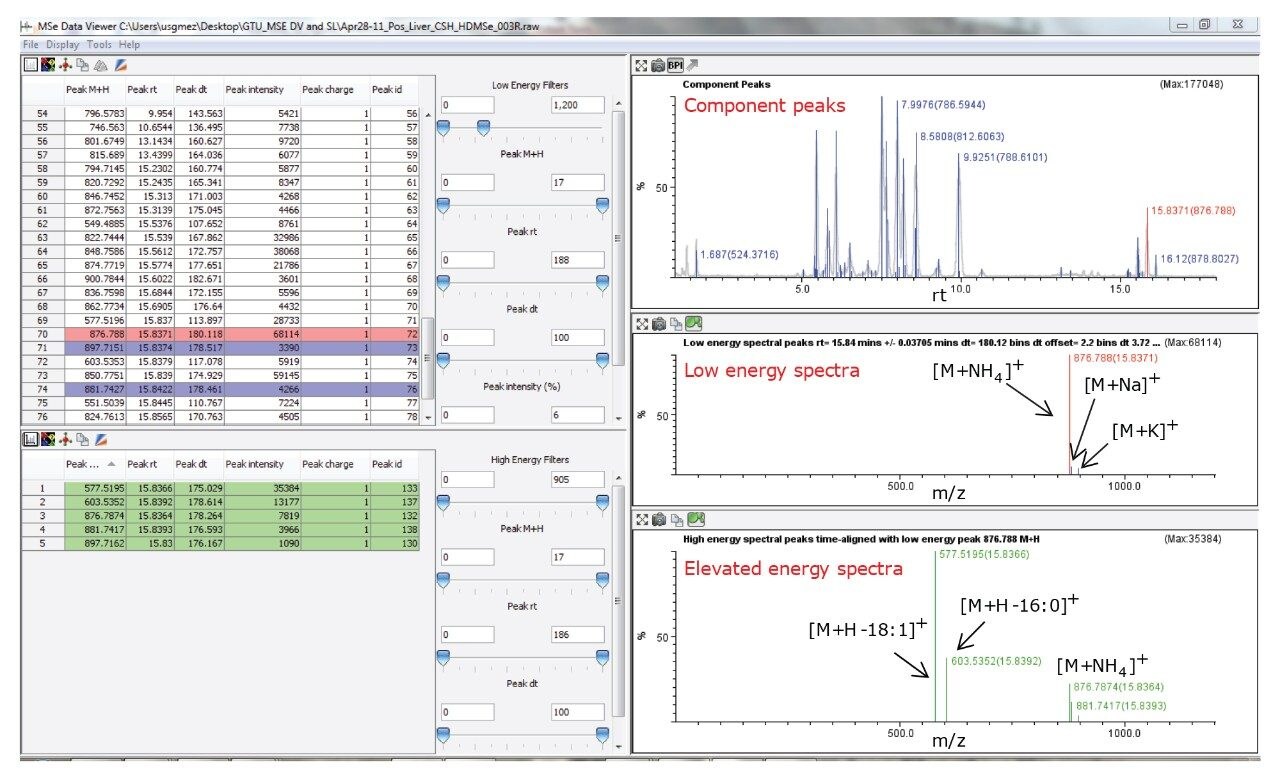
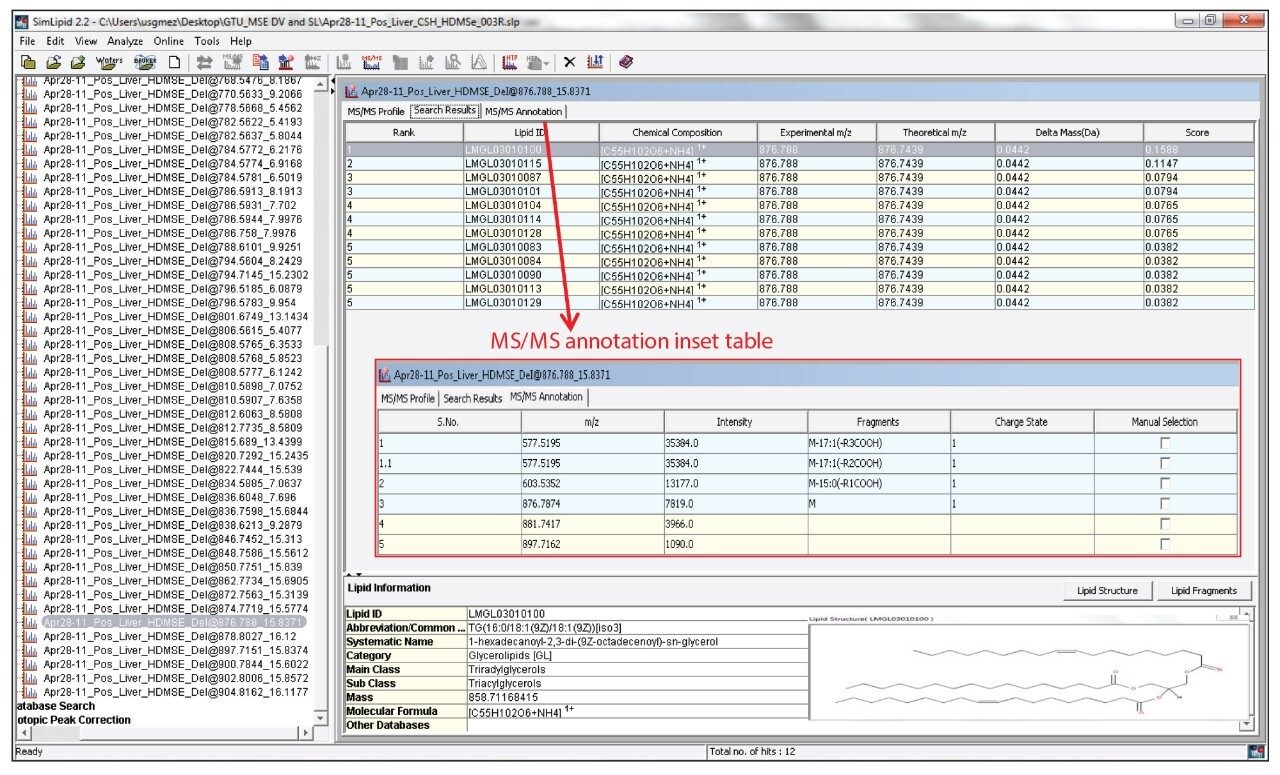
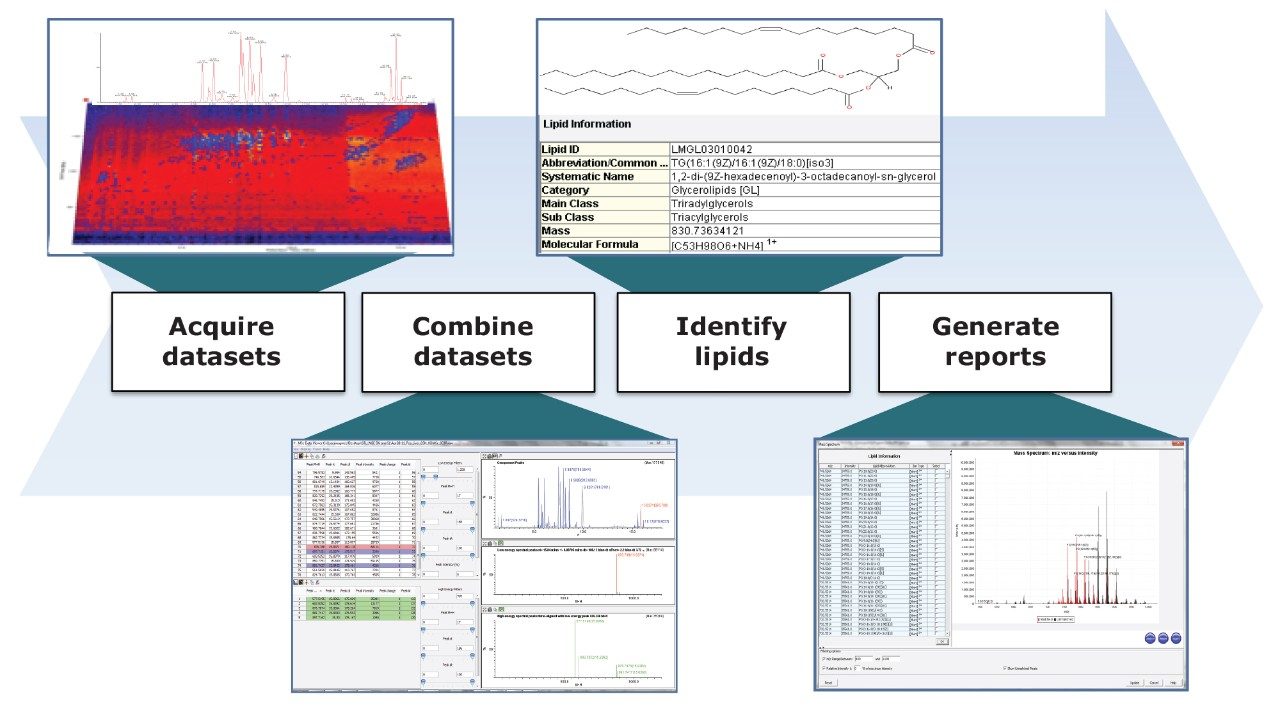
The data generated by UPLC-HDMSE was extracted using Waters MSE Data Viewer, software developed for visualization, processing, and interpretation of multi-dimensional MS or HDMS data, as shown in Figure 2. MSE Data Viewer uses a Waters proprietary algorithm, Apex 4D, to assign a unique retention time, drift time, m/z, and intensity to each individual lipid ion in the mixture. Precursor and product spectra are then aligned according to retention and drift times and linked together. An example of this application is shown in Figure 2, in which a lipid extract from bovine liver was analyzed by UPLC-HDMSE and MSE Data Viewer was used to process the datasets, which were then used for lipid identification through SimLipid Software.

Figure 2. MSE Data Viewer aligns precursor and corresponding product ion spectra for each lipid species sorting them by retention and drift times. The red highlighted m/z 876.788 shows the selected lipid species (ammonium adduct of 16:0/18:1/18:1 TG). The blue highlighted m/z 881.7427 (sodium adduct of 16:0/18:1/18:1 TG) and 897.7151 (potassium adduct of 16:0/18:1/18:1 TG) show co-eluting lipid species within the retention- and drift-time tolerance window. The elevated energy product ions at m/z 577.5195 and 603.5352 are due to neutral loss of the 18:1 and 16:0 respectively.

Lipid identification using SimLipid Software

The dataset processed in MSE Data Viewer can be imported into SimLipid, a powerful lipid identification software from Premier Biosoft, shown Figure 3. SimLipid accepts the experimental UPLC-MSE and UPLC-HDMSE data (retention time, m/z, drift time, and intensity values) in their native file format. Then the software matches the exact masses of the precursor and product ions of unknown lipids with those on an in silico database containing over 22,000 lipid species belonging to the major lipid classes (fatty acyls, glycerolipids, glycerophospholipids, sphingolipids, sterols, prenols, saccharolipids, and polyketides). Table 1 shows the major features of SimLipid. Users can perform MS and MS/MS lipid search for high resolution data with an error tolerance of 1 to 20 ppm or 0.1 to 2000 mDa. SimLipid supports [M+H]+, [M+NH4]+, [M+Na]+, [M+C5H12N]+, [M+Li]+ ions in the positive ion mode and [M-H]-, [M+AcO]-, [M+Cl]-, [M-CH3]-, [M+OAcO]-, and [M+HCOO]- in the negative ion mode, as shown in Table 1.

Table 1. Major features of SimLipid Software.

SimLipid assigns a probability score to the unknown lipid structure according to the best fit of the experimental m/z values with the theoretical m/z values of both precursor and product ions of the SimLipid database, shown in Figure 3. By matching the exact masses of the characteristic product ions, in addition to precursor ions, SimLipid is able to identify isomers with similar m/z, reducing the misidentification of lipid structures. 

Figure 3. SimLipid Software identifies lipid species using accurate mass precursor and product ion information. The rows in the inset table highlighted in blue indicate experimental product ions matched to the in silico generated product ions.

The following analysis was performed in order to demonstrate the lipid identification workflow. A bovine liver lipid extract was analyzed by UPLC-HDMSE and processed using MSE Data Viewer. Among the list of ions generated, the mixture contained an abundant lipid component at m/z 876.788 (low level collision energy mass corresponding to the precursor ion), 15.84 min (retention time, rt), and 180.12 ms (drift time, dt), shown in Figure 2. Such information could be associated with different lipid structures and does not provide the specificity needed to elucidate the chemical structure of the unknown lipid. However, HDMSE provided additional information on characteristic product ions (m/z 577.5195 and 603.5352) derived from the parallel use of elevated collision energy in the same analytical run, shown in Figure 2. These datasets were incorporated in SimLipid, which was able to automatically confirm the identity of the unknown lipid as the triacylglyceride 16:0/18:1/18:1 [iso3], by matching the experimental masses of the precursor and product ions with the theoretical masses contained in its database, shown in Figure 3. In fact, using precursor MS search, only m/z 876.788 was identified by SimLipid as the ammonium adduct [M+NH4]+ of the triacylglycerol species with 52 carbons and two double bonds (52:2). However by adding the MS/MS search, SimLipid was able to automatically identify the characteristic fragments at m/z 577.5195 and 603.5352 as the molecular ion after neutral losses of the ammoniated fatty acyl groups 18:1 and 16:0 respectively, shown in Figure 3. Therefore, SimLipid allowed determination of the nature of the acyl chains substituent and discriminated among isomeric triacylglycerol species in a single step, shown in Figure 3. The high throughput MS and MS/MS data analysis feature in SimLipid allows automatic identification of product ions and hence structure for each precursor ions observed at different retention time points in batch mode. Each batch run is assigned a unique ID and a comprehensive report can be generated. Multiple batch runs can be launched simultaneously reducing the analysis time considerably.

In addition, SimLipid automatically displays the chemical structure of the identified precursor ion, and annotates the corresponding fragments, shown in Figures 3 and 4. Additional information on the identified lipid such as lipid abbreviation, systematic name, composition, and links to open-access database were also made available for easy reference. Furthermore, to facilitate accurate quantitation of lipids from biological mixtures, SimLipid provides a high-throughput module to calculate isotope percentages and correct the experimental peak intensities observed for their isotopic overlaps, shown in Table 1. Finally, SimLipid can annotate mass spectra with the lipids identified for MSE data and generate reports in different formats (CSV, XLS, HTML, JPEG, and PNG) for information sharing and further processing of the data, shown in Figure 4 and Table 1.

Figure 4. SimLipid Software generates report in different file format, which can be used for further statistical analysis, publication, or sharing information with colleagues.
Figure 5. The Waters global lipid identification workflow encompasses a combination of analytical and informatic tools.

Conclusion

The workflow detailed in this application note provides a simple and robust solution for the high-throughput, automated identification of lipids using novel analytical and informatic tools, as shown in Figure 5. 

The use of UPLC coupled to HDMSE provides multiple degrees of orthogonal separation, delivering unprecedented peak capacity. The addition of the SimLipid Software to our workflow offers an integrated informatics solution for lipid identification, utilizing the datasets generated by Waters’ instruments. 

In conclusion, the combination of UPLC-HDMSE and SimLipid allows for a confident identification of lipid species in a biological mixture.

References

  1. Isaac G, et al. Lipid Separation Using UPLC with Charged Surface Hybrid Technology. 2011, 720004048en.
  2. Shockcor J, et al. Analysis of Intact Lipids from Biologics Matrices by UPLC-High Definition MS. 2010, 720003349en.
  3. Ritchie M and Goh E. Rapid Lipid Profiling of Serum by Reverse Phase UPLC-Tandem Quadrupole MS. 2011, 720004035en.
  4. Mal M and Wong S. A HILIC-Based UPLC-MS Method for the Separation of Lipid Classes from Plasma. 2011, 720004048en.
  5. Iraneta P. C., et al. Charged Surface Hybrid (CSH) Technology and Its Use in Liquid Chromatography. 2011, 720003929en.

Acknowledgements

The authors would like to thank Arun Apte, Ningombam Sanjib Meitei and Radha Nigam from PREMIER Biosoft, Palo Alto CA for their review and constructive comments.

720004169, December 2011

Back To Top Back To Top