• Application Note

Determination of Low Level Lactose in Dairy Products Using UHPLC-MS

Determination of Low Level Lactose in Dairy Products Using UHPLC-MS

  • Jinchuan Yang
  • Paul D. Rainville
  • Kai Liu
  • Ben Pointer
  • Waters Corporation
  • Eurofins Nutrition Analysis Center

Abstract

This method demonstrates that it is suitable for the lactose determination in dairy products, including low lactose and lactose-free dairy products.

Benefits

  • Accurate measurement of low level of lactose in dairy foods
  • Minimal matrix interference using MS detection
  • Suitable for analysis of lactose-free and low lactose food products

Introduction

Lactose is found primarily in dairy products and can cause discomfort in people who are lactose intolerant. Lactose intolerance is a consequence of lactase deficiency in the small intestine to break lactose down into glucose and galactose. Rates of lactose intolerance vary between regions, from less than 10% in Northern Europe to as high as 95% in parts of Asia and Africa.1 While low lactose and lactose-free products are available on the market, it is critical to ensure the label claim of these dairy based food products. Some countries have established the threshold levels for the terms of “lactose-free” and “low lactose”. These threshold values vary from country to country, but the common threshold levels for lactose-free and low lactose are 10 mg lactose and 1 gram lactose per 100 gram of final products, respectively.2 The main challenges in the low level lactose analysis are the detection sensitivity and the matrix interference. 

Herein we demonstrate a lactose analysis method for dairy products using an ACQUITY Arc System, an ACQUITY QDa Mass Detector, and an XBridge BEH Amide XP Column (2.5 µm, 3.0 × 150 mm). The method limit of quantitation (LOQ) is estimated at 2.5 mg per 100 gram of final products with minimal interference from the matrix. The total run time of chromatography analysis is 25 min. Figure 1 shows typical single ion recording (SIR) chromatograms of lactose in various dairy products. 

Experimental

Sample description

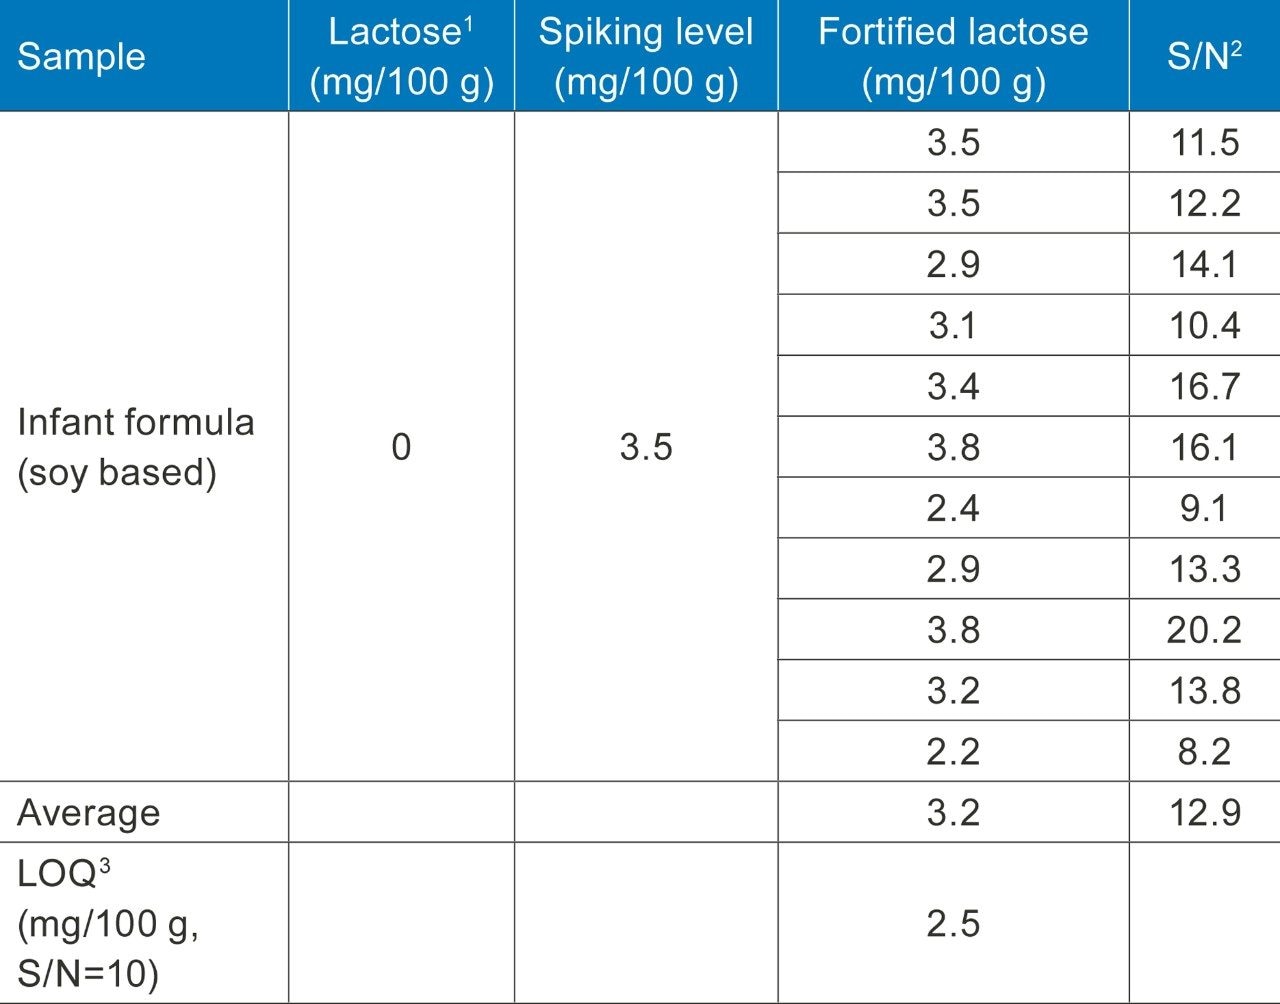
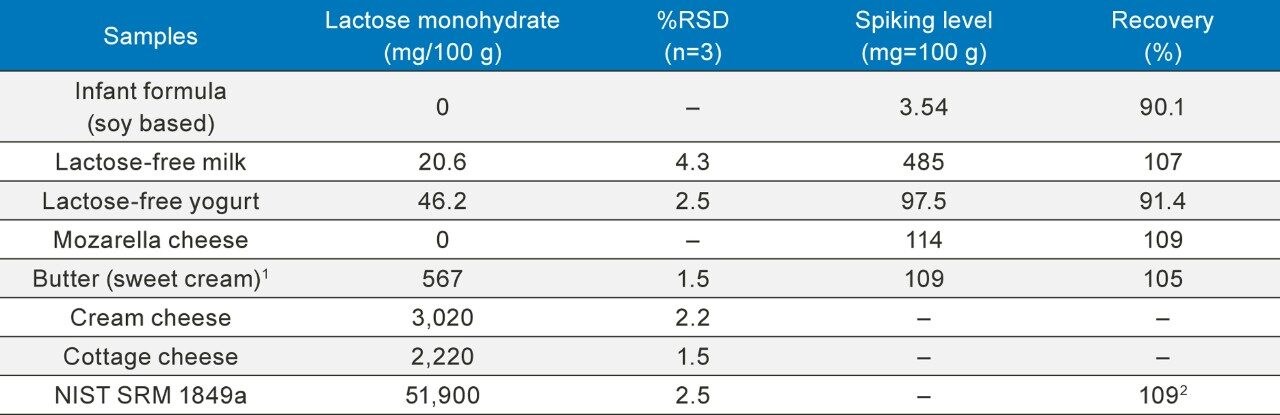
Samples of various types of dairy food, including soy-based infant formula, lactose-free milk, yogurt, cheese, and butter were purchased from local grocery stores. Lactose monohydrate was from Fisher Chemical (Fisher Scientific). The 13C isotope labeled lactose monohydrate, [1',2',3',4',5',6'-13C6] lactose monohydrate, was purchased from Omicron Biochemicals (South Bend, IN, USA). 

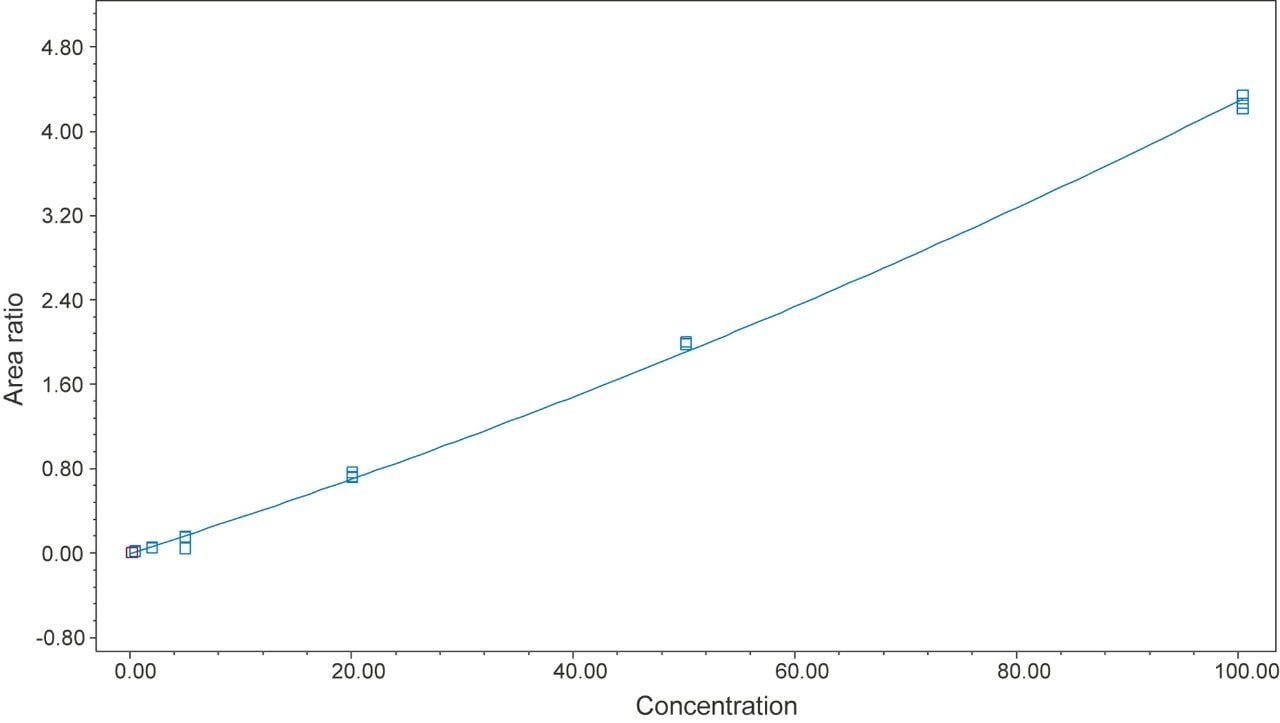
Standard stock solutions of lactose and isotope labeled lactose were prepared in water (Milli-Q) at 10 mg/mL (lactose) and 2 mg/mL (13C6-lactose), respectively. Standard solutions were prepared by serial dilution with acetonitrile-water mixture (1/1 v/v) to concentration levels of 0.2, 0.5, 2, 5, 20, 50, and 100 µg/mL. The internal reference standard (13C6-lactose) in these standard solutions was kept at 40 µg/mL.

Sample solutions were prepared as follows, which is slightly modified from a literature procedure:3

  • Add approximately 2 to 5 g sample to a 25 mL volumetric flask
  • For powder or solid samples, add 10 mL ethanol-water (1/1 v/v); for liquid or semi-liquid samples, add 5 mL ethanol, shake well, then add 5 mL ethanol-water (1/1 v/v) mixture
  • Mix well and sonicate in a water bath (60 °C) for 25 min
  • Add 500 μL Carrez 1* reagent, vortex for 1 min
  • Add 500 μL Carrez 2** reagent, vortex for 1 min
  • Add 5 mL acetonitrile, mix well
  • Make to 25 mL mark with ethanol-water (1/1 v/v) mixture
  • Mix well and transfer to a 50 mL centrifuge tube
  • Centrifuge at a 1900 rcf for 5 min
  • Filter supernatant through a 0.2 μm PVDF syringe membrane filter

*Carrez 1 reagent- dissolve 0.36 g K4[Fe(CN)6].3H2O in 10 mL water

**Carrez 2 reagent- dissolve 0.72 g ZnSO4.7H2O in 10 mL water

The supernatant was further diluted with water-acetonitrile (1/1 v/v) at various dilution ratios before they were analyzed. Aliquot of the internal reference standard (13C6-lactose) stock solution was also added in sample vials for a final in-vial concentration of 40 μg/mL.

Method conditions

LC conditions

System:

ACQUITY Arc System

Runtime:

25 min

Column:

XBridge BEH Amide XP, 2.5 μm, 3.0 x 150 mm (p/n: 186006725)

Column temp.:

90 °C

Mobile phase:

90:6:4 acetonitrile:water:methanol with 0.05 v/v% diethylamine and 500 ppb guanidine hydrochloride

Flow rate:

0.8 mL/min

Injection volume:

1.0 μL

Column conditioning

New columns need to be properly conditioned to ensure optimal chromatographic performance. This is especially required for hydrophilic interaction liquid chromatography (HILIC) columns, for which a careful and thorough column conditioning prior to the initial use is recommended.4 All new XBridge BEH Amide XP Columns used in this study were flushed with 50 column volumes of 80:20 acetonitrile:water, followed by 100 column volumes of the 90:6:4 acetonitrile:water:methanol mixture with 0.05 v/v% Diethylamine and 5 mg/L guanidine hydrochloride. Once new column has been such conditioned, no further conditioning was conducted.

MS conditions

MS system:

ACQUITY QDa (Performance)

Ionisation mode:

ESI

Capillary voltage:

0.8 kV

Cone voltage:

5.0 V

Probe temp.:

600 °C

Acquisition rate:

2 Hz

Full scan:

100–500 m/z

Curve fit:

Quadratic, 1/x weighing

Smoothing:

Mean, Level 7

SIR [M+Cl]-:

377.1 Da for lactose; 383.1 Da for 13C6-lactose

Results and Discussion

Co-eluting interferant

Potential interferant from lactose isomers has been investigated by measuring their retention factors under the same LC conditions that are provided in the Experimental section. Table 1 shows the retention factors (K') of lactose and its isomers, including allo-lactose, epi-lactose, and lactulose. Out of the nine lactose isomers, only cellobiose co-elutes with lactose. Fortunately, cellobiose is rarely found in dairy products, so it should not be a concern in the lactose determination. Other compounds were baseline separated from lactose with resolutions of 1.5 or greater (chromatograms of these compounds were not shown).

Table 1. Retention factors of lactose and lactose isomers.
Figure 1. SIR (377 Da) chromatograms of lactose in dairy products. Sample dilution factors in the final preparation step are shown in chromatograms. 

Calibration

13C labeled lactose (13C6-lactose) was spiked in the standard solutions and in the sample solutions at the same concentration level (40 µg/mL). It was used as an internal reference peak to normalize the variation in mass spectrometry ionization and detection. The MS peak area ratios of lactose to 13C6-lactose were plotted against the lactose concentration to obtain a calibration curve. Figure 2 shows a typical calibration curve. R2 of 0.995 was obtained for a quadratic fitting over a concentration range from 0.2 to 100 µg/mL.

Figure 2. Plot of MS peak area ratio (lactose to 13C6-lactose) vs lactose concentration from 0.2 to 100 ppm. A calibration curve of R2 0.995 was obtained with a quadratic fitting model.

Sensitivity

The method quantification sensitivity was evaluated with a complex sample matrix, a soy-based infant formula. Infant formula contains all kinds of nutrients, such as protein, fat, carbohydrates, vitamins, and elements. Milk based infant formula contains a significant amount of lactose, and it is not suitable for the sensitivity evaluation. The soy-based infant formula sample was measured first to confirm there was no lactose present, then it was spiked with low level of lactose at 3.5 mg/100 g, and was measured multiple times (n=11) to estimate the lactose peak signal to noise (S/N) values. The LOQ of 2.5 mg per 100 g of ready-to-feed liquid was estimated at S/N of 10. Table 2 shows the data used for LOQ estimation. 

Table 2. Results of a spiking experiment with a soy-based infant formula and the estimated  LOQ at S/N of 10.

Note: 1) Lactose is expressed as lactose monohydrate in mg per 100 gram of ready-to-feed infant formula liquid. The dilution factor from IF powder is 0.123 based on the product direction for preparation guide; 2) Signal/Noise: Average peak-to-peak noise is used for S/N calculation; 3) LOQ is estimated by a linear interpolation to S/N at 10.

Accuracy and precision

Table 3 shows the results of the lactose measurement for food products and the spiking experiments. The food products  included soy-based infant formula, lactose-free milk, and yogurt, cheeses, butter, and a NIST infant formula reference material (NIST SRM 1849a). The lactose content determined in these samples ranged from 0 to 51.9 g/100 g, the relative standard deviation (RSD) in these measurements were less than 4.3%. Spiking experiments were conducted with the lactose-free and low lactose samples. The lactose spiking level ranged from 3.5 mg/100 g to 485 mg/100 g, and the obtained recovery values were between 90% to 110%. In addition, the lactose measurement of NIST SRM 1849a showed a value of 51.9 g/100 g, which was 109% of the reference value of 47.6 g/100 g. Chromatograms of some food samples are shown in Figure 1.

Table 3. Determined lactose in dairy foods and the recovery results for spiking experiments on lactose-free and low lactose dairy foods.

Note: 1) Butter is made from sweet cream. 2) NIST SRM 1849a lactose monohydrate reference value is 47,600 mg/100 g. Measurement accuracy is 109%.

Conclusion

This lactose analysis method offers a sensitive, accurate, reliable, and robust way to determine lactose in dairy products. The estimated LOQ in the presence of sample matrix was about 2.5 mg/100 g, which is lower than the common threshold level for lactose-free products. This method has few co-eluting interferences. The common lactose interferants, such as allo-lactose, epi-lactose, and lactulose, are all baseline separated from the lactose peak. Spiking experiments on different dairy products at multiple spiking levels ranging from 3.5 mg to nearly 500 mg per 100 g food products showed excellent recovery (90–110%). The measurement of NIST SRM 1849a also showed an accuracy of 109%. The variability (RSD) in lactose determination in dairy products was less than 4.3%. The total cycle time  per injection is 25 minutes. This method demonstrates that it is suitable for the lactose determination in dairy products, including low lactose and lactose-free dairy products.

References

  1. Deng, Y; Misselwitz, B; Dai, N; Fox, M. Lactose Intolerance in Adults: Biological Mechanism and Dietary Management. Nutrients. 2015, 7 (9), 8020–8035.
  2. Scientific Opinion on lactose thresholds in lactose intolerance and galactosaemia, EFSA Panel on Dietetic Products, Nutrition and Allergies (NDA), European Food Safety Authority (EFSA), Parma, Italy. EFSA J. 2010, 8 (9), 1777.
  3. Chavez-Servin, J L; et al. Analysis of Mono and Di-saccharides in Milk Based Formulae by High Performance Liquid Chromatography with Refractive Index Detection. J. Chromatogr., A. 2004, 1043 (2), 211–215.
  4. XBridge XP 2.5 µm Columns. Waters Care and Use Manual 720004162EN, March 2012.

720006574, June 2019

Back To Top Back To Top