This application note demonstrates the utility of UltraPerformance LC (UPLC) technology and Empower 2 Software for efficient method development of impurity profiles.
Many pharmaceutical analytical applications are focused on the identification and quantification of the active pharmaceutical ingredient (API) and related impurities. This activity requires a high-resolution validated methodology, which is often time consuming to develop. The method development bottleneck results from the requirement to generate a quantitative and qualitative profile of impurities, enabling the reporting of the identity and quantity of each chemical moiety.1
The impurities that are frequently present are a small fraction of the main component, with identification and reporting requirements of impurity peaks at 0.05% area relative to the API. Due to the low concentration of these impurities, high instrument sensitivity and selectivity become a necessity in order to demonstrate process compliance to regulatory agencies without compromising the quality throughput needed to meet the fiscal demands of the business.
When taken orally, simvastatin, a well-known prescribed class of statin for lowering cholesteral, hydrolyzes to the β-hydroxy acid form, which acts as an inhibitor of 3-hydroxy-3-methylglutaryl-coenzyme A (HMG-CoA) reductase enzyme involved in the in vivo synthesis of cholesterol.2
There are several methods for analyzing simvastatin and its related impurities. Two official methods utilizing HPLC gradient methodology are reported in the European Pharmacopoeia (EP) and the United States Pharmacopoeia (USP).3,4 These methodologies are typically time consuming, with analysis times in excess of 30 minutes. To meet the business needs of a generic pharmaceutical company, a faster methodology is required that does not compromise analytical quality.
This study demonstrates the utility of UltraPerformance LC (UPLC) technology and Empower 2 Software for efficient method development of impurity profiles.
In this application, we show how the HPLC method for simvastatin has been redeveloped on UPLC and is compatible for both UV and mass detection. The analytical goals were to meet the requirements stated in the USP 30-NF 25 monograph for simvastatin drug substance for chromatographic purity and possibly be used for the assay. Empower 2 custom reporting, custom fields, and spectral analysis were used in streamlining the decision making process during method development.
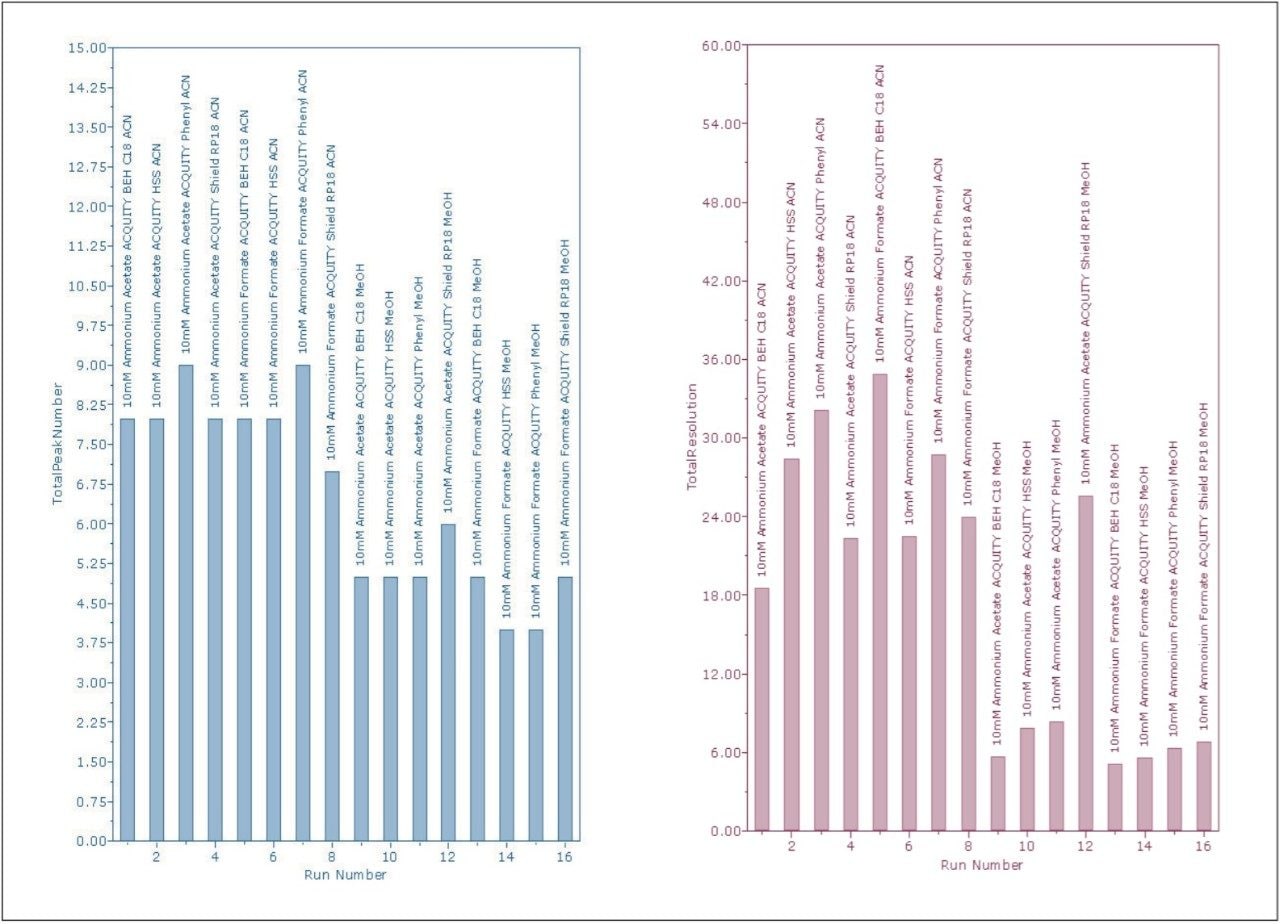
Traditionally, method scouting involves an experimental process of screening columns, mobile phase composition, and pH. In this particular application test case, some parameters can be eliminated immediately before the scouting process to better speed the analysis time and limit collection of unwanted data.
Columns with 50-mm lengths decrease analysis time while evaluating which chemistry and solvent conditions will work best. Further research revealed that the pH range for optimum simvastatin analysis is best within pH 4 to 6, due to the rapid hydrolytic degradation of simvastatin above pH 6 and spontaneous degradation at pH 9.5 In substitution of the screening at alkaline pH, two different types of buffers at pH 4.0 were used during the scouting injections.
LC system |
ACQUITY UPLC System with Column Manager |
Column dimensions |
2.1 x 50 mm, 1.7 μm (1.8 μm for HSS) |
Column 1: |
ACQUITY UPLC HSS C18, (p/n 186003538) |
Column 2: |
ACQUITY UPLC BEH C18, (p/n 186002350) |
Column 3: |
ACQUITY UPLC Phenyl, (p/n 186002884) |
Column 4: |
ACQUITY UPLC Shield RP18, (p/n 186002853) |
Column temp.: |
30 °C |
Flow rate: |
800 μL/min |
Mobile phase A1: |
15 mM ammonium formate, pH 4.0 |
Mobile phase A2: |
15 mM ammonium acetate, pH 4.0 |
Mobile phase B1: |
Acetonitrile |
Mobile phase B2: |
Methanol |
Gradient: |
Linear 2 to 100% B1 /3 min (ACN) Linear 2 to 100% B2 /5 min (MeOH) |
Empower 2 CDS Software
Method development was performed on a Waters ACQUITY UPLC System consisting of a Binary Solvent Manager (BSM), Sample Manager (SM) and Photodiode Array detector (PDA). A variety of 1.7-μm ACQUITY UPLC Columns were selected for the separation as described in the method conditions. All instruments were controlled and data collected and analyzed using Waters Empower 2 Chromatography Data Software (CDS). The ACQUITY UPLC Column Manager was employed to allow for the simple automated selection of four different columns.
Empower 2 was employed to mine data without the need for manual review of the numerous injections in whole data sets. Simple drop-down menus within the CDS allow for the rapid review of the effects of buffer type, solvent, pH, and column type. Interpretation of the method scouting data of simvastatin and related impurities, in conjunction with these custom reporting features, resulted in an easy-to-read summary report.
The report describes per each injection of varied condition. The total number of detected peaks and total resolution of these values were automatically calculated to determine an injection score. Injection scores can be configured to account for any chromatographic criteria that the method development group uses to make decisions (Figure 1).
Customized summary plots can either be bar charts or line plots (Figure 2). The summary plots indicated that the phenyl column with the ammonium formate buffer would yield the best average results. However, the phenyl column had difficulty resolving peaks RT=2.371 minutes and RT=2.385 minutes. A review of the four chromatograms, giving the greatest number of peaks and highest total resolution number (Figure 3), confirmed that the conditions for the ACQUITY UPLC HSS C18 Column with ammonium acetate resulted in the best resolution between the critical pairs of peaks RT=2.229 minutes and RT=2.328 minutes.
It was determined from the screening experiments that all of the peaks present in the ultraviolet trace were spectrally similar to simvastatin. The optical characteristics of the ACQUITY UPLC PDA Detector allowed for the generation of data with high spectral quality even at the low levels of detection allowing such determinations. Each peak was integrated and the UV spectral analysis (when normalized) clearly showed which impurity peaks were simvastatin-related (Figure 4).
The mass spectra data generated by the mass detector, the ACQUITY SQ, facilitated peak tracking during the method optimization process. Furthermore, the mass data allowed the confirmation of known impurities and identified the presence of an unknown impurity peak of [M+H] ion of m/z 421.2 that was not present on the UV chromatographic trace (Figure 5). The mass spectra also indicated NH3 adduct formations. The adduct formation was present in the spectra of all of the impurities and the API. The integrated peaks were assessed during the method optimization to obtain the best possible resolution from the API.
The UPLC method was optimized for the 1.8-μm ACQUITY UPLC HSS T3 2.1 x 50 mm Column with ammonium acetate pH 4.0 and acetonitrile as the mobile phase. Mass confirmation of many specified impurities and unspecified impurities facilitated peak tracking during the method optimization.
An experimental design of four injections were performed, including two different linear gradient slopes (5 and 10 minutes) and two different temperatures (30 and 50 °C) to optimize the LC separation. The resulting data was collected and entered into chromatographic modeling software.
Optimal conditions for the 1.8-μm ACQUITY UPLC HSS C18 2.1 x 50 mm Column to maximize chromatographic speed and resolution yielded a flow rate of 800 μL/min with a gradient from 52% B to 100% B over 2.5 min, with a 1.5 min hold at 100% B to elute the dimer at 2.85 min at 40 °C. The final method conditions resulted in the chromatogram displayed in Figures 6, 7.
LC system: |
ACQUITY UPLC |
Column dimensions: |
2.1 x 50 mm, 1.8 μm |
Column 1: |
ACQUITY UPLC HSS C18 column |
Column temp.: |
40 °C |
Flow rate: |
800 μL/min |
Mobile phase A: |
15 mM ammonium acetate, pH 4.0 |
Mobile phase B: |
Acetonitrile |
Gradient: |
52% B to 100% B over 2.5 min with a 1.5 min hold at 100% B |
MS system: |
ACQUITY SQ Detector |
Scan range: |
100 to 1000 |
Scan rate: |
10,000 amu/sec |
Cone voltage: |
20 V |
Source temp.: |
150 °C |
Desolvation temp.: |
450 °C |
Desolvation flow: |
800 L/Hr |
Total run time: |
4.0 min |
Inj.-to-inj. run time: |
5.0 min |
An efficient method development screening process was employed utilizing short UPLC columns and a generic gradient to fast-track the method analysis screening time. The process takes advantage of UPLC technology, delivering rapid method scouting.
The use of short UPLC columns allowed many column chemistries to be screened quickly in an automated manner using the ACQUITY UPLC Column Manager. Further optimization for resolution was achieved by varying gradient slope and temperature.
Data collected on the ACQUITY UPLC PDA and ACQUITY SQ detectors allowed for ACQUITY UPLC System with Column Manager spectral analysis within Empower 2 Software, which facilitated peak tracking (mass data), simvastatin relation (UV/mass data), and preliminary peak confirmation of identification. The use of specific labeling custom fields in Empower 2 allowed for the creation of custom reports to help expedite the mining of the resulting data which would normally take a considerable amount of manual review.
The utilization of the ACQUITY UPLC System and Empower 2 Software provided a timely solution to the method development challenges associated with impurity profiling.
720002185, April 2014