• Application Note

Multi-Residue Analysis of Pharmaceuticals and Personal Care Products (PPCPs) in Water Using the ACQUITY UPLC H-Class System and the Xevo TQD Tandem Mass Spectrometer

Multi-Residue Analysis of Pharmaceuticals and Personal Care Products (PPCPs) in Water Using the ACQUITY UPLC H-Class System and the Xevo TQD Tandem Mass Spectrometer

  • Claude R. Mallet
  • Gareth E. Cleland
  • Jennifer A. Burgess
  • Waters Corporation

Abstract

Many publications have shown that PPCPs are present at parts-per-trillion (PPT) levels in rivers and streams. Methods therefore need to be able to detect compounds at these trace levels. In addition to the low level detection of PCPPs, a major analytical challenge for analysis lies in the wide chemical diversity of compound classes and structures. Furthermore, the complexity of the water samples requiring analysis can be very diverse. This application note demonstrates the extraction, separation, and detection of 78 PPCPs including acidic, basic, and neutral compounds in well and surface water samples. Using the ACQUITY UPLC H-Class System with the small, benchtop Xevo TQD, it was possible to analyze all compounds in a single injection.

Benefits

  • Extraction and concentration of low levels of compounds with a wide range of chemical diversity
  • Use of a single LC-MS/MS method for separation and detection of PPCPs
  • Quantification of PPCPs in the sub part-per-trillion range

Introduction

In recent years, there has been increasing concern about the presence of pharmaceutical and personal care products (PPCPs)1 in water bodies throughout the world. The effect of these emerging contaminants on human health and their potential impact on the environment is not yet fully understood. As concern continues to grow, many government agencies around the world are funding studies to assess if PPCPs can cause harmful ecological effects.

Many publications have shown that PPCPs are present at parts-per-trillion (PPT) levels in rivers and streams.2-7 Methods therefore need to be able to detect compounds at these trace levels. In addition to the low level detection of PCPPs, a major analytical challenge for analysis lies in the wide chemical diversity of compound classes and structures, examples of which are shown in Figure 1. Furthermore, the complexity of the water samples requiring analysis can be very diverse. This application note demonstrates the extraction, separation, and detection of 78 PPCPs including acidic, basic, and neutral compounds in well and surface water samples.

Figure 1. Example compounds from the range of pharmaceuticals and personal care products used in this work.

Experimental

Samples

Two different water sample types were collected for analysis and stored at 4 °C prior to analysis. In addition, a reagent grade water sample with low levels of the PPCPs of interest was purchased for comparative analyses and to serve as a blank. Reagent grade water: LC-MS grade water (Fisher Chemical, Optima brand) Well-water sample: Sample collected from a local, private well-water source. Surface water sample: Sample collected from a local water reservoir.

Sample preparation

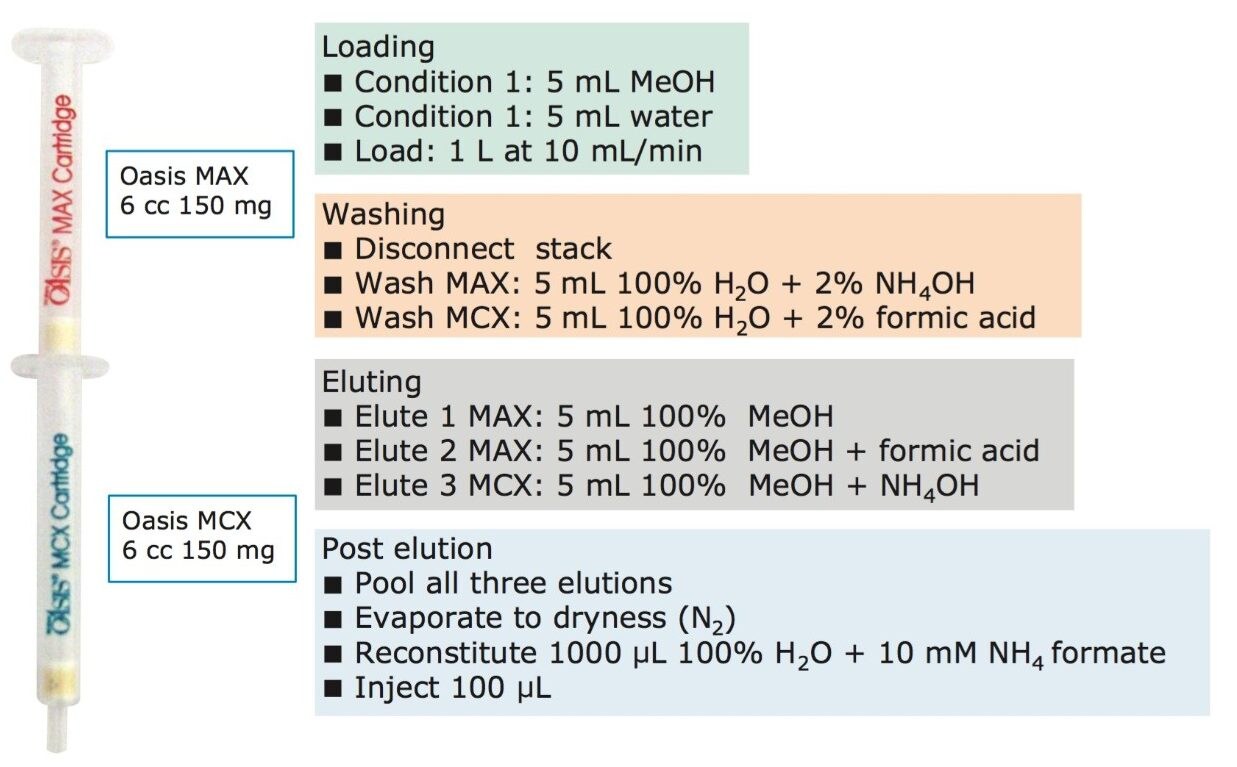
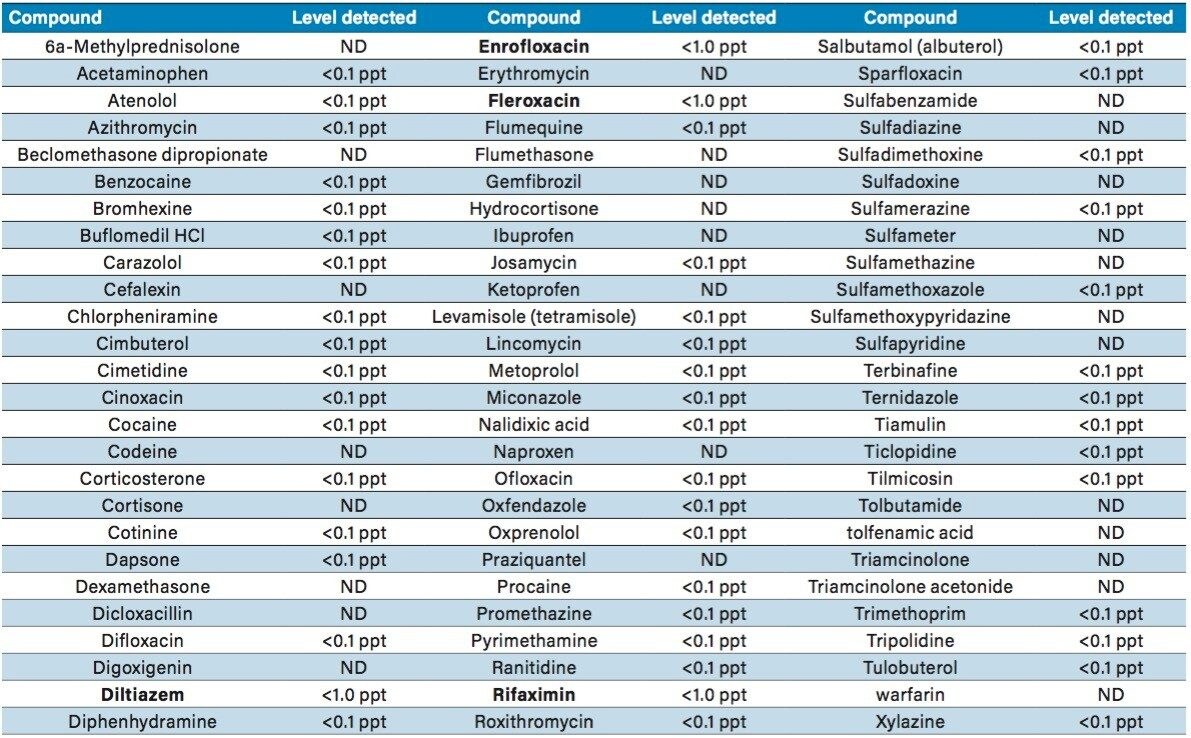
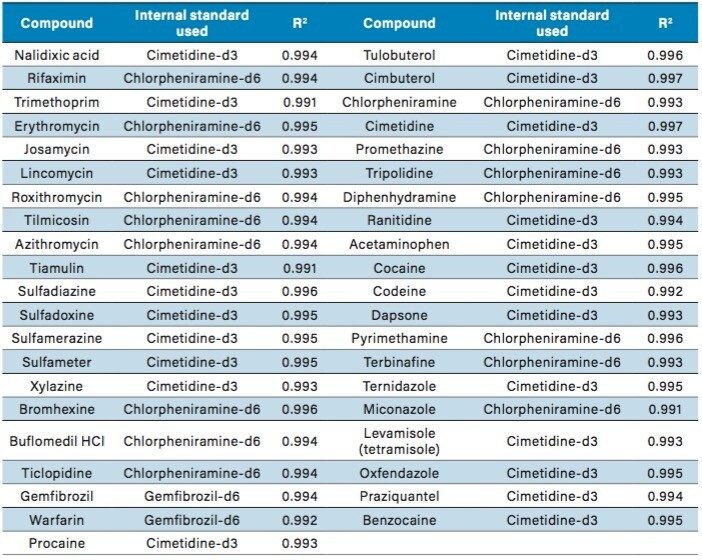
The extraction process was performed using a tandem cartridge configuration with a Waters 6-cc Oasis MAX (p/n 186000369) and a 6-cc Oasis MCX (p/n 186000256) SPE Cartridge. This configuration allows for a three-tiered extraction mechanism that uses reversed-phase, anion exchange, and cation exchange. The extraction protocol was designed to ensure retention of acidic, basic, and neutral PPCPs. The Oasis MCX Cartridge was connected below the Oasis MAX Cartridge, and both were conditioned by passing through 5 mL of methanol followed by 5 mL of water. The water samples (1 L) were loaded at 10 mL/min onto the dual stack by vacuum using a bottle-to-SPE adapter. Once the loading step was completed, the cartridge stack was disassembled and each cartridge followed specific wash and elution steps, as shown schematically in Figure 2. The Oasis MAX Cartridge was washed with 5 mL of 5% ammonium hydroxide in water. The elution was performed in two steps:first with 5 mL of methanol (neutral PPCPs), and second with 5 mL of methanol containing 5% formic acid (acidic PPCPs). Both elution fractions were collected in a 20-mL glass tube. The Oasis MCX Cartridge was washed with 5% formic acid and eluted with 5 mL methanol containing 5% ammonium hydroxide (basic PPCPs). The MCX and MAX elution fractions were pooled and evaporated to dryness at 60 °C under a gentle stream of nitrogen. The dried eluate was reconstituted with 900 μL (2 x 450 μL) 10 mM ammonium formate. The internal standard mix (100 μL) was then added to give a final concentration of 1.0 ppb. Matrix-matched calibration standards were prepared with the same protocol with the exception of the final eluate, which was reconstituted in 800 μL (2 x 400 μL) 10 mM ammonium formate, and 100 μL of the internal standard mix was added. The final 100 μL was utilized to post spike 100 μL of the PPCP mix at various concentrations in 10 mM ammonium formate. The standards for the majority of compounds were spiked at concentrations ranging from 0.1 to 5.0 ppb (0.1, 0.2, 0.25, 0.5, 1.0, 2.0, 2.5, and 5.0 ppb final concentration). This range equates to 0.1 to 5.0 ppt in the original sample. 13 compounds demonstrated higher limits of detection and were therefore analyzed from 1.0 to 50.0 ppb (equivalent to 1.0 to 50.0 ppt in the water samples). These compounds were cefalexin, cinoxacin, codeine, corticosterone, dicloxacillin, erythromycin, gemfibrozil, ibuprofen, ketoprofen, naproxen, tolfenamic acid, triamcinolone, and warfarin. The internal standard mix consisted of three isotopically labeled standards:

Cimetidine-d3-N-methyl-d3, Chlorpheniramine-d6-maleate-N,N dimethyl-d6, and Gemfibrozil-d6-2,2 dimethyl-d6 (purchased from C/D/N Isotopes Inc.).

Figure 2. Schematic of solid phase extraction protocol for PPCPs in water.

LC-MS/MS

Two MRM transitions (quantification and confirmation) for the PPCPs were selected and optimized (Table 1). These results were added to the Quanpedia Database for future use in our own and other laboratories. For this application, finding the optimum chromatographic conditions for the multi-residue analysis posed a difficult challenge due to the chemical diversity of PPCPs. The best chromatographic separation was achieved with an ACQUITY UPLC HSS T3 2.1 x 100 mm analytical column (1.8 μm). The mobile phase that showed the best chromatography for the majority of compounds consisted of methanol/water with 10 mM ammonium formate (pH 3.2). Optima LC/MS grade methanol and water were purchased from Fisher Scientific.

Table 1. MRM tuning parameters and retention times for the PPCPs.

Results and Discussion

Despite the chemical diversity of the compounds analyzed, excellent chromatographic profiles were obtained for all 82 compounds. Example chromatograms for the different classes of compounds are shown in Figure 3. Of the 82 PPCPs included in this work, 78 were found to be effectively extracted using the dual-cartridge SPE methodology. Five compounds (digoxigenin, fleroxacin, erythromycin, 6a-methylprednisolone, and tolbutamide) gave poor recoveries in the well water and surface water samples using this extraction protocol, although they were acceptable for the reagent water sample. Those compounds were therefore excluded from the quantitative analysis.

Figure 3. Example MRM chromatograms for compounds from the different classes of PPCPs represented in this work.

To ensure that the method did not result in carryover or false detections of PPCPs, blank reagent water samples were tested to find a clean water source that could be used as a blank sample and in order to create calibration standards. After screening several sources, Optima LC/MS grade water (Fisher Scientific) gave the best results. A blank sample of this reagent water was enriched using the SPE protocol. This extracted sample was analyzed and compared to post-spike samples of the same extract. From this work an estimation of the background level of the PPCPs in the reagent water could be made to determine whether it was sufficiently devoid of the target PPCPs. The results demonstrated that only four PPCPs were detected above the 100 ppq level in the reagent water sample (Table 2). Those compounds were enrofloxacin, fleroxacin, rifaximin, and diltiazem. These compounds were deemed to be present at levels between 100 ppq and 1 ppt in the reagent water. None of the compounds were found to have a response in the reagent water above 1 ppt. 46 compounds were detected below the lowest calibration point and 28 PPCPs were not detected at all in the reagent water blank.

Table 2. Results from the analysis of blank reagent water extract to determine levels of detected compounds. Any compounds that showed a response are indicated. Compounds that showed a response lower than the response of the post-spiked 0.1 ppt are labeled <0.1 ppt. Four compounds were detected above 0.1 ppt but below the 1.0 ppt level and are shown in bold text. Compounds that did not show any response in the blank reagent water extract are labeled ND (not detected). 

Figure 4 shows the MRM chromatograms (quantification transition) of four selected PPCPs that were not detected at all in the reagent water standard. The blank extracted reagent water and spiked extracted reagent water are shown together to demonstrate the response that would equate to 0.1 ppt (100 ppq) in the non-extracted sample.

Figure 4. MRM chromatograms for example compounds that demonstrate blank responses in the extracted reagent water. The chromatograms in the top row demonstrate the expected response for the example compounds at the 0.1 ppt level (post-spiked into extracted reagent water). The bottom row shows the response in the blank extract of the reagent water.

In order to assess the quantitative capabilities of the method, three selected deuterated compounds were used as internal standards. Along with the reagent water, a well water sample, and surface water sample were used to demonstrate the method performance in different water matrices. From the 78 PPCPs applicable to this extraction protocol, excellent quantification results were obtained for 58 of the compounds with this initial work employing three of the selected deuterated compounds as internal standards. Further work with additional internal standards is required for the remaining compounds. Recoveries of those 58 compounds at the 1-ppt spike level are shown in Figure 5. For the PPCPs with appropriate internal standards, the R2 value ranged from 0.991 to 0.997 (linear fit, 1/x weighting). The internal standard used and linear regression R2 value for each of the compound are described in Table 3.

Table 3. Assignment of the most appropriate internal standard for compound quantification. The resulting R2 value for the calibration curve is also reported.
Figure 5. Column chart showing calculated recovery in different water matrices for a 1 ppt spike.

To assess the matrix effects in the three water samples, the response of a standard in non-extracted reagent water was compared

to the post-spike extracted samples of the reagent water, the well water sample, and the surface water sample at the 1 ppt level,

which are shown in Figure 6. The majority of PPCPs in the reagent water showed a matrix effect of <20%. This clearly indicates the cleanliness of this water sample. For the well and surface water samples, more than half of the PPCPs showed matrix effects of >20%. The surface water samples showed significantly higher complexity, with approximately one-third of the compounds showing a >50% matrix effect, shown in the orange pie sections of Figure 6. Since the extraction protocol was optimized for maximum trapping efficiency of a wide range of compound types, both extraction cartridges were subjected only to a mild wash protocol to ensure no compound breakthrough before final elution. With this mild wash, it is expected that complex water samples will still potentially show matrix effects compared to a clean sample, such as the reagent water. In order to contend with the high complexities, additional wash steps within the SPE protocol could be employed. Further investigation into the most appropriate internal standards could also help to account for heavy matrix loads. Other work, 2 has showed similar effects for two distinct surface water samples.

Figure 6. Pie charts showing the level of the matrix effects on the different PPCPs in three different water sample types. Low matrix effect (<20%) is shown in green; medium matrix effect (20% to 50%) is shaded blue; high matrix effect (>50%) is colored orange. The percentage of compounds showing the specified matrix effect are labeled on the pie segments.

The extraction method was used to evaluate the current PPCP level in the well and surface water samples. In well water, two PPCPs tested positive above the 100 ppq level: sulfamethoxazole at 0.97 ppt and atenolol at 0.32 ppt, and 14 PPCPs were detected below this level. For the surface water sample, 17 PPCPs were detected below 100 ppq. An example of a detected compound in each of the samples is shown in Figure 7. To demonstrate a blank sample, the equivalent compound trace for the other sample is also shown with the baseline magnified to show the noise level.

Figure 7. Example compounds that were detected as incurred residues in surface water (flumethasone) and well water (atenolol). To demonstrate a blank sample, the baseline of the sample that did not show the compound detection is shown with the noise level magnified.

Conclusion

  • A method for the extraction, concentration, and quantification of diverse PPCPs including acidic, basic, and neutral compounds has been developed.
  • Using the ACQUITY UPLC H-Class System with the small, benchtop Xevo TQD, it was possible to analyze all compounds in a single injection.
  • Sensitive detection was achieved with limits of detection in the sub-parts per trillion range, and incurred residues were detected in both a surface water and a well water sample.

References

  1. http://www.epa.gov/ppcp/www.epa.gov/ppcp
  2. A L Batt, M S Kostich, J M Lazorchak. Anal Chem. (2008), 80: 5021–5030.
  3. B J Vanderford, S S Snyder. Environ Sci Technol. (2006) 40: 7312–7320.
  4. S Reverte, F Borrull, E Pocurull, R M Marce. J Chromatogr A. (2003), 1010: 225–232.
  5. J D Chahill, E Furlong, M R Burkhardt, D Kolpin, L G Anderson. J Chromatogr A. (2004), 1041: 171–180.
  6. B Kasprzyk-Horden, D R Baker. J Chromatogr A. (2011), 1218: 1620–1631.
  7. B Shao, D Chen, J Zhang, Y Wu, C Sun. J Chromatogr A. (2009), 1216: 8312–8318.

720004813, July 2017

Back To Top Back To Top