ChromScope Software
Automate your purification workflows
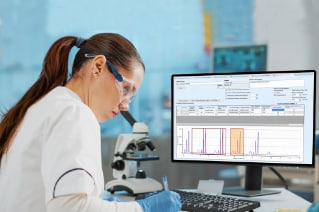
ChromScope Software, for use on Waters SFC and liquid chromatography (LC) systems, enables fully automated instrument control and facilitates the process of developing SFC and LC methods. The simple workflow-based architecture and intuitive user-friendly interface of ChromScope Software makes routine chromatography analysis, reporting, and fraction collection easy. Users are guided through a simple stepwise process of creating new sequences, including method screening, purification, and calibration curve building.
ChromScope Software can be used with systems configured for extraction, method development, or purification, and is available with the LC Prep 150 System, SFC Prep 150 Mgm System and SFC Prep 350 System.
 ChromScope Software

Overview
- Enable fully automated control of Waters SFC and LC systems
- Make routine chromatography analysis, reporting, and fraction collection easy with workflow-based architecture and intuitive user-friendly interface
- Easily create new sequences like method screening, purification, and calibration curve building with the simple wizards guide
- Optimize the collection of the same samples over multiple injections with the stacked injection wizard
- Collect fractions based on a number of criteria and determine optimal settings with the help of the graphical interface
Recommended Use: For enabling fully automated instrument control and facilitating the process of developing SFC methods and LC methods.
Features Header
Carry out operations smoothly by creating methods
Your lab will need to create methods to define how to run your instruments, process run results, and collect fractions. Method files fall into three categories:
1. Instrument methods: Instrument method files contain information that describes how to operate the devices attached to the system, such as flow, pressure, and temperature settings as well as any device specific settings, the latter being separated onto dedicated tabs in the instrument method editor.
2. Integration methods: Integration method files define the parameters that govern the integration of a chromatogram, and may be applied to any number of chromatograms in the same project.
3. Collection methods: Collection method files are used to define automated collection parameters.


Analyze data and peak calculations
With ChromScope Software, peaks can be created, deleted, and split using manual integration options. End points of the peaks can be dragged, and users can manually set the void time using the chromatogram plot’s popup menu. Manual integration automatically updates the peak calculations in the data grid and the manual peak options in tool bar or menu bar behave like toggle button, which, once enabled, keep the options active unless explicitly disabled.
With the Auto Integration option, users can choose the integration method from the current project and apply it to the data file open in active file tab. Auto integration settings can be applied to all chromatograms of the file or locally, where it is applied only to current chromatogram plot. Supported integration types are: integrate by threshold, integrate by time, integrate by first derivative, and integrate by second derivative. Supported baseline options are valley to valley or baseline drop.

Analyze sequence samples
With ChromScope Software, users can create a sequence of injections by selecting methods, setting run times, injection volumes, and various other run parameters. A sequence can be either built by using the Sequence Editor or the Sequence Wizard.
The Sequence Editor allows users to create a new sequence or modify an existing sequence and manually create/edit sequences using a table format where each run in the sequence is represented by a row in the table, and each option for a run in the sequence is represented by a column.
The Sequence Wizard, on the other hand, is used to create method screening sequences, calibration curve building sequences or purification sequences. Sequences created through Sequence Wizard populate the Sequence Editor. Users can then save and add it to the sequence queue for execution.


Report data efficiently with quick or custom reports
ChromScope Software supports both manual and automatic integration for processing chromatograms, so users can:
- Set common report layouts to process data files in batches
- Print batch reports according to the individual integration and report settings of each data file
- Easily print reports with chromatogram and data grid information to a PDF file or installed printer
- Select Quick Reports with predefined layouts or Custom Reports, which create/edit/apply a report template to a date set to define the report layout
- Build and print a calibration curve based on height or area. Supported calibration curve types are: linear, linear through origin, quadratic, and segmented
Quick and custom reporting formats are available. Quick Report contains a predefined set of fields, which cannot be altered. Custom Report contains set of components which can be altered using Report Template Editor. The report is printed according to template defined by user.
The main components of the Custom Report include:
- Header
- Plots:
- Chromatogram - Plot of detector signal recorded during the run
- PDA 3D - Plot of 3-dimensional view of absorbance, time, and wavelength
- Flow – Plot of the CO2 and co-solvent flow rates during the run
- Pressure - Plot of the front pressure and back pressure rates during the run
- PDA Single Spectrum Plot - Plot of wavelength and absorbance
- General information - General information about the data file
- Injection information - Injection parameters
- Peak information - Peak parameters
- Footer
