Ideally when running a chromatographic method, the sample diluent composition should be as close to the method starting conditions as possible. This is done in order to minimize the possibility of band spreading and peak distortion from sample solvent effects, which can lead to poor peak symmetry, peak splitting, or unusable data.
The cause for these effects is a difference in elutropic strength between the diluent and the mobile phase. Peak broadening and shape abnormalities generally get worse as the diluent becomes stronger than the mobile phase.1-2
In fact, it is widely recognized that the sample injected should ideally be dissolved in the starting mobile phase conditions. However the pre-treatment of a given sample often ends in the analytes dissolved in a solvent composition very different from that used in the mobile phase. In order to prevent solubility and poor peak shape problems, many protocols require evaporation of the sample solvent in pre-treatment and reconstitution in mobile phase. However, this added step is a time consuming process that often takes longer than the HPLC analysis.1
The practice widely recommended is to avoid stronger solvents than the mobile phase to dissolve samples and standards. The underlying assumption is that an injection solvent stronger than the mobile phase can interfere with the adsorption of the sample at the column head, especially when large injection volumes are used.2 Unfortunately, in practice this is not always possible as sample solubility often dictates the amount of organic content needed to ensure complete dissolution.
With older, higher dispersion volume LC systems, this phenomenon is less problematic due to sufficient pre-column sample/solvent/mobile phase mixing which mitigated peak problems brought about by solvent effects.
However, for modern lower dispersion UHPLC systems, high organic diluents can be problematic when injected in larger volumes and can result in poor peak symmetry or splitting.
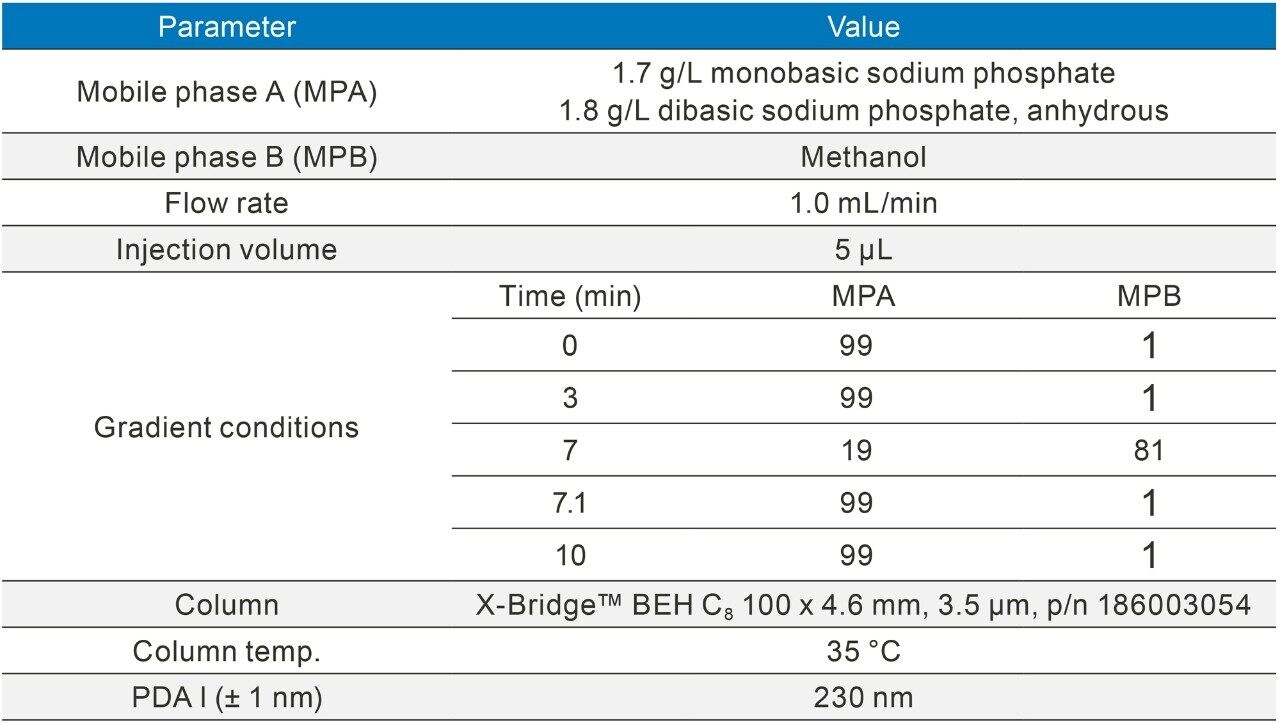
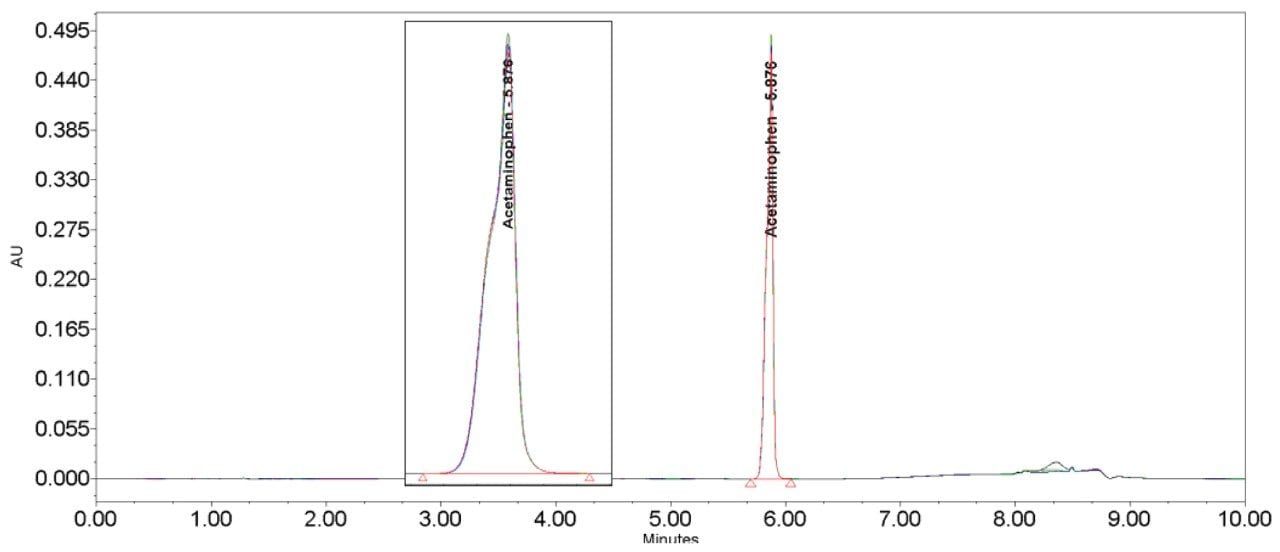
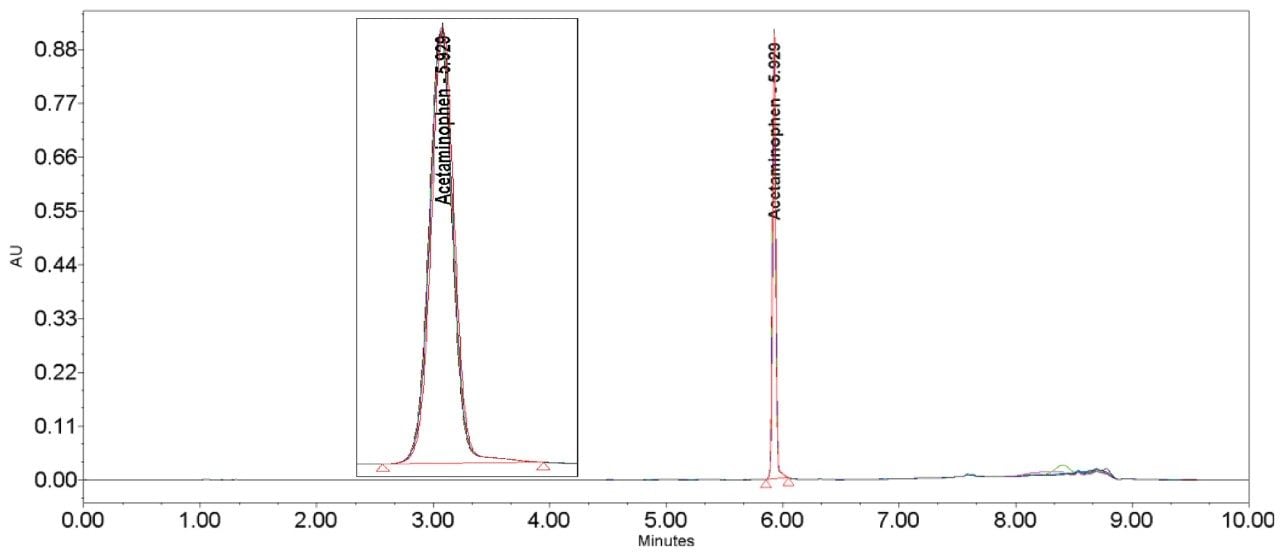
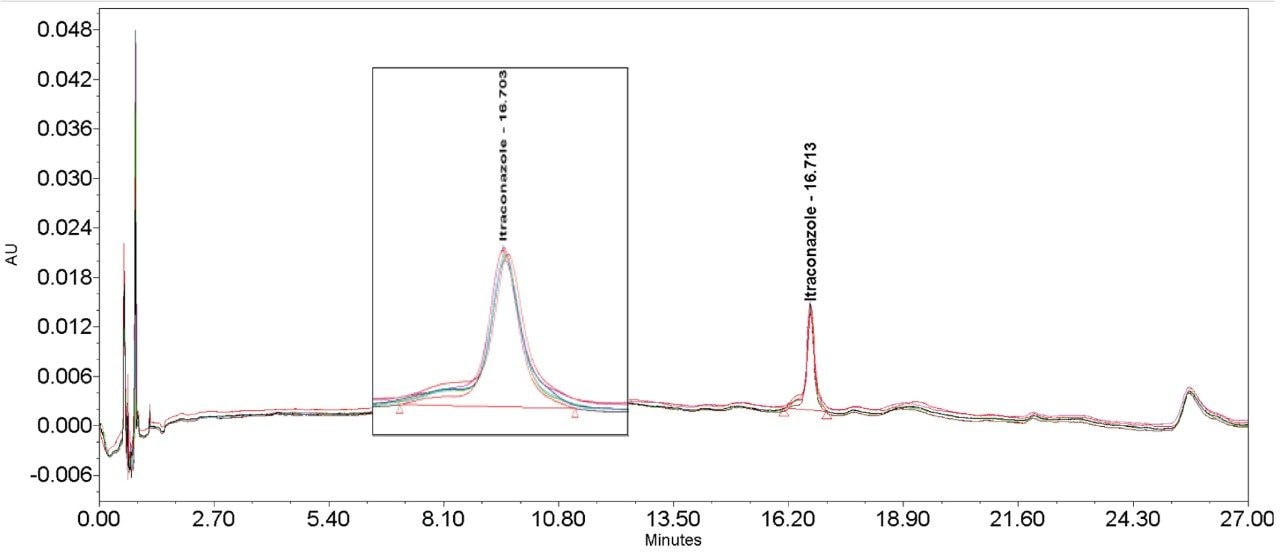
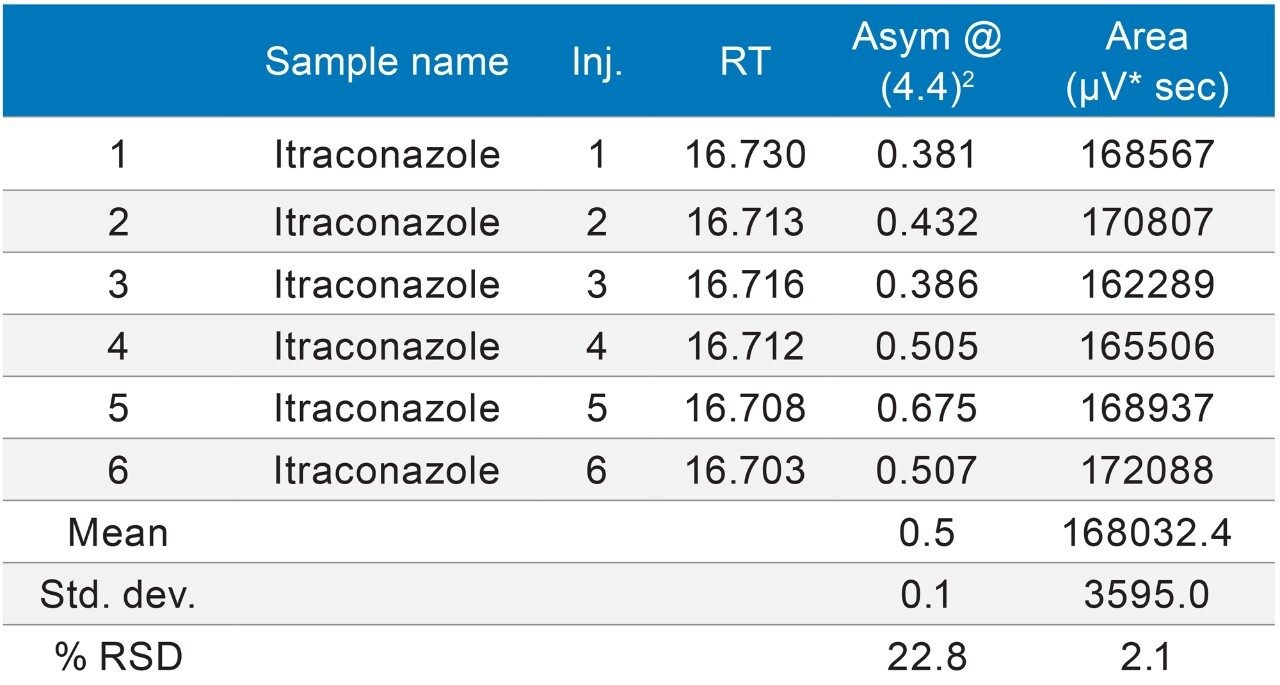
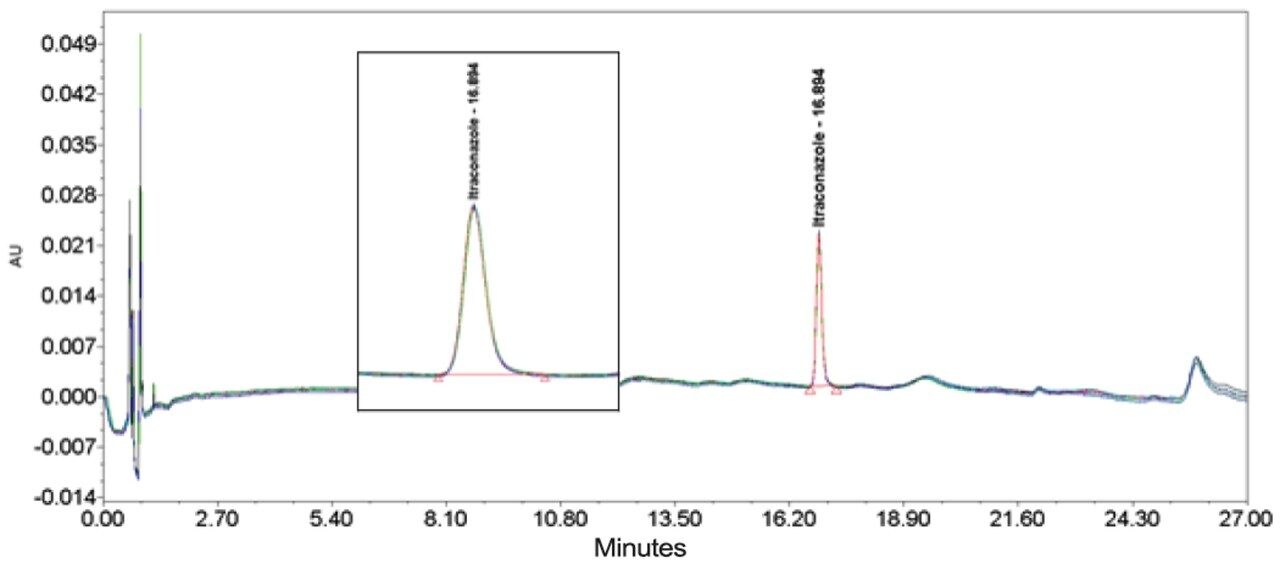
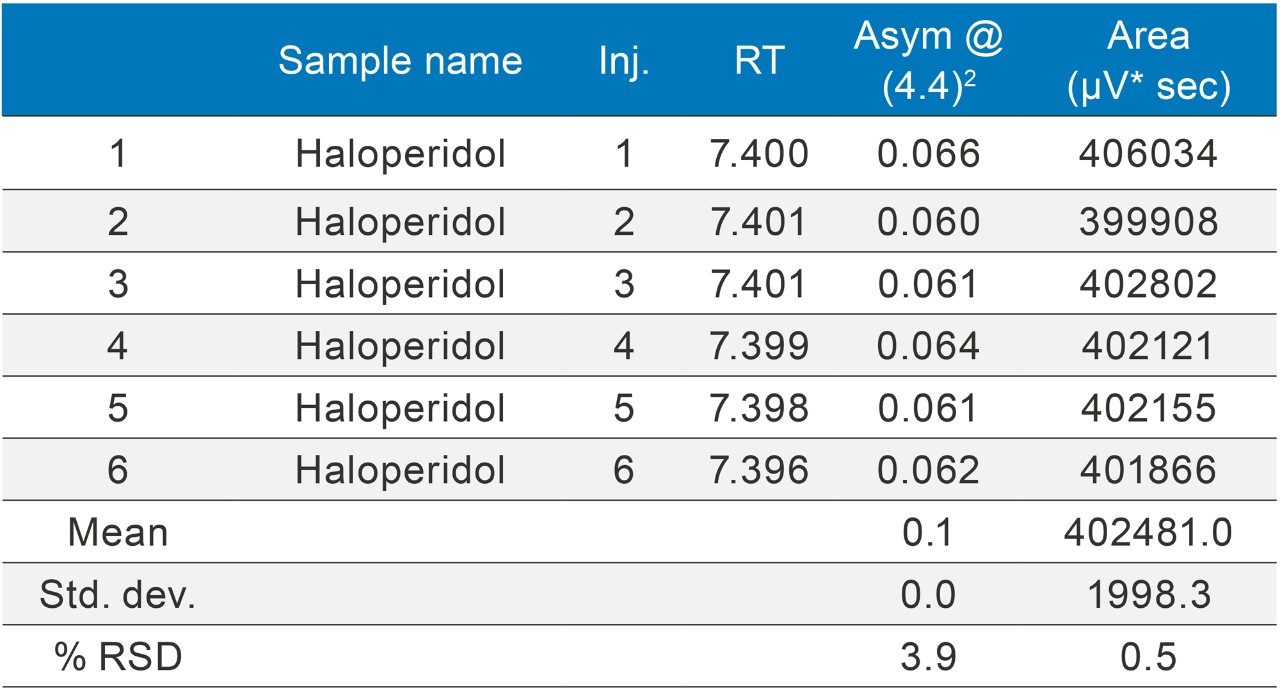
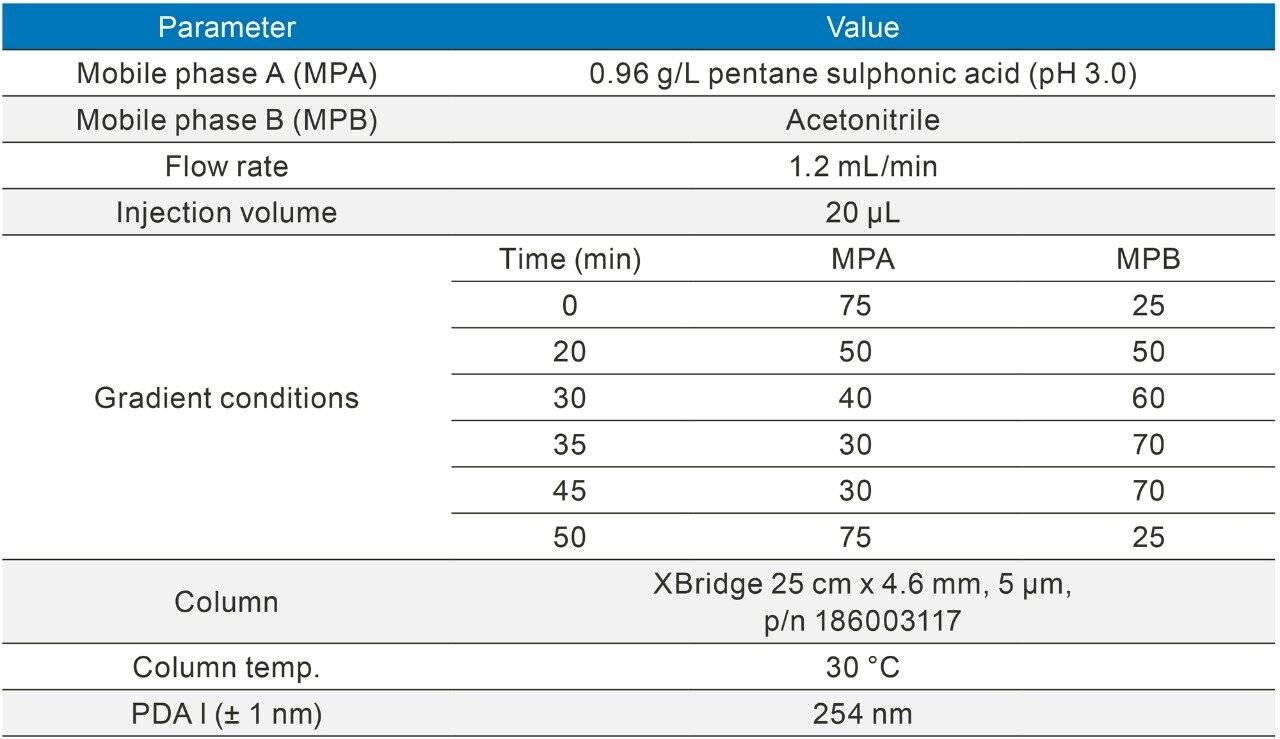
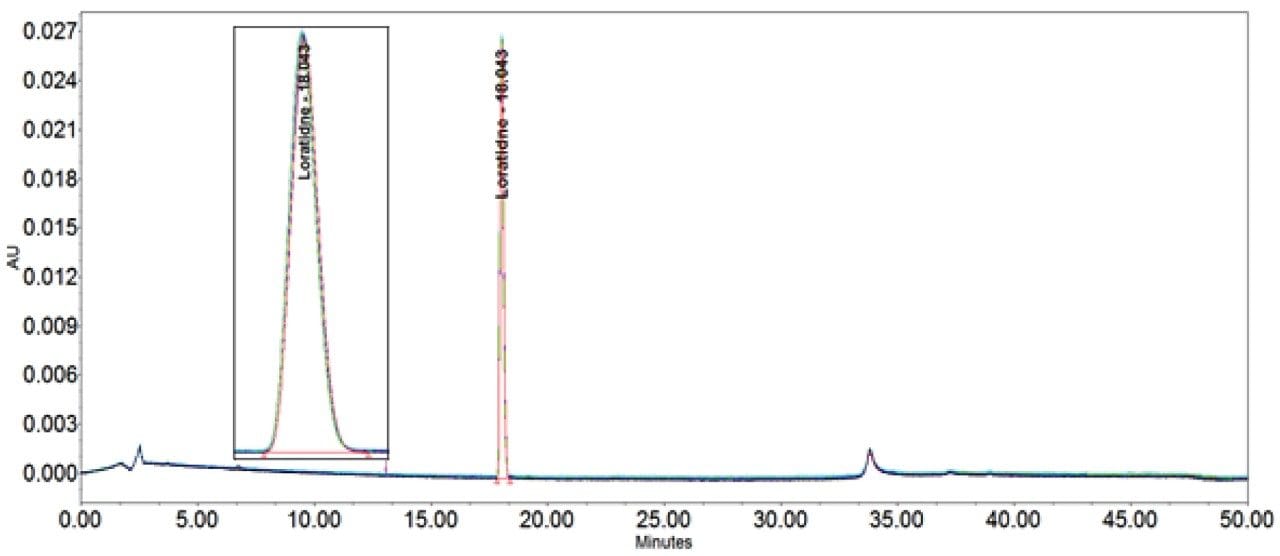
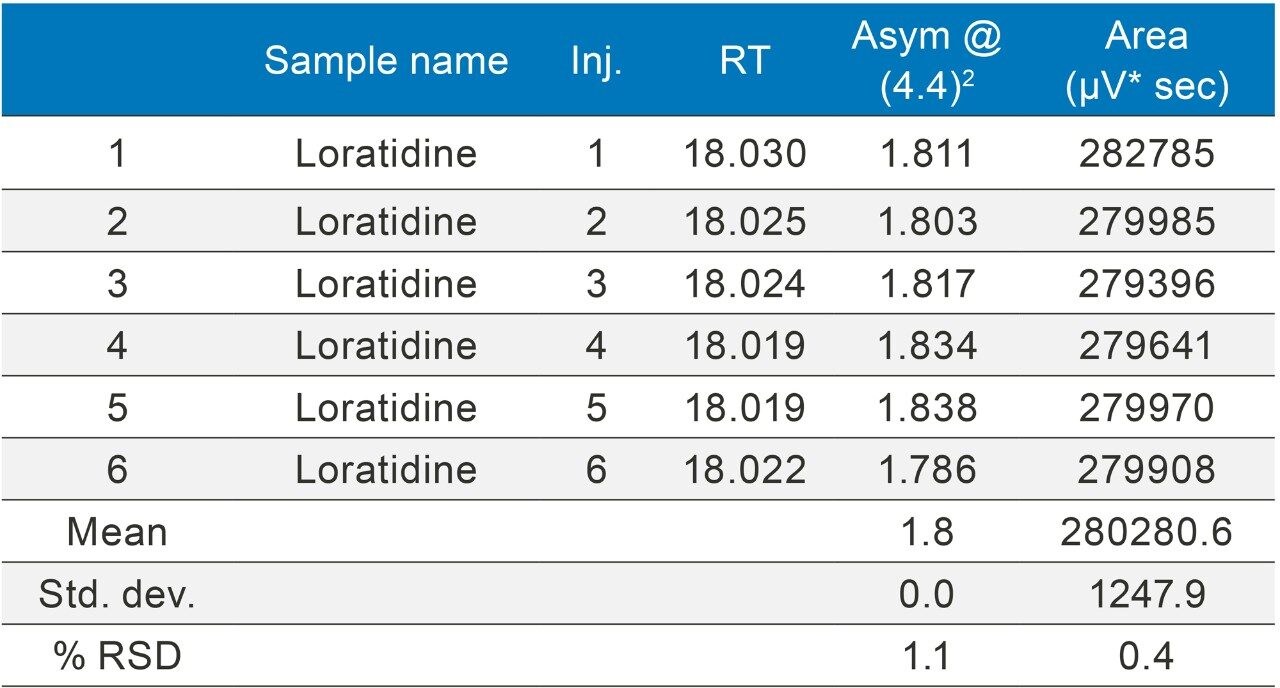
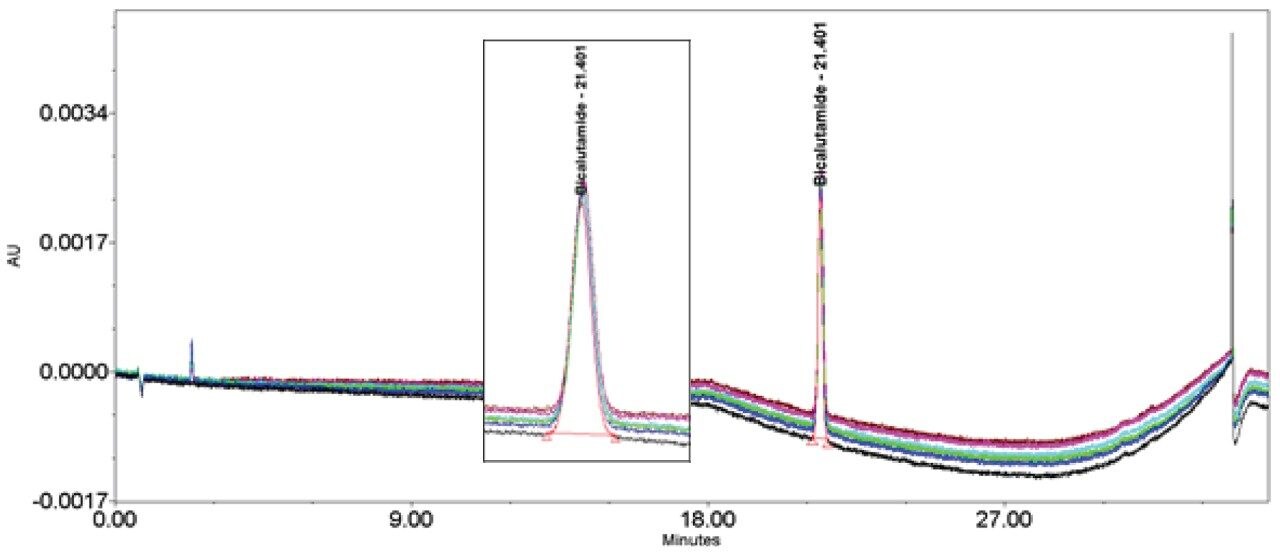
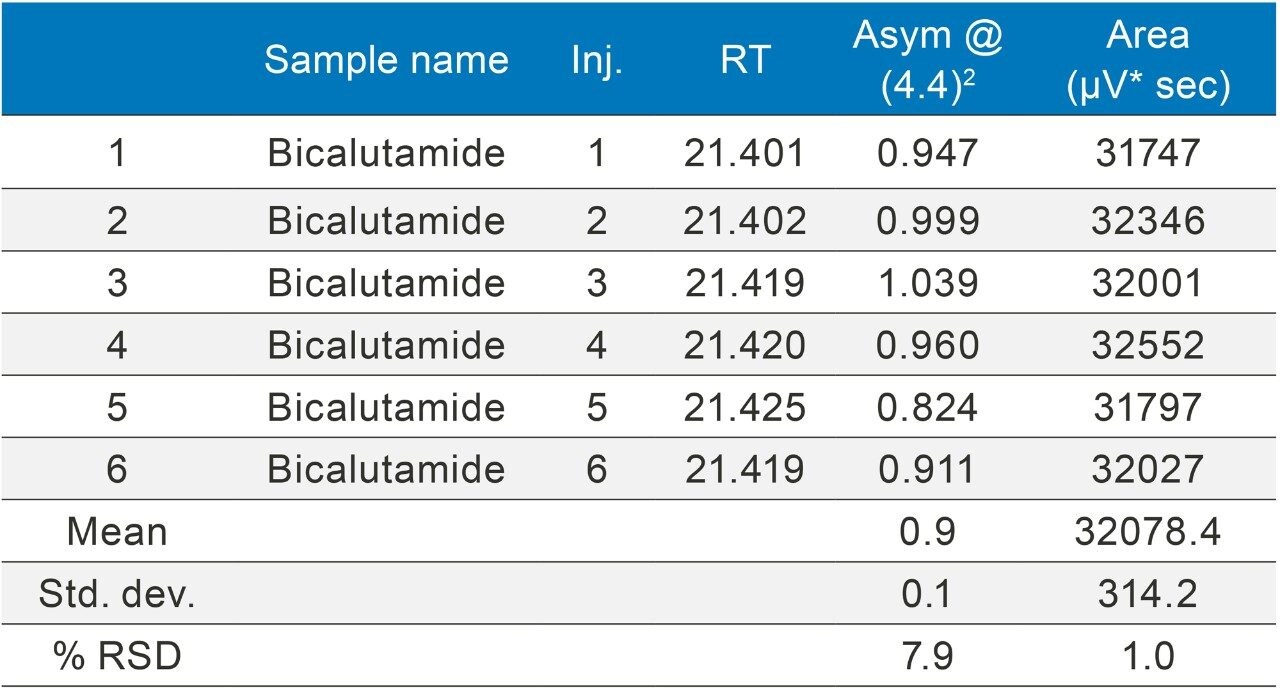
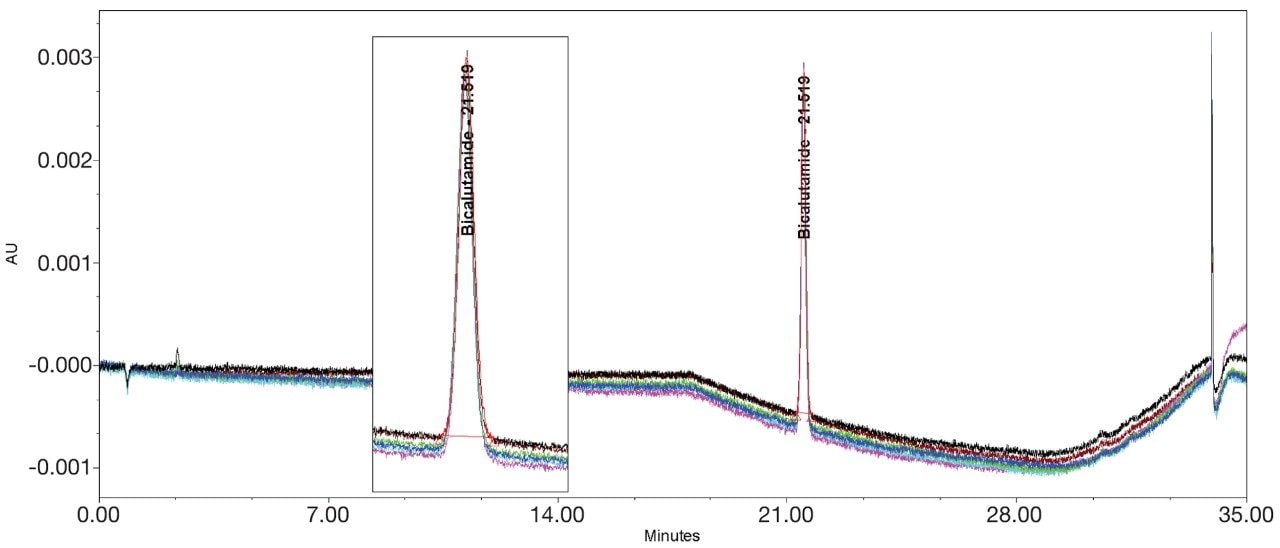
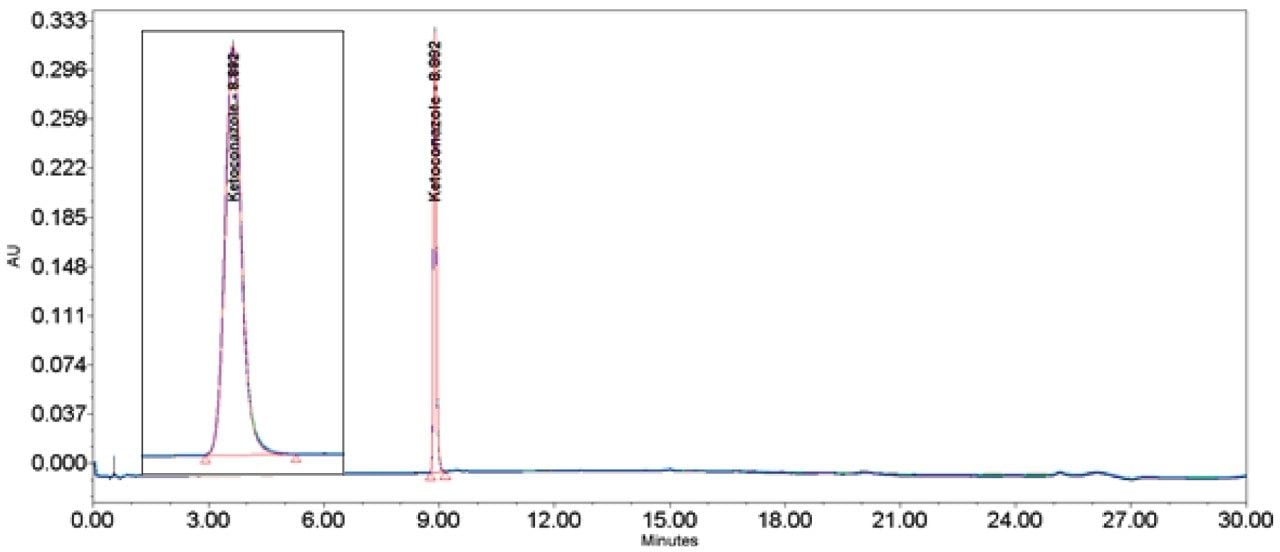
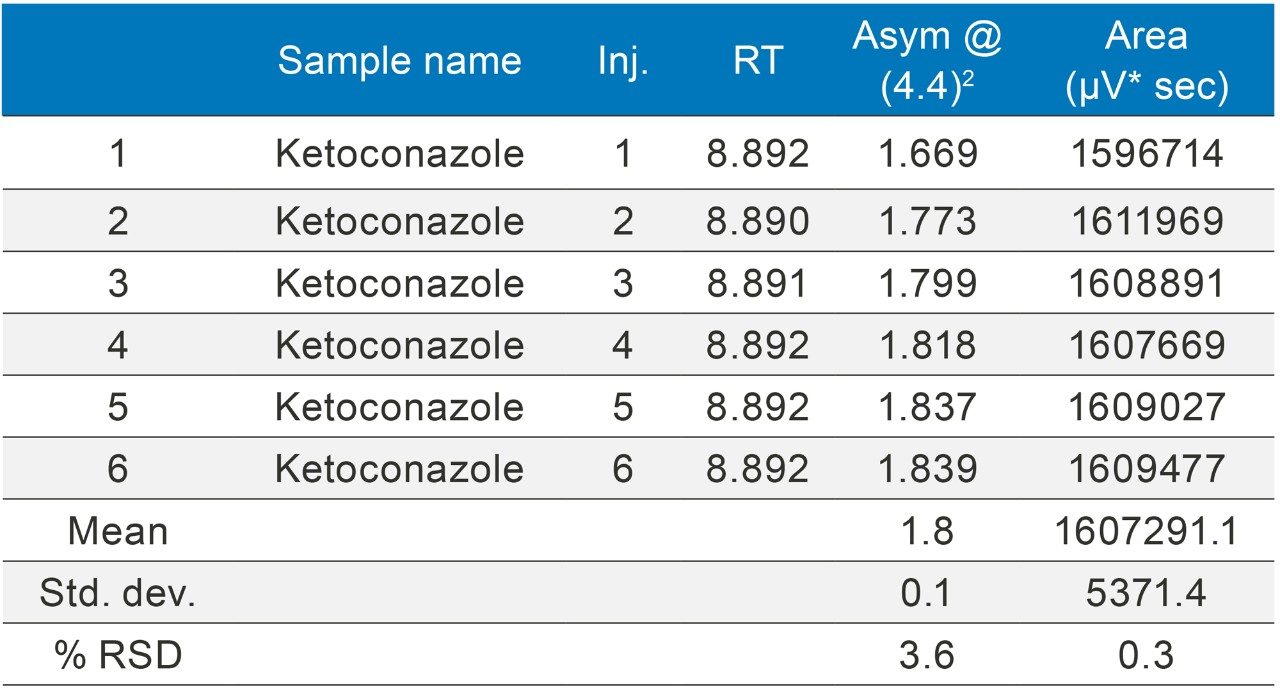
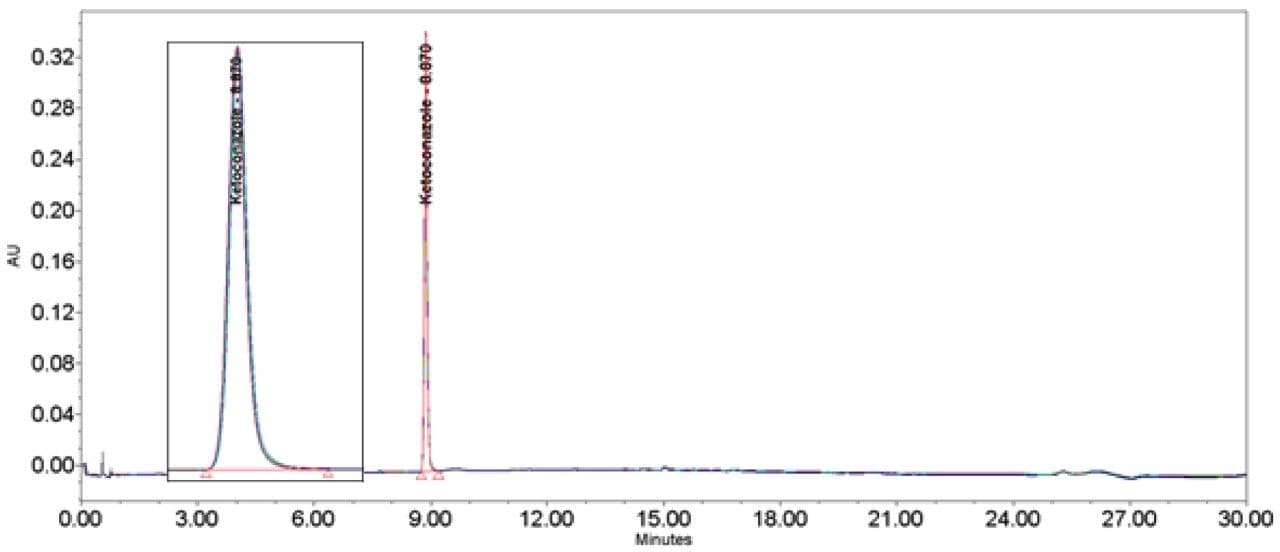
To understand this phenomenon and investigate the means for a simple solution to overcome the effect of strong solvents in the sample diluent, five United States Pharmacopeia (USP) methods were selected (i.e. acetaminophen, itraconazole, ketoconazole, loratidine, and bicalutamide) which require sample diluent organic levels ranging between 67%–100% organic.
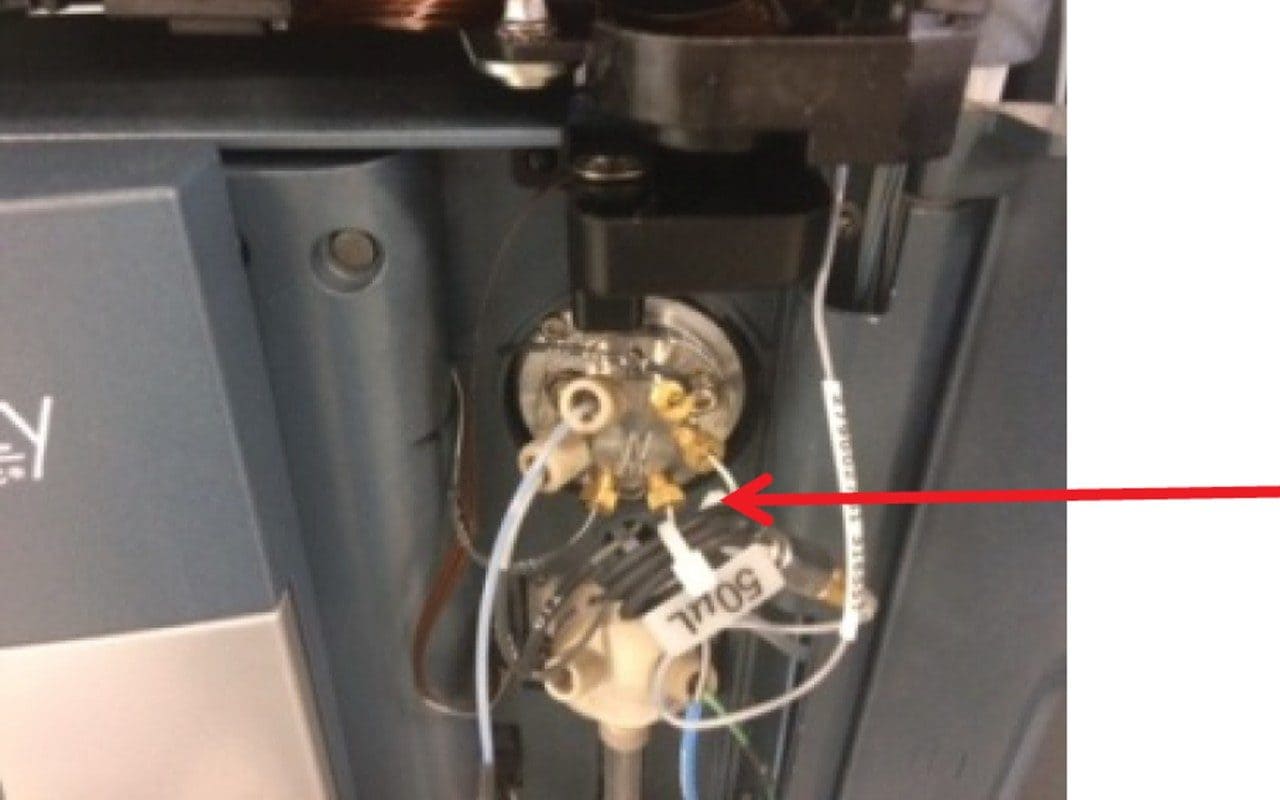
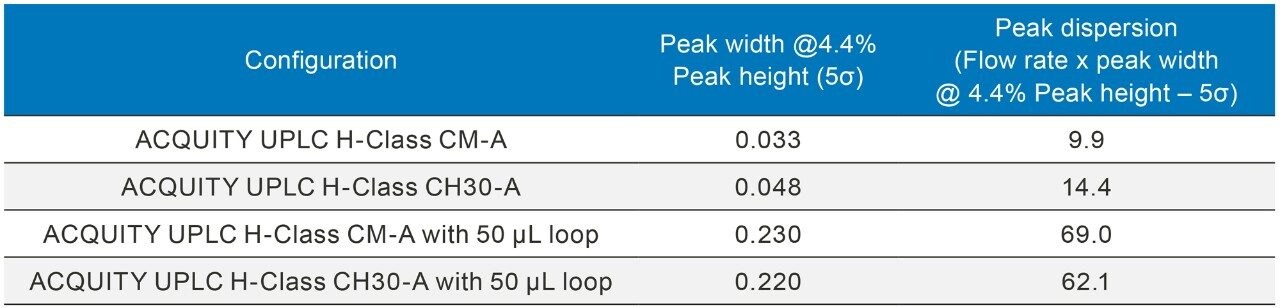
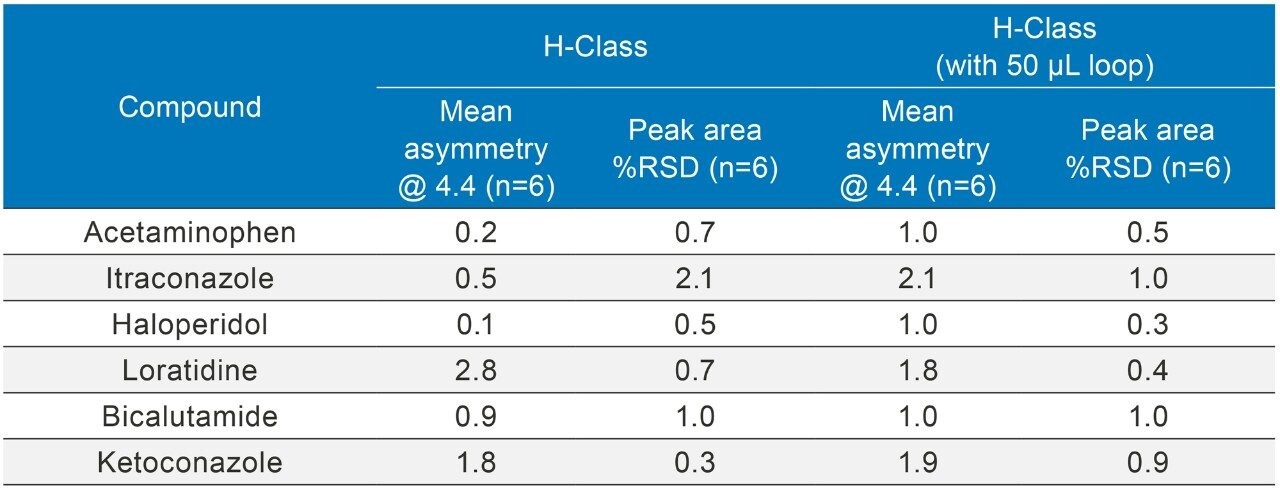
All methods were conducted on the ACQUITY UPLC H-Class System with dispersion volumes calculated for every configuration used. These were combined with structured and iterative modifications to increase pre-column volume to assess the impact of additional pre-column volume on peak symmetry problems brought on as a result of high organic diluents.