Recently a hydrophilic interaction liquid chromatography (HILIC)-based method with fluorometric detection was recognized as an Official Method of Analysis for cocoa flavanols and procyanidins with a degree of polymerization 1–7 (AOAC2020.05). This application note demonstrates a successful implementation of AOAC2020.05 on a Waters ACQUITY UPLC H-Class System coupled with the ACQUITY UPLC FLR Detector using a Waters Torus DIOL Column and Waters Oasis PRiME MCX SPE Cartridges. The benefits of thorough system equilibration and sample cleanup are highlighted. This method was successfully applied to commercial cocoa-based foodstuffs and dietary supplements with cocoa flavanol and procyanidin contents ranging from 3–500 mg/g, which demonstrated the versatility and reliability of this routine analysis method for flavanols and procyanidins in these products using Waters equipment and columns.
Cocoa flavanols and procyanidins (F/PC) are botanical bioactives that have been shown to support healthy blood flow, contributing to cardiovascular and cognition benefits.1,2 In cocoa, the flavanols are represented by a possible four monomers ((+/-)-epicatechin and (+/-)-catechin), while procyanidins are oligomers formed from these monomers (Figure 1).3 Given the structural similarities and large number of possible procyanidin structures, they are defined, separated, and measured by degree of polymerization (DP).4–6 Because oligomer structure heterogenicity increases exponentially with degree of polymerization, the development of a quantitative, robust, and reliable analytical method has been challenging for the scientific community.
AOAC International recently recognized a hydrophilic interaction chromatography (HILIC)-based UPLC-FLR method as an official method of analysis for cocoa F/PC, with degree of polymerization 1–7 (Method AOAC2020.05).7 This method improves upon a recently published method for the determination of cocoa flavanol and procyanidins by UPLC-FLR8 with comprehensive sample preparation for cocoa powder and chocolate matrices.9 Because AOAC2020.05 uses HILIC for the separation, system equilibration can be challenging when compared to reverse phase HPLC.10
In this application note, we describe the implementation of AOAC2020.05 and the impact of system equilibration and sample treatment on the reliability of generated results. This method was applied to 20 cocoa samples to demonstrate applicability to a wide range of concentrations and sample types.
Commercially available cocoa-based products, including cocoa powder, baking chocolate, dark chocolate, and cocoa-based dietary supplements (available as a beverage powder and capsules), were purchased from local stores. All samples were identified by their matrix followed by a letter that differentiates various brands/manufacturers; multiple lots of each product were used for this analytical work.
All samples were prepared according to AOAC2020.05, except for the dietary supplement capsules. Cocoa powders, dark chocolate, and baking chocolate samples were defatted with consecutive hexane washes. The defatted solid was dissolved and passed through an Oasis PRiME MCX SPE Cartridge to remove matrix impurities. The powdered supplement was suspended in a mixture of acetone, water, and acetic acid (AWA, 70:30:1), sonicated, and centrifuged. Dietary supplement capsules used in this study contained ascorbyl palmitate as an excipient, which causes a significant under-estimation of F/PC and was not removed by SPE treatment. Instead, ascorbyl palmitate was removed by solid-liquid extraction with two consecutive washes using hexane:isopropanol 100:5 (v/v).
Calibration standards were prepared as described in AOAC2020.05, with a serial dilution of NIST cocoa flavanol extract reference material RM8403.11 Briefly, 20 mg of RM8403 were weighed in a 100-mL volumetric flask and dissolved with AWA to prepare working standard 5 (WS5). WS1–4 were prepared by pipetting 2, 4, 6, and 8 mL of WS5 in 10-mL flasks and diluting with AWA.
LC Conditions |
||
---|---|---|
LC system: |
ACQUITY UPLC H-Class |
|
Detection: |
ACQUITY UPLC FLR Detector; gain 10, emission 321 nm and excitation 230 nm Note: gain must be optimized for each instrument on which AOAC2020.05 is implemented |
|
Vials/Plates: |
LCMS Certified Amber Glass 12 x 32 mm Screw Neck Vial, with Cap and Preslit PTFE/Silicone Septum, 2 mL (p/n: 600000669CV) |
|
Column(s): |
Torus DIOL, 130Å, 1.7 µm, 3.0 mm x 100 mm |
|
Column temp.: |
50 °C |
|
Sample temp.: |
5 °C |
|
Injection volume: |
2 µL |
|
Flow rate: |
1.00 mL/min |
|
Mobile phase A: |
Acetonitrile:acetic acid 98:2 (HPLC-grade) |
|
Mobile phase B: |
Methanol:water:acetic acid 95:3:2 (HPLC-grade) |
|
Data management: |
Empower 3 CDS |
Using the ACQUITY UPLC H-Class System coupled with FLR detection, cocoa F/PC with a DP up to seven were separated and analyzed in 16 minutes, as shown in Figure 2. Cocoa F/PC were chromatographically separated using a Waters Torus DIOL Column by degree of polymerization and integrated as seven independent signals, from monomer (DP1) to heptamer (DP7).
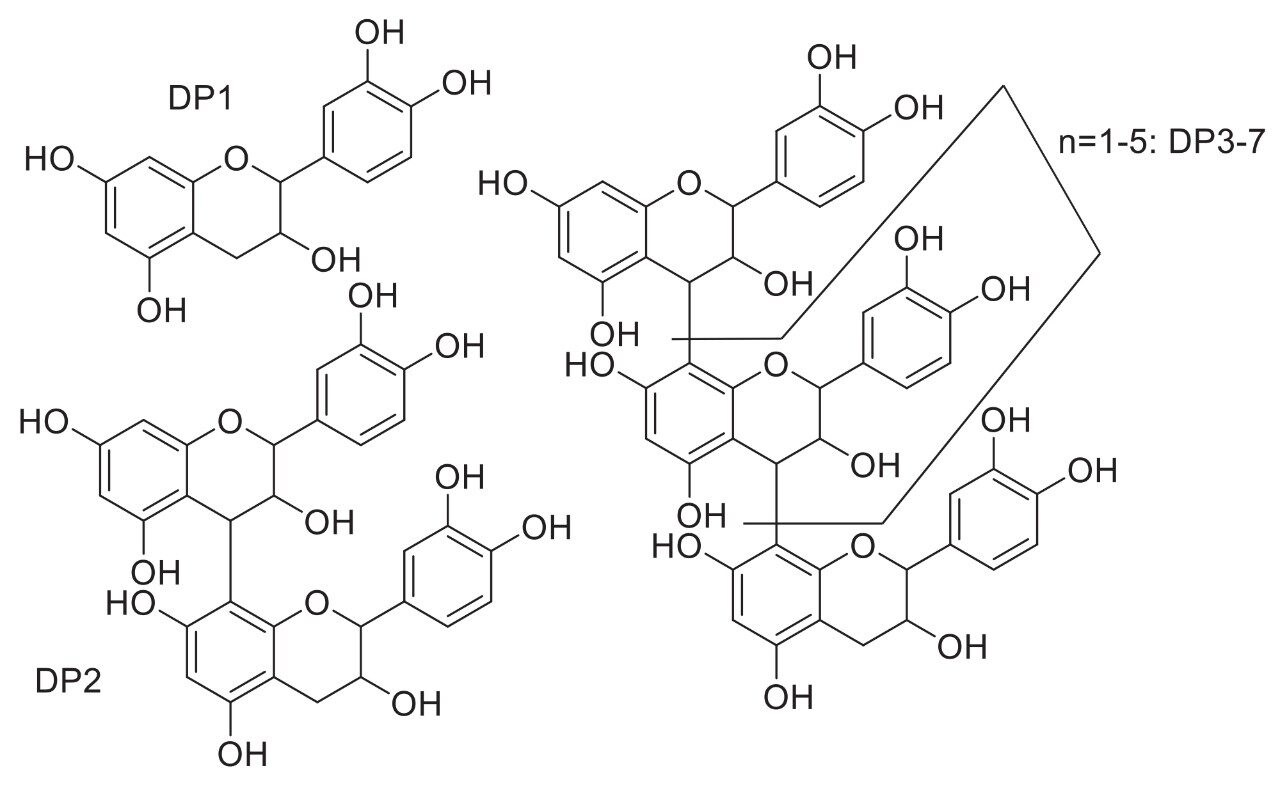
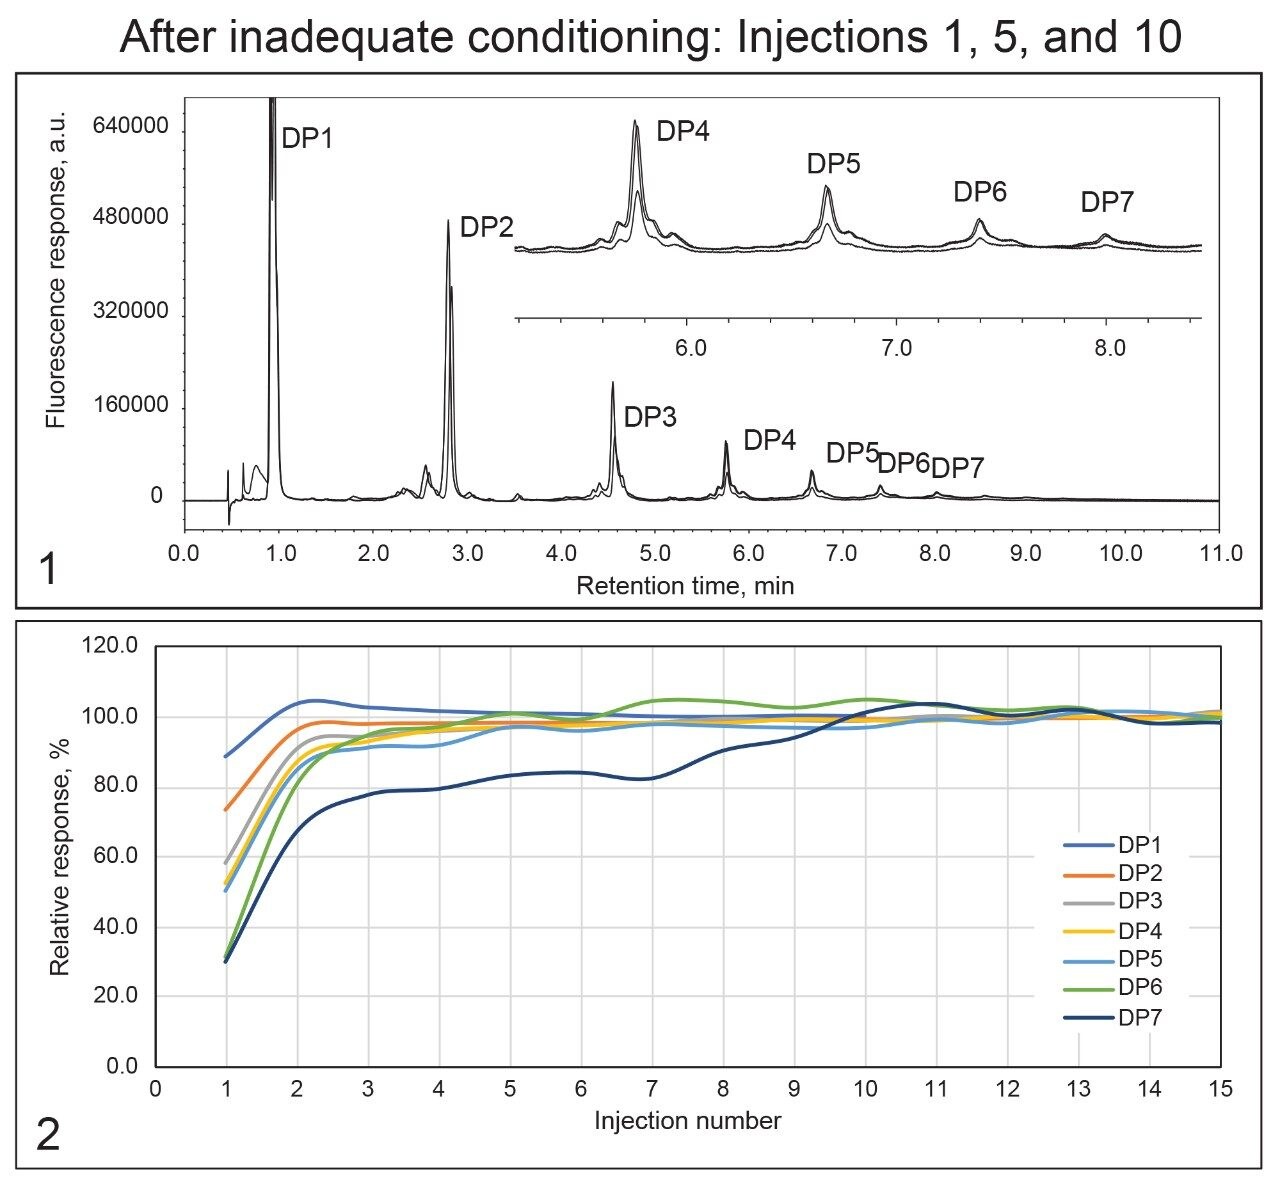
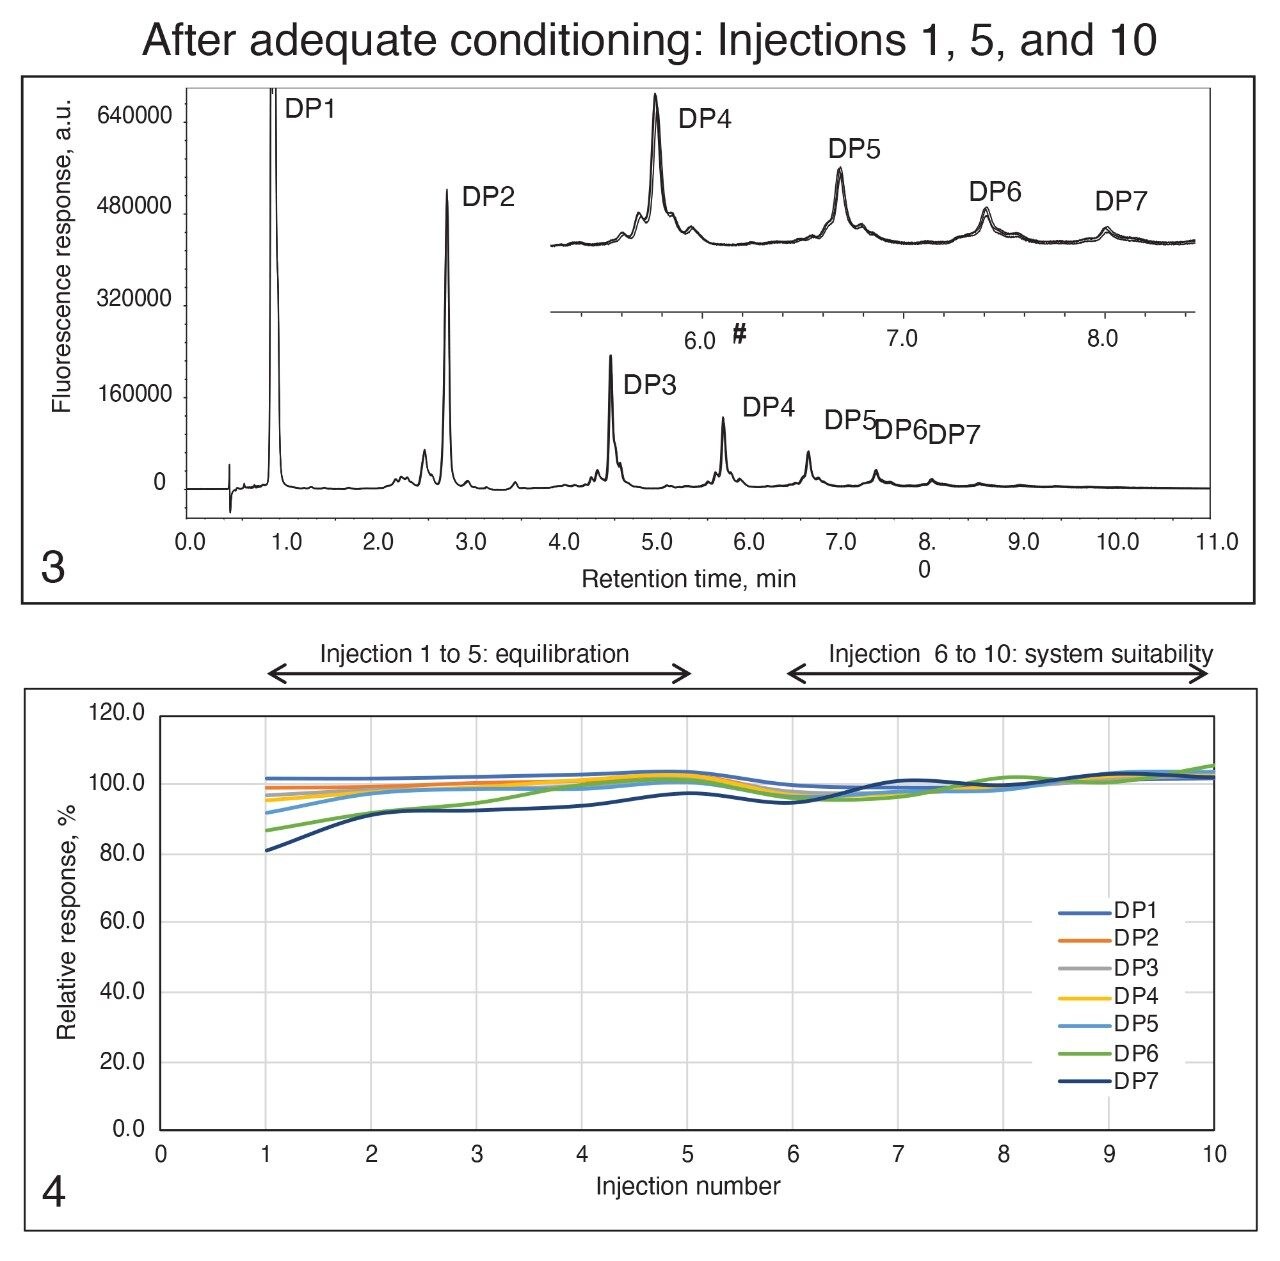
The separation of cocoa F/PC is achieved under HILIC conditions and requires the equilibration of the system prescribed by AOAC2020.05. Detector response requires equilibration (system purge, column wash, and conditioning sample injections) to reach repeatable output, although reproducible retention of neutral polar targets could be rapidly achieved under HILIC conditions.12 In this context, the thorough integration of signals is essential to achieving precise measurement. For F/PC, a multitude of stereoisomers contributed to each signal, leading to wide peak shape and the need for a valley-to-valley integration. This valley-to-valley integration could be strongly impacted by poorly equilibrated systems often showing fluctuating baseline. Figure 2 showed the relative signal area for each of the seven targeted signals with inadequate and adequate equilibration. Relative signal responses were calculated as the ratio of signal area in the injection to the average signal area of the final five injections of the sequence. In an equilibrated system, relative responses were expected to plateau around 100%.
Adequate equilibration is achieved following the protocol defined by AOAC2020.05:
Inadequate equilibration procedure, such as 1 min of solvent purge, 5 min of column equilibration, and 5 min of system equilibration followed by multiple injections of cocoa extract reference material was conducted to demonstrate the necessity of adequate equilibration.
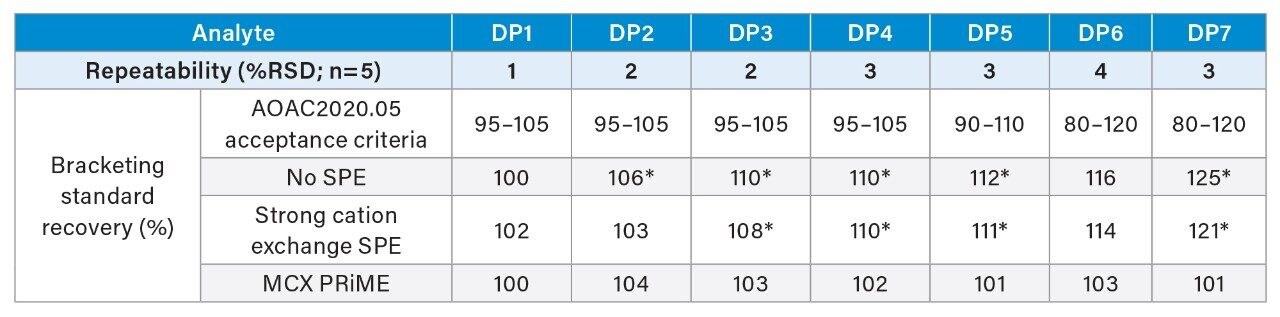
As shown by Figure 2, adequate equilibration of the system leads to precise measurement of signal area between injections, while inadequate equilibration significantly impacts the response of the target signal. In addition to significantly impacting the assessment of repeatability criteria of the system suitability, inaccurate estimation of the response during repeatability injection can challenge the reliability of the following injections. The average signal area of the last five repeatability injections is used to evaluate the response of bracketing standard injections. The evaluation of bracketed standard response was a critical requirement of system suitability as it allows for the verification that adequate system performance for sample analysis is maintained throughout the sequence.
To evaluate the impact of sample cleanup on method reliability and subsequent data quality, system performances were compared after 10 injections of baking chocolate prepared in three different ways: no SPE, strong cation exchange SPE, and mixed-mode polymeric SPE with cation exchange groups (Waters Oasis PRiME MCX). The signal area of a bracketing standards injection, following the injections (n=10) of baking chocolate was compared to the initial repeatability system suitability injection and % recoveries were calculated.
The % recoveries for each DP measured in the bracketing standard are used as a marker of the effect of injecting samples on system performances and are shown in Table 1. All procyanidin signals (DP2–7) were significantly impacted after 10 injections of the sample that did not undergo SPE treatment alongside an increase in system back pressure. Signal area was observed to be 25% higher than the expected value and associated with interferences, leading to a failure to meet system suitability and demonstrating the importance of properly removing co-eluting matrix impurities that interfere with the analysis. System performance was recovered after a wash with water:isopropanol (50:50), which allowed the elution of column contaminants, resulting in a decrease of back pressure. The system was then put through the full equilibration process. The cleanup of baking chocolate samples using the strong cation exchange SPE cartridge led to a slight improvement in recoveries. However, there was still a significant impact of samples on system back pressure (50–100 bar build up) and a clear drift in signal responses for higher order oligomers (DP3–7).
Sample treatment using Oasis PRiME MCX SPE cartridges contributed to precise and accurate determination of cocoa F/PC. As shown in Table 1, there was little deviation of % standard recovery when mixed mode SPE cleanup was implemented. Repeatability was calculated as the relative standard deviation for injection 6–10 of the system suitability. Recovery is determined relatively to the average peak area observed in injection 6–10 of the system suitability section. The adequate cleanup is associated to the sorbents capacity to retain more matrix co-extractives through the mixed mode retention mechanisms (reversed-phase and cation exchange). In addition, the mixed mode SPE also support the removal of charged lipids or excipients (such as magnesium stearate) providing a sample free from impurities that would contaminate the system, generate increased back pressures and interfere with fluorescence detection. Successful cleanup of samples was demonstrated by observing a stable system pressure and reproducible bracketing standard injections.
For certain matrices (e.g., dietary supplements formulated at higher concentration), SPE cleanup of the sample was not necessary. In fact, highly concentrated samples such as dietary supplements were less subject to matrix interferences during the analysis. Sample preparation can be optimized for a specific matrix after not only demonstrating key performances such as accuracy and precision but showing no impact on system performances beyond the sample analyzed.
Method performance has been previously demonstrated and published.9 However, limited data had been published on the application of AOAC2020.05 methodology to the determination of real samples. Twenty cocoa-based commercially available products were purchased and analyzed per AOAC2020.05. Table 2 summarizes the contents determined for cocoa flavanols (DP1) and individual oligomers (DP2–7) as well as the total cocoa F/PC for commercially available products including dark and baking chocolates, cocoa powders, ready-to-mix dietary supplement powder, and dietary supplement capsules (alphabetical suffixes indicate different brands, numerical suffixes indicate different lots). Samples were determined to contain total cocoa flavanol and procyanidin contents ranging from 2.9 to 524 mg/g, demonstrating that a wide range of cocoa-based products can be characterized using AOAC2020.05. In addition, identical products (same brand and products, different lot number) showed comparable results. This suggests that the high precision achieved on the measurement of cocoa F/PC can support the discrimination of samples by matrix type and manufacturing origins as previously reported.8
The Official Method of Analysis AOAC2020.05 was implemented for the analysis of cocoa flavanols and procyanidins with degree of polymerization of up to seven in cocoa-based matrices. The impact of method equilibration was estimated using the required method system suitability criteria. The equilibration steps outlined in this application note, while lengthy, have been shown to be critical for method performance and should be implemented with each batch of sample analysis. When equilibrating the system as prescribed in AOAC2020.05, precise and consistent results are achieved and demonstrated through system suitability.
System suitability was used to monitor system performances and estimate the bias introduced by inadequate sample preparation using the example of baking chocolate. In addition to increasing system back pressure, the contamination of the system with matrix impurities led to an overestimation of procyanidin content by up to 25%. These interferences were remediated through sample processing using mixed mode cation exchange and charged lipid removal solid phase extraction.
Finally, the method was successfully applied to the determination of commercial cocoa-based foodstuffs and dietary supplements with cocoa flavanol and procyanidin contents ranging from 3 to 500 mg/g. These results together with system suitability experiments demonstrated the versatility of the AOAC2020.05 methodology and its reliability for the routine analysis of flavanols and procyanidins in cocoa-based foodstuffs and supplements.
Ugo Bussy (Mars, Incoporated), Jinchuan Yang (Waters Corporation), Hong You (Eurofins US Food and Nutritional Supplements), Nicholas Anderson (Mars, Incorporated), Emily R Britton (Waters Corporation), and Catherine Kwik-Uribe (Mars, Incorporated).
720007121, January 2021