• Application Note

LipidQuan: HILIC-Based LC-MS/MS High-Throughput Targeted Phospholipids Screen (PE, LPE, PG, and PI)

LipidQuan: HILIC-Based LC-MS/MS High-Throughput Targeted Phospholipids Screen (PE, LPE, PG, and PI)

  • Nyasha Munjoma
  • Giorgis Isaac
  • Lee A. Gethings
  • Robert S. Plumb
  • Waters Corporation

For research use only. Not for use in diagnostic procedures.

Abstract

This application note describes the use of the LipidQuan platform that utilizes a HILIC-based approach to perform a targeted screen for Lysophosphatidylethanolamine, Phosphatidylethanolamine, Phosphatidygylycerol, and Phosphatidylinositol lipids in plasma.

A rapid, specific LC-MS/MS method was developed for the analysis of LPE, PE, PG, and PI lipids in human plasma employing a HILIC-based chromatographic separation and MRM MS detection. PEs, PG, and PI were analyzed in negative ion mode while LPE lipids were analyzed in positive ion mode. The HILIC methodology facilitated the elution of lipids in discrete classes with the PGs eluting first (~1.21 mins) followed by PEs (~1.62 mins), LPEs (~2.34 mins), and PIs (~2.40 mins). Using the method, 11 LPEs, 47 PEs, 21 PGs, and 33 PIs were quantitatively identified in eight minutes with a linear dynamic range over four orders of magnitude. The method sensitivity easily facilitated the detection of these lipids in human plasma at normal circulating levels from a 50 μL aliquot of plasma.

Benefits

  • Rapid quantification of 112 phospholipids (47 PEs, 11 LPEs, 21 PGs, and 33 PIs) in plasma
  • Improve identification and specificity of phospholipids (PE, PG, and PI) using MRM transitions from the two fatty acyl chain fragments
  • A robust and easy to deploy platform reducing method development and training costs, using Quanpedia and SOPs
  • Fast data processing and visualization using TargetLynx Software and third party informatics (i.e. Skyline) for maximum flexibility

Introduction

Glycerolphospholipids (GPLs) generally consist of two fatty acyl chains and a phosphate head group esterified to a glycerol backbone (Figure 1), with the head group defining the GPL. Lysophopholipids are derivatives of phospholipids where one or both of the fatty acyl chains have been removed.

Figure 1. Structural representation of PE, PG, and PI. The glycerol backbone is esterified in stereochemical number-3 (sn-3) position with a phosphate residue; the R1 and R2 represent different fatty acid chains at the sn-1 and sn-2 position.

Biologically, GPLs are essential components of all biological membranes that act as a protective barrier with selective permeability characteristics to enable cellular metabolism. In recent years, research interest in measuring these lipid species has increased since they are known to be involved in numerous diseases. Phosphatidylethanine (PE) is the second most abundant gycerolphospholipid phospholipid (after phosphatidylcholines) and comprises between 15–25% of the total GLP content in mammalian cells.1 Disturbances in PE metabolism have been implicated in both chronic (Alzheimer’s and Parkinson’s) and infectious (Candidiasis) diseases.1 Only a small component of phosphatidylglycerols (PG) is observed in eukaryotic mitochondrial membranes.2 However, PG is the biosynthetic precursor of cardiolipin which represents a major constituent of mitochondria membrane and is crucial in maintaining the potential of these membranes. Phosphatidylinositol (PI) plays a small role in membrane structure but plays a major role in membrane-bound signalling processes and vesicular activity.2

Although advances in mass spectrometry (MS) have allowed for more in depth lipidomic analysis, unambiguous identification and quantification has proven difficult as lipids have a high number of isomeric and isobaric lipid species. MS spectra often contain multiple peaks and fragments from various compounds making confident identification and relative quantitation of specific molecular species difficult or challenging. As a result, lipidomic data generated during multi-site studies may not be commutative and resulting biological interpretation of the data questionable. 

A hydrophilic interaction chromatography (HILIC) based approach for the separation of lipids by class prior to MS analysis is a proven method of reducing identification ambiguity.3 Separating lipid species by class also results in fewer stable isotope labelled (SIL) standards being required for quantification, yielding a saving cost. This application note describes the use of the LipidQuan platform (Figure 2) that utilizes a HILIC-based approach to perform a targeted screen  for LPEs, PEs, PGs, and PIs.

Figure 2. Generic lipidomics workflow used in most research laboratories, with the LipidQuan workflow highlighted.

Experimental

Samples

Pooled healthy human plasma was spiked with stable isotope labels (SIL) standards, (SPLASH LIPIDOMIX, Avanti Lipids, Alabaster, AL) at nine concentration levels to generate calibration curves for quantification (LPE (18:1) (d7) = 0.5–250 ng/mL, PE (15:0–18:1) (d7) = 0.5–250 ng/mL, PG (15:0–18:1) (d7) =3.0–1500 ng/mL, and PI (15:0–18:1) (d7) = 1.0–500 ng/mL). 

Six replicates of the NIST Standard Reference Material 1950 plasma (Sigma Aldrich, Poole, UK) were also spiked with 5% SIL, prior to extraction.

Sample preparation

A simple sample preparation procedure was adopted using protein precipitation with pre-cooled isopropanol (IPA) (1:5, plasma:IPA). Samples were vortex mixed for one minute and placed at -20 °C for 10 minutes. Samples were vortex mixed again for one minute  and placed at 4 °C for two hours to ensure complete protein precipitation. The extracted samples were centrifuged at a maximum  of 10,300 g for 10 minutes at 4 °C before transferring the supernatant to glass vials for LC-MS/MS analysis.

LC Conditions

LC system:

ACQUITY UPLC I-Class System Fixed Loop (FL) or Flow Through Needle (FTN)

Column(s):

ACQUITY UPLC BEH Amide 2.1 × 100 mm, 1.7 µm

Column temp.:

45 °C

Flow rate:

0.6 mL/min

Mobile phase A:

95:5 Acetonitrile/water + 10 mM ammonium acetate

Mobile phase B:

50:50 Acetonitrile/water + 10 mM Ammonium acetate

Gradient:

0.1% to 20.0% B for 2 minutes, then 20% to 80% B for 3 minutes followed by 3 minutes re-equilibration

Run time:

8 minutes

Injection volume:

2 µL (negative mode)

1 µL (positive mode)

MS Conditions

MS systems:

Xevo TQ-XS, TQ-S, or Xevo TQ-S micro

Ionization mode:

ESI (+/-)

Capillary voltage:

2.8 kV (+)/1.9 kV (-)

Acquisition mode:

MRM

Source temp.:

120 °C

Desolvation temp.:

500 °C

Cone gas flow:

150 L/hr

Desolvation flow:

1000 L/hr

Nebulizer gas:

7 bar

Ion guide offset 1:

3 V

Ion guide offset 2:

0.3 V

Informatics

A LipidQuan Quanpedia method file (version 1.4) that contains the LC conditions, MS method, and associated TargetLynx Software processing method (including retention times) was generated. The resulting data were processed with either TargetLynx or Skyline (MacCoss Lab Software, University of Washington). 

Results and Discussion

A rapid, specific LC-MS/MS method was developed for the analysis of LPE, PE, PG, and PI lipids in human plasma employing a HILIC-based chromatographic separation and MRM MS detection. PEs, PG, and PI were analyzed in negative ion mode while LPE lipids were analyzed in positive ion mode. The HILIC methodology facilitated the elution of lipids in discrete classes with the PGs eluting first (~1.21 mins) followed by PEs (~1.62 mins), LPEs (~2.34 mins), and PIs (~2.40 mins) (Figure 3 and 4). Using the method, 11 LPEs, 47 PEs, 21 PGs, and 33 PIs were quantitatively identified in eight minutes with a linear dynamic range over four orders of magnitude. The method sensitivity easily facilitated the detection of these lipids in human plasma at normal circulating levels from a 50 µL aliquot of plasma. 

Figure 3. Chromatogram representing HILIC separation of PG, PE, and PI from the SPLASH LIPIDOMIX standard mixture in negative ion mode (A). LPEs are measured in positive mode (B).
Figure 4. Implementation of HILIC chromatography showing the class separation of endogenous LPE and corresponding SIL used for quantification. 

The development of a LipidQuan Quanpedia method file allows for the simple download and importing of MRM transitions and chromatographic conditions for the LPEs, PEs, PGs, and PIs and eliminates manual input of LC-MS/MS methods reducing possible transcription errors.

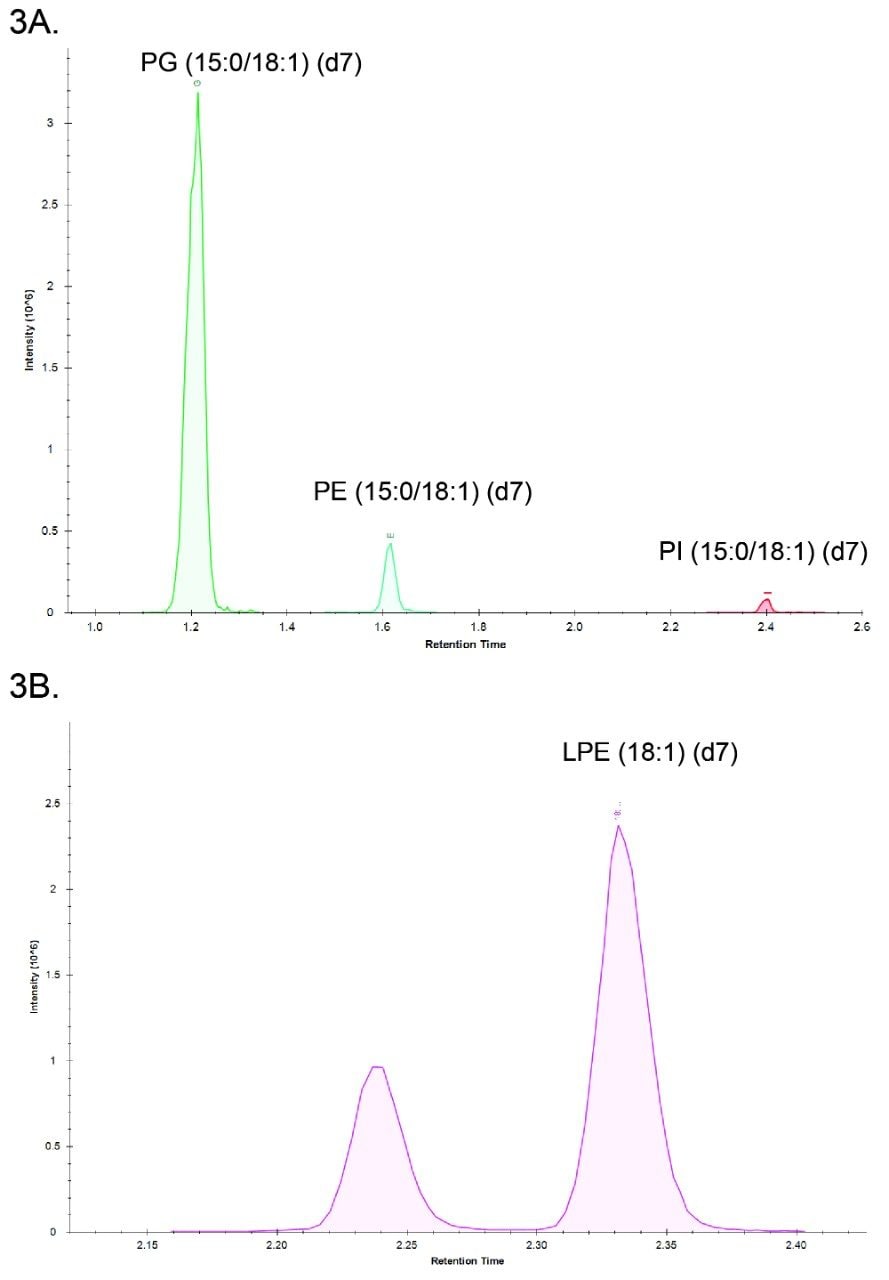
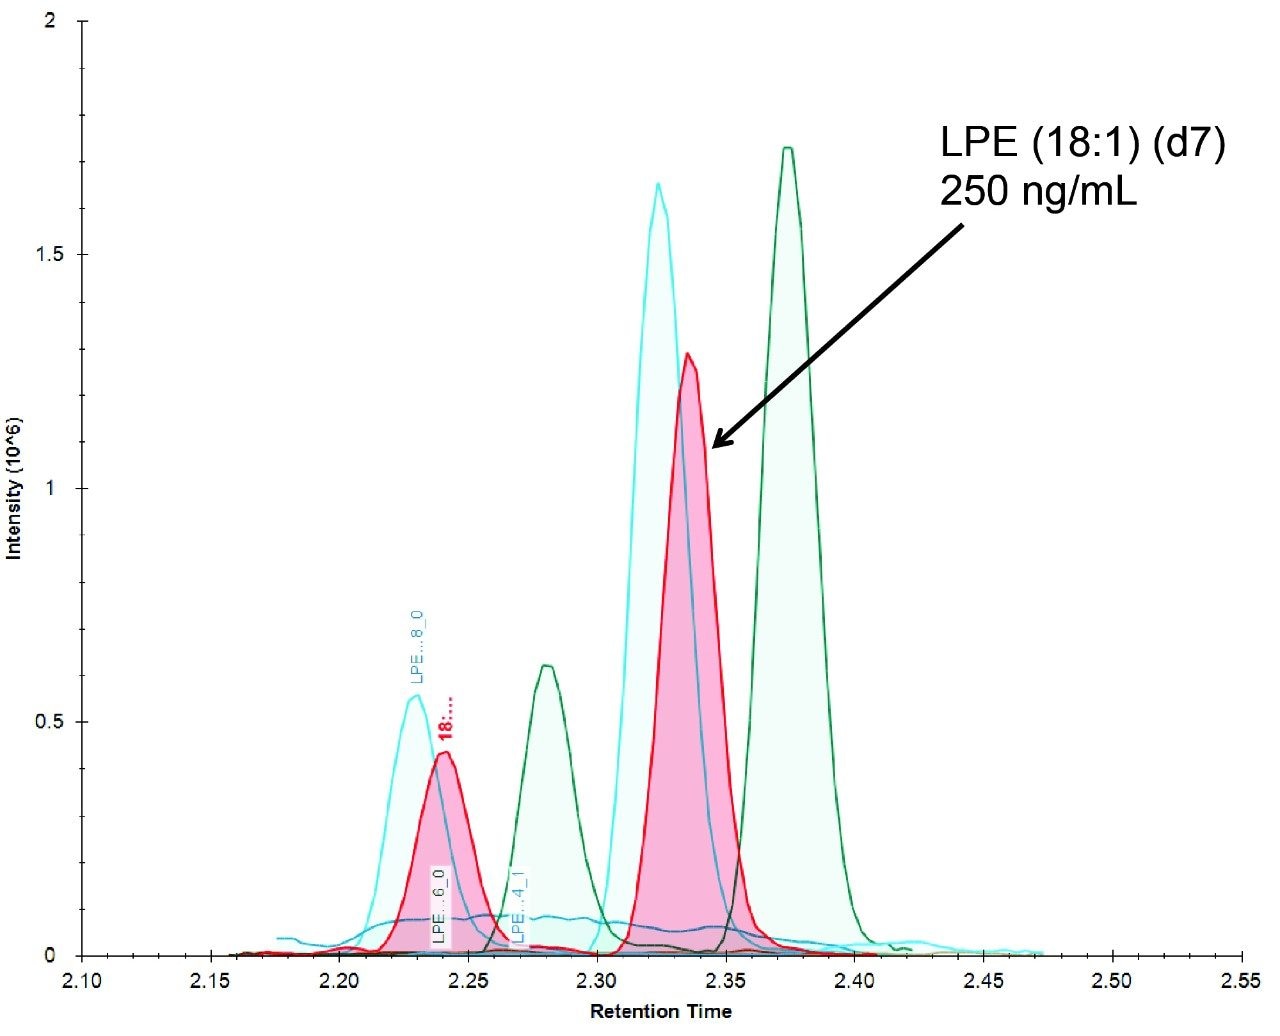
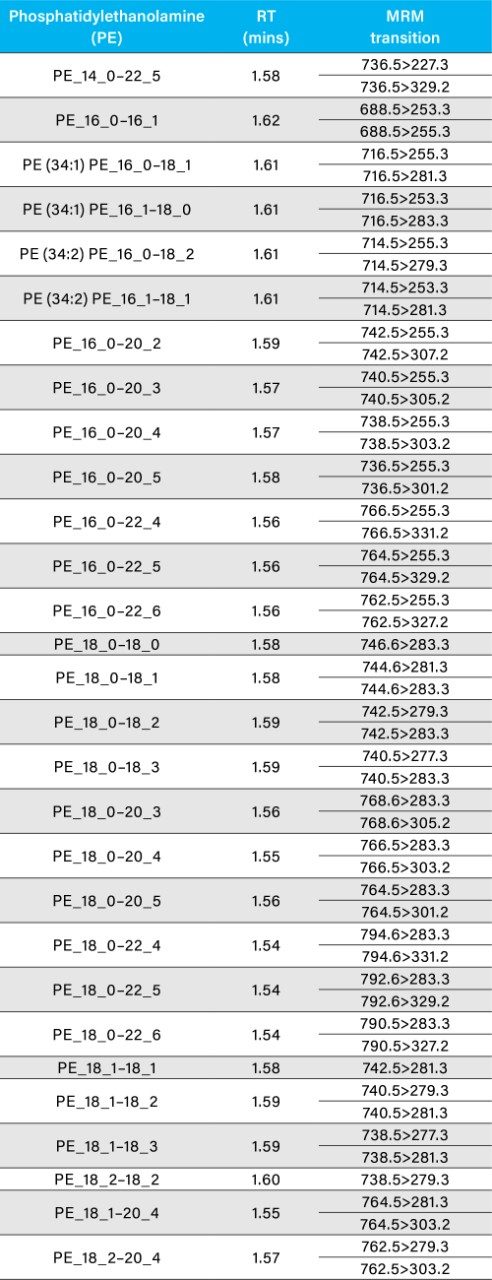
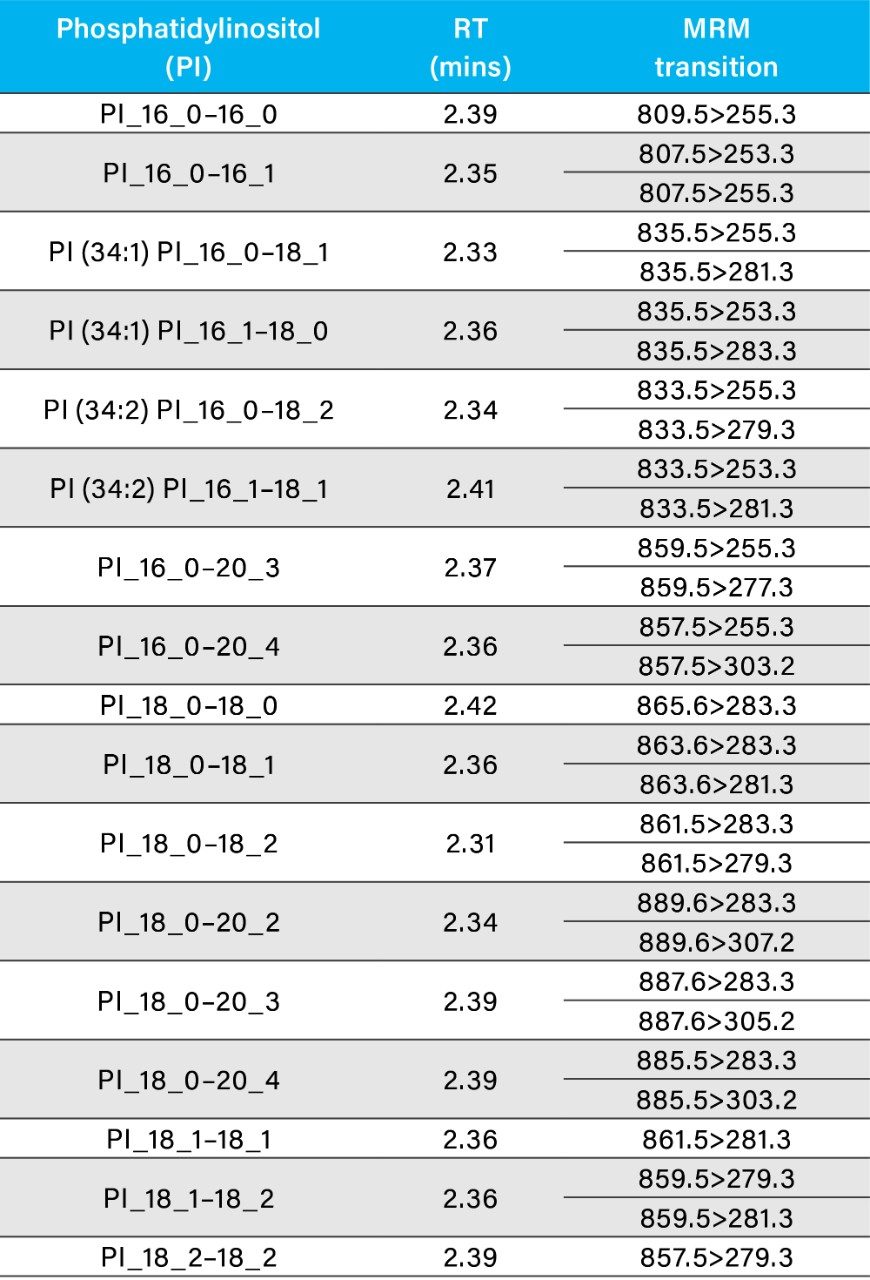
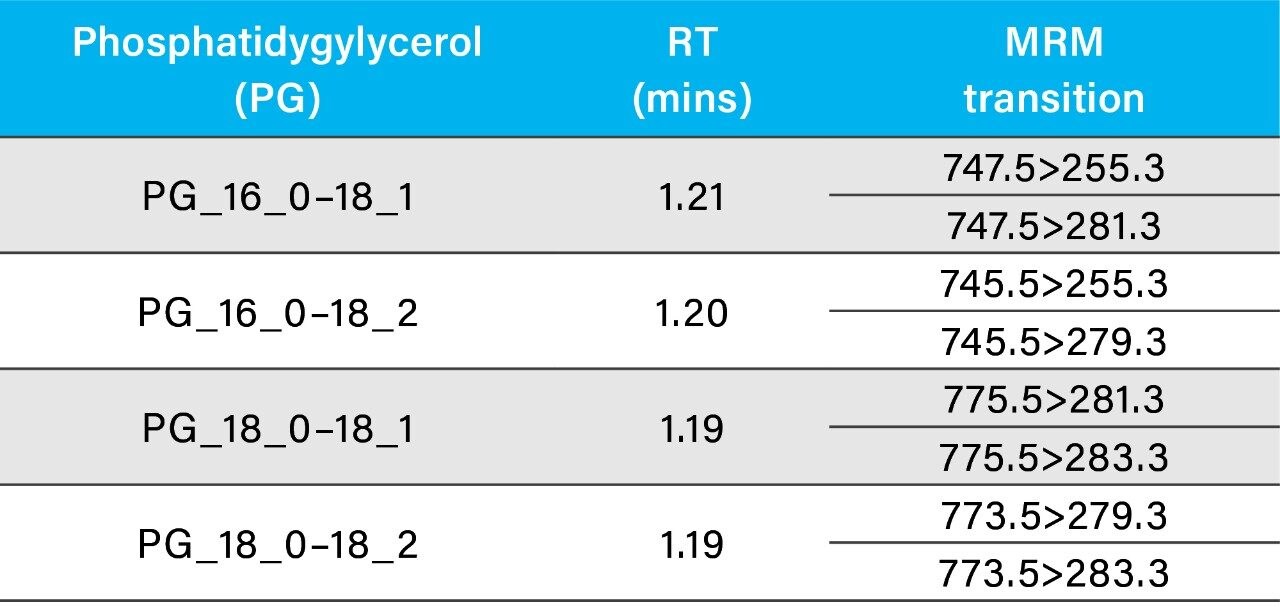
The LipidQuan Quanpedia method file features highly specific MRM transitions for fatty acyl chain fragments contained in 219 PGs, 279 PEs, and 90 PIs enhancing the specificity of the method and improving lipid identification. Although LPE and PE species share a common head group, the method chromatographically resolves these lipids based on the basis of class, thereby reducing potential isomeric and isobaric interferences (Figure 3). Isobaric effects are further minimised as the mass ranges of  LPE and PE precursors, 398–476 Da and 686–851 Da, respectively, do not overlap. 

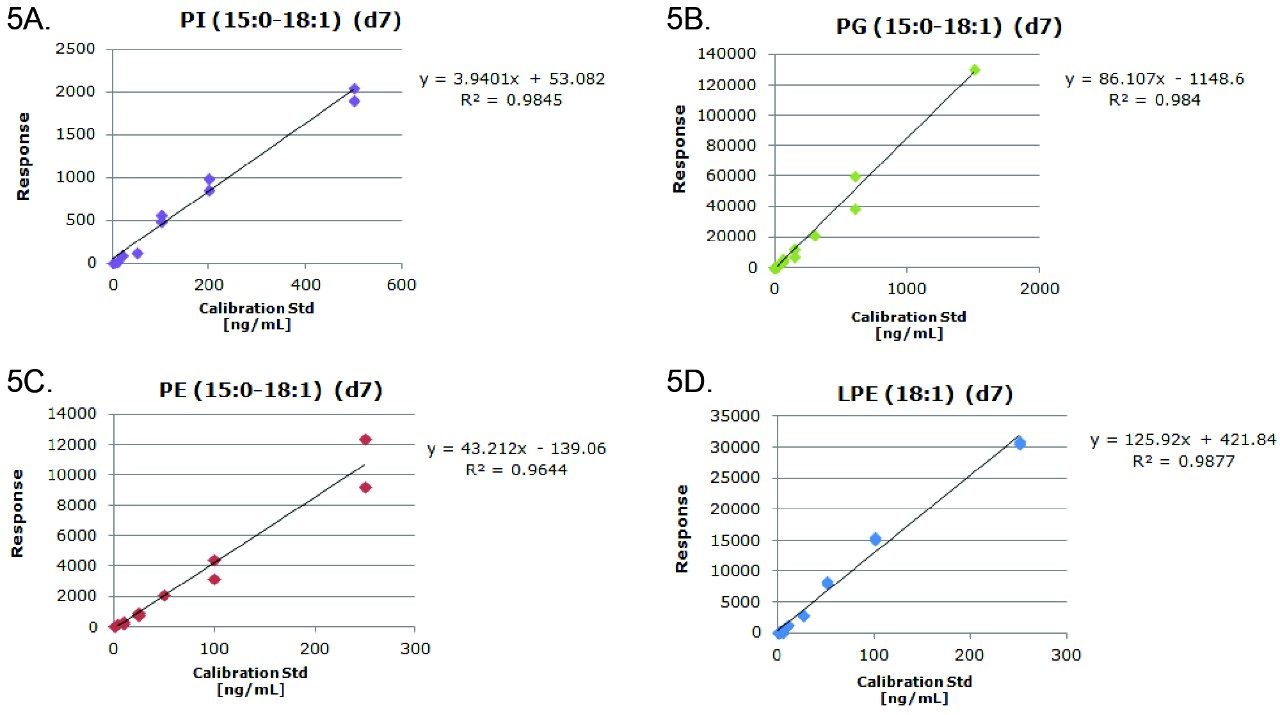
Quantification was achieved using calibration curves of plasma spiked with known concentrations of SIL standards prior to extraction. These SILs function as surrogate standards for the quantification of endogenous lipids within the same class. By using one surrogate standard per endogenous lipid class, rather than a SIL standard for each measured endogenous lipid, the cost of large studies can be significantly reduced. Example calibration curves for PI (15:0/18:1) (d7) and PG (15:0/18:1) (d7) SIL standards are shown in Figure 5A/5B and were used for quantification of endogenous PIs and PGs. Additional example curves representing PE (15:0/18:1) (d7) in negative ion and LPE (18:1) (d7) in positive mode are also shown (Figure 5C/5D). 

Figure 5. Calibration curves for PI (15:0/18:1) (d7) (1–500 ng/mL) (A), PG (15:0/18:1) (d7) (3–1500 ng/mL) (B) and PE (15:0/18:1) (d7) (0.5–250 ng/mL) (C) in negative ion mode from a typical plasma screen. The calibration curve for LPE (18:1) (d7) (0.5–250 ng/mL) (D) in positive mode from a typical plasma screen. Typically, R2 values of >0.95 and deviations from the line of best fit (CV <30%) are specified as acceptance criteria.

The data shown here was acquired using the curated LipidQuan Quanpedia method file (LipidQuan Quanpedia file v1.4). Typical R2 values of 0.95 and deviations from the line of best fit (CVs <30%) are routinely achieved (Tables 1–5).

Table 1. The back calculated concentrations of spiked SIL are included below as well as the actual concentration of SILs spiked into the NIST plasma in ng/mL.
Table 2. MRM transitions of endogenous LPE lipids in NIST Standard Reference Material® 1950 plasma with CVs <30%. The calibration range of LPE (18:1) (d7) was 0.5–250 ng/mL.
Table 3. MRM transitions of endogenous PE lipids in NIST Standard Reference Material® 1950 plasma with CVs <30%. The calibration range of PE (15:0–18:1) (d7) was 0.5–250 ng/mL.
Table 4. MRM transitions of endogenous PI lipids in NIST Standard Reference Material® 1950 plasma with CVs <30%. The calibration range of PI (15:0–18:1) (d7) was 1–500 ng/mL.
Table 5. MRM transitions of endogenous PG lipids in NIST Standard Reference Material® 1950 plasma with CVs <30%. The calibration range  of PG (15:0–18:1) (d7) was 3–1500 ng/mL.

Conclusion

  • A rapid, quantitative method was produced for the analysis of LPE, PE, PG, and PI lipids in plasma.
  • The method enabled the analysis of 11 LPEs, 47 PEs, 21 PGs, and 33 PIs within eight minutes.
  • The method was linear over four orders of magnitude and had sufficient sensitivity to allow for the analysis of lipids at endogenous levels in human plasma.
  • Employing a HILIC-based chromatography, lipids eluted according to class thereby reducing potential isomeric/isobaric interferences and the number of stable label isotopes required for quantification (i.e. cost reductions).

References

  1. Calzada, E., Onguka, O., Claypool, S. M. (2016). Phosphatidylethanolamine Metabolism in Health and Disease. International Review of Cell and Molecular Biology, 321, 29–88. http://doi.org/10.1016/bs.ircmb.2015.10.001.
  2. Tracey, T. J., Steyn, F. J., Wolvetang, E. J., Ngo, S. T. (2018). Neuronal Lipid Metabolism: Multiple Pathways Driving Functional Outcomes in Health and Disease. Frontiers in Molecular Neuroscience, 11(January), 1–25. http://doi.org/10.3389/fnmol.2018.00010.
  3. Cifkova, E., Holcapek, M., Lisa, M., Ovcacikova, M., Lycka, A., Lynen, F., Sandra, P. (2012). Nontargeted Quantitation of Lipid Classes Using Hydrophilic Interaction Liquid Chromatography-Electrospray Ionization Mass Spectrometry with Single Internal Standard and Response Factor Approach. Analytical Chemistry, 84(22), 10064–10070. http://doi.org/10.1021/ac3024476.

720006469, January 2019

Back To Top Back To Top