• Application Note

Successful Application for Distribution Imaging of Chloroquine Ocular Tissue in Pigmented Rat Using MALDI-Imaging Quadrupole Time-of-Flight Mass Spectrometry

Successful Application for Distribution Imaging of Chloroquine Ocular Tissue in Pigmented Rat Using MALDI-Imaging Quadrupole Time-of-Flight Mass Spectrometry

  • Henry Shion
  • Motoji Oshikata
  • Yasuhiro Yamada
  • Hidefumi Kaji
  • Yukari Haramaki
  • Alan L. Millar
  • John P. Shockcor
  • Waters Corporation

Abstract

MALDI-Imaging method of chloroquine distribution within rat ocular tissue was developed. It demonstrated that MALDI-Imaging will help significantly in elucidating the mechanism of drug efficacy and/or toxicity that is often associated with drug administration at the molecular level in the drug discovery and development processes.

Introduction

In drug discovery and development, it is critical to determine the metabolic fate of drugs absorbed in the body. Specifically, it is important to determine the tissue distribution, tissue concentration, and elimination rate of the drugs in order to obtain information such as efficacy and toxicity of drugs. Autoradiography (ARG) analysis, which displays the tissue distribution of the candidate drugs as a qualitative image using the labeled candidate drugs with radioisotope such as 14C or 3H, is utilized most often by a majority of pharmaceutical companies for such purpose.

The characteristic of an ARG approach can evaluate not only the tissue distribution of the drug to all tissue — including micro-tissue such as pituitary gland and pineal gland — but also tissue distribution as a spatial visual image. However, since this approach provides image information about compounds associated with radioactivity (the mixture of parent drug and/or its metabolites), the image information cannot always represent the disposition of compounds associated with efficacy and toxicity. Moreover, this approach requires radio-labeled drugs. Thus, since this approach has both advantages and disadvantages, the establishment of a new approach is expected.

Recently, several pharmaceutical companies have reported a MALDI-Imaging MS1 application for drug discovery and development,that provides the advantages of ARG2. MALDI-Imaging can be used to separate the distribution of a parent drug and its metabolite without radio-labeled compounds, and it can evaluate them atthe same time in visually spatial images. In addition, MALDI-Imaging allows the evaluation of the relationship between efficacy or toxicity and drug concentration in greater detail at a lower cost than the ARG approach. Therefore, MALDI-Imaging is expected to be an important complementary tool for determining the spatial distribution of drugs and metabolites in the drug discovery process.

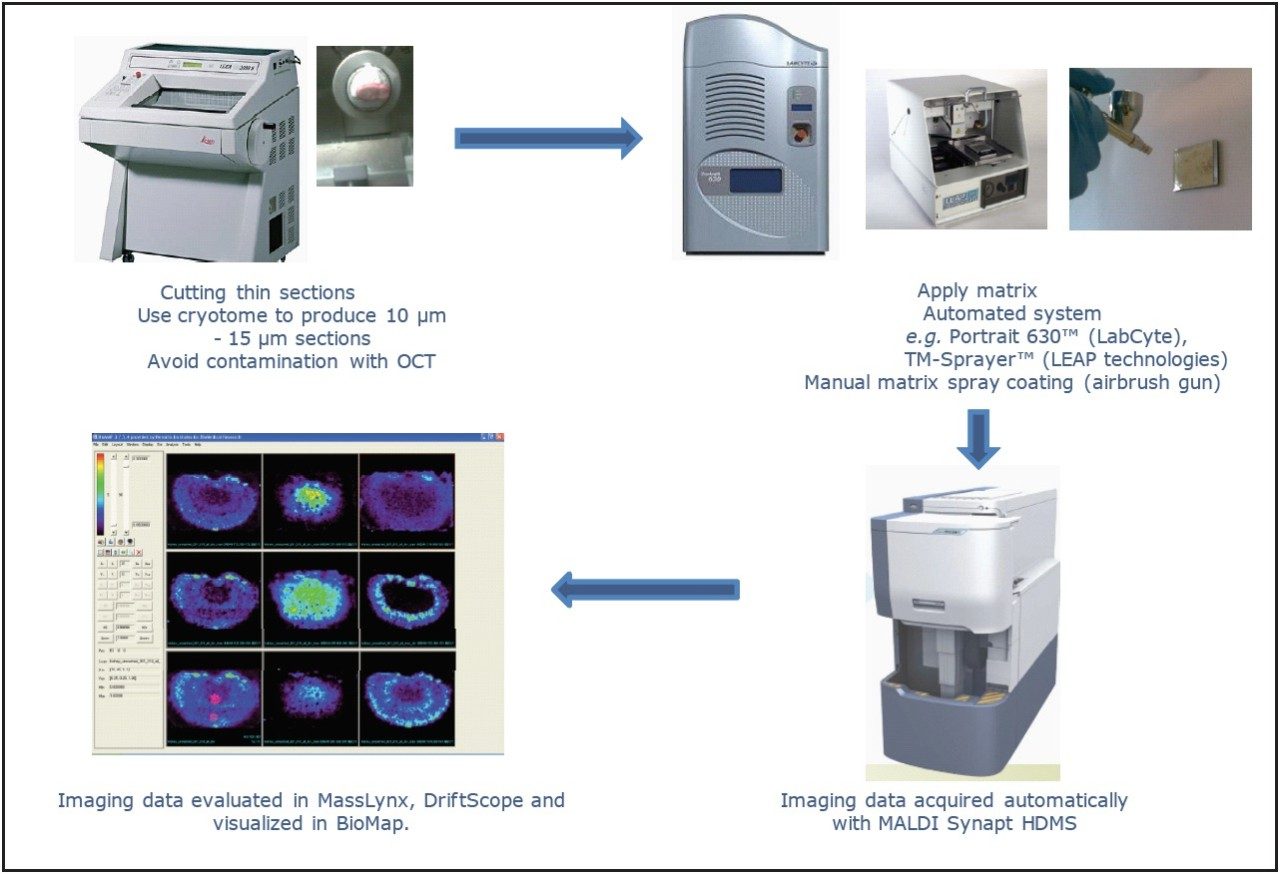
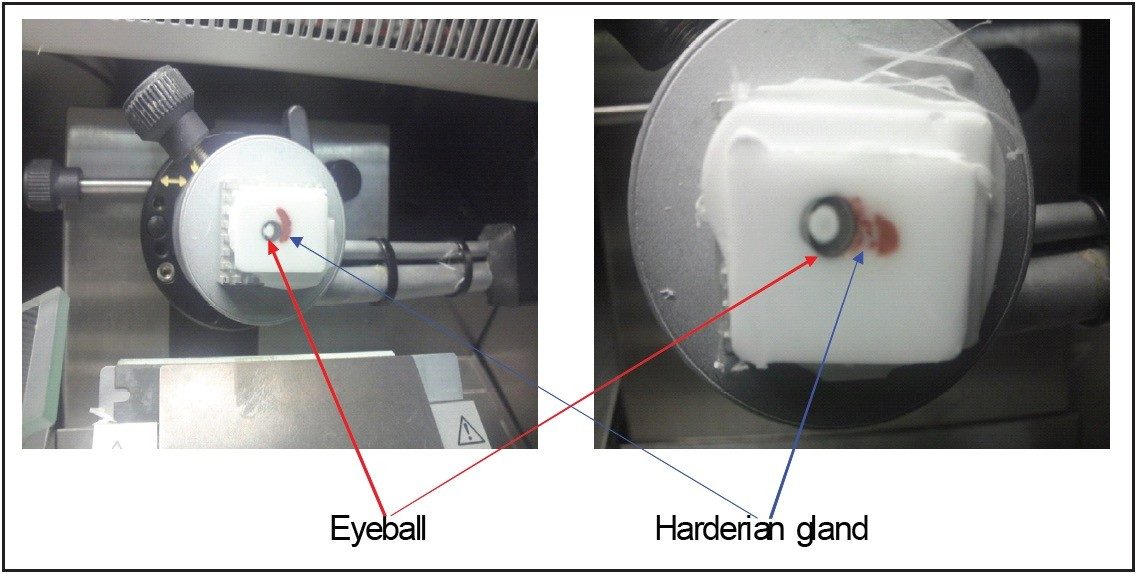
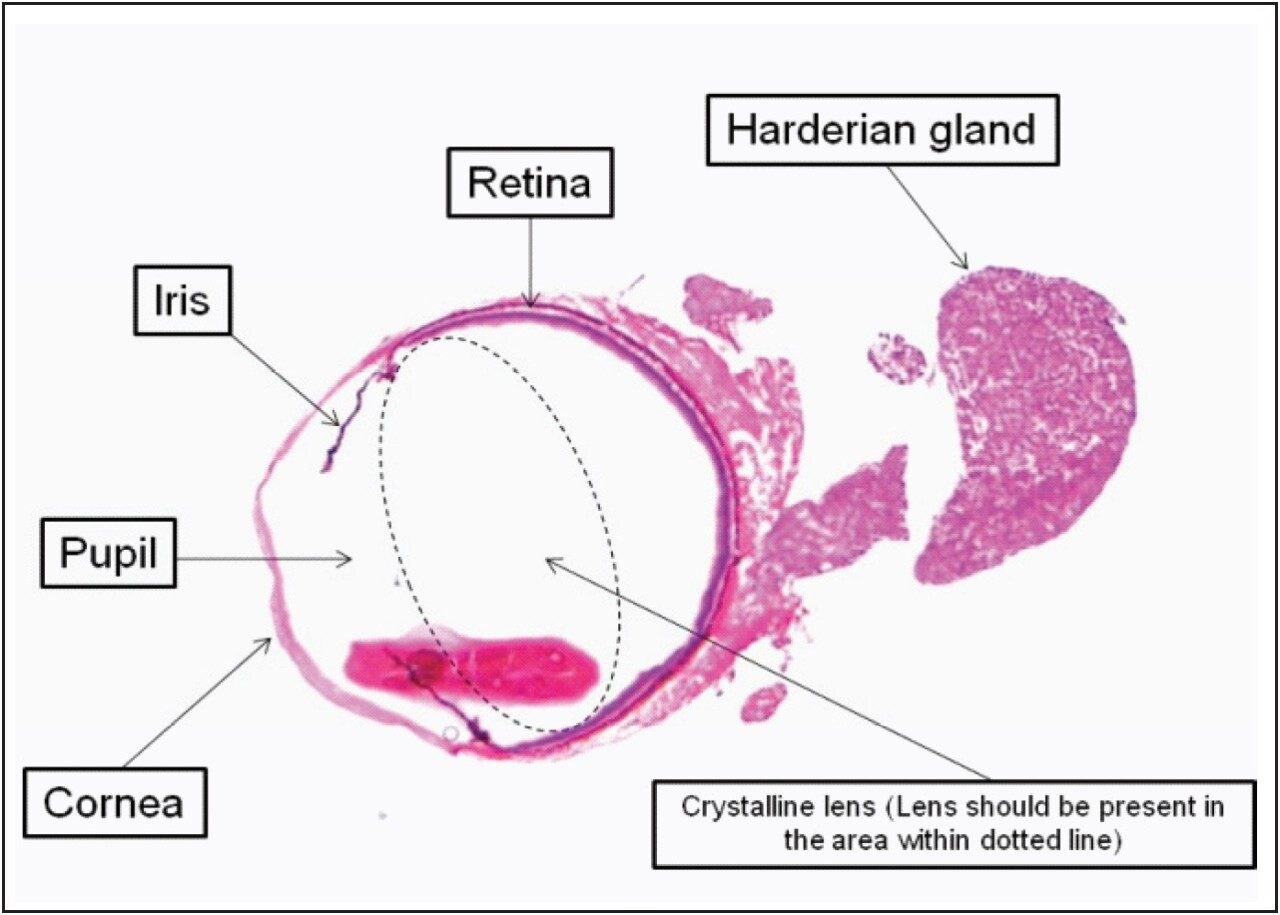
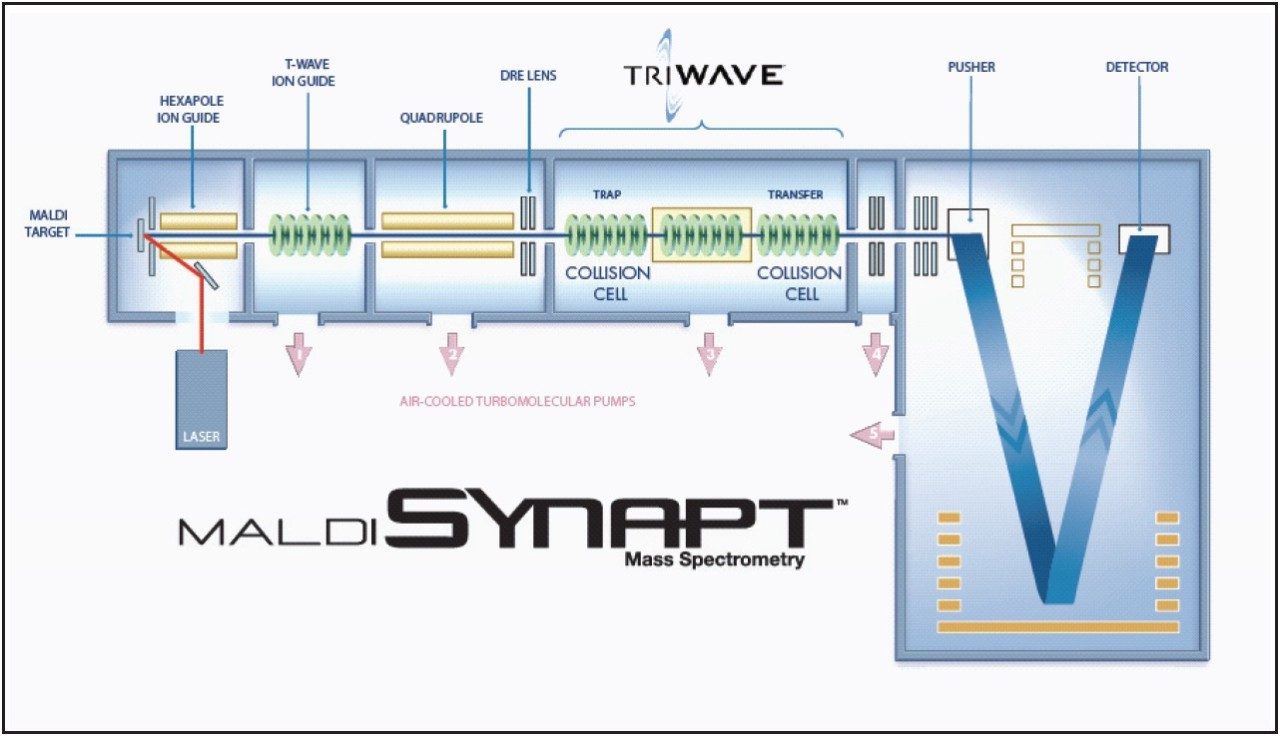
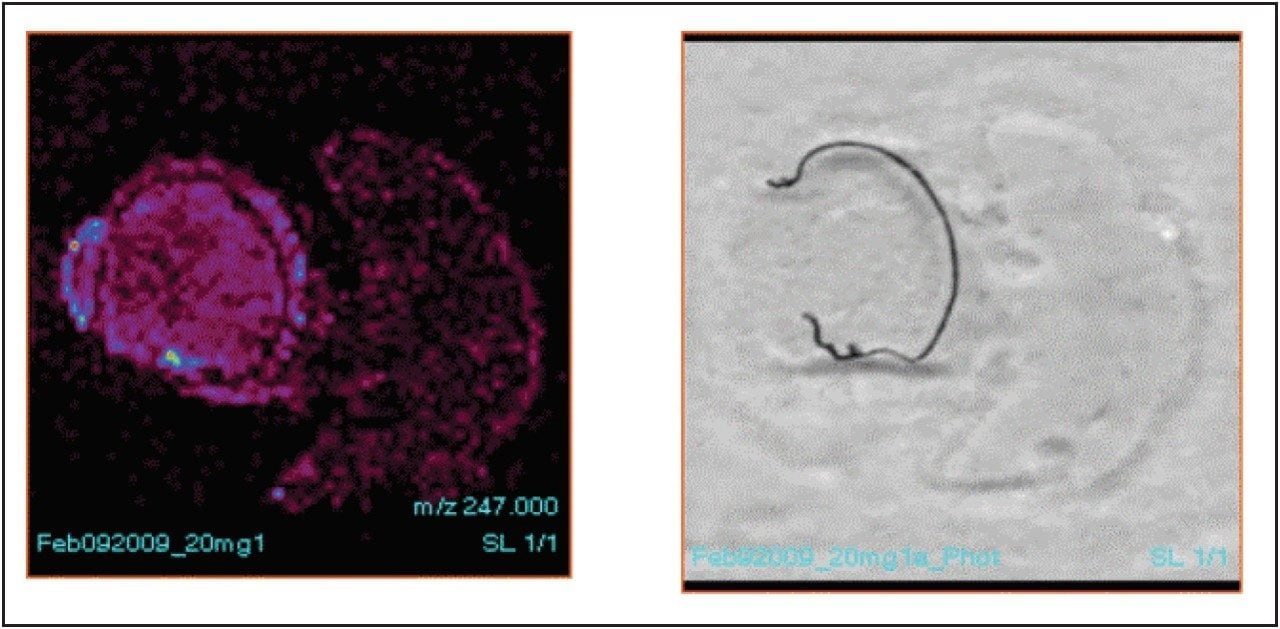
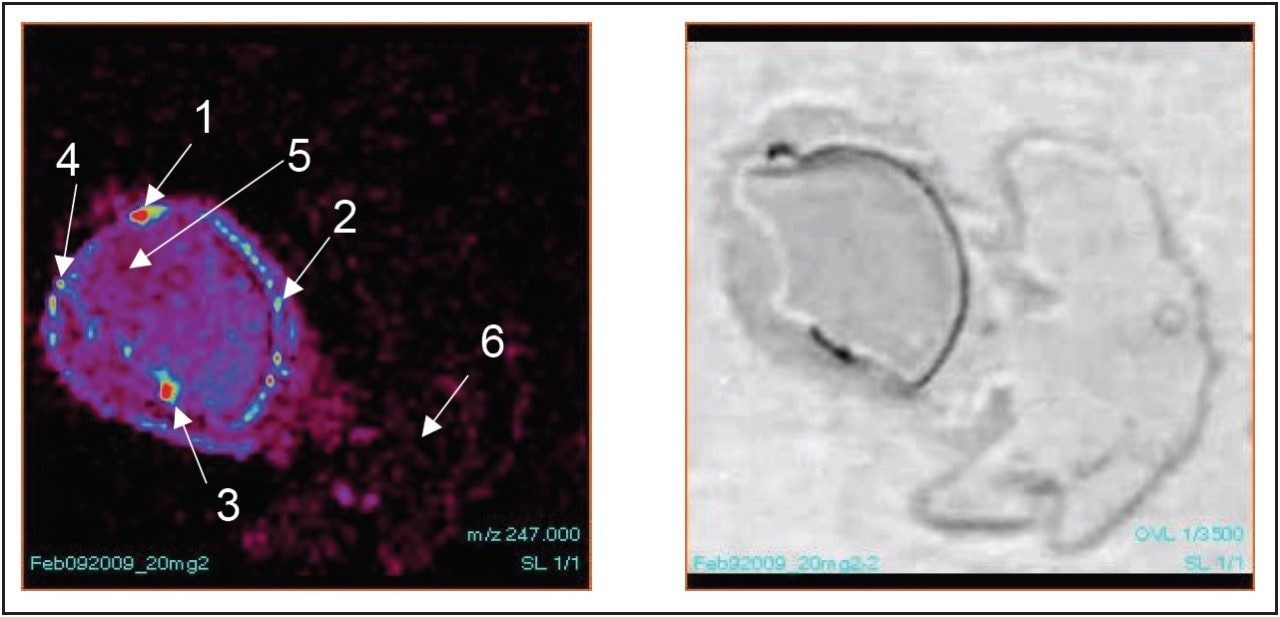
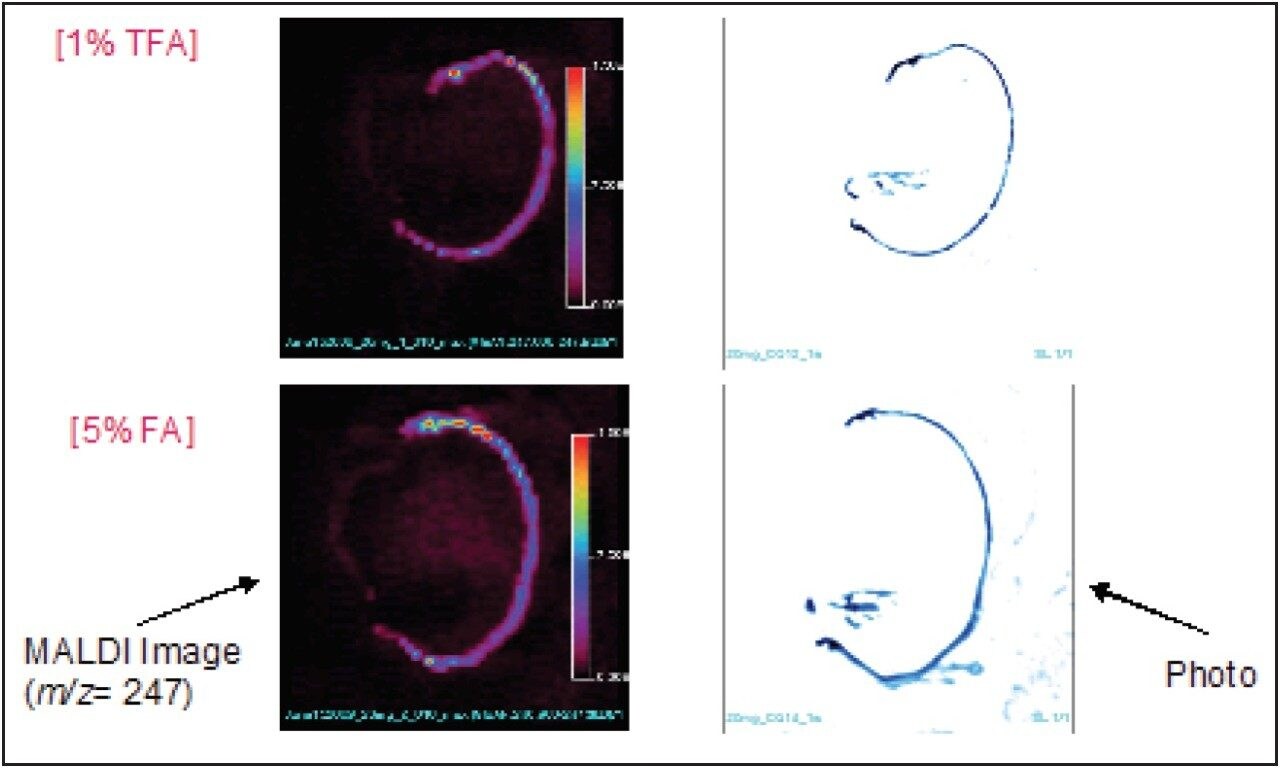
The bio-distribution and accumulation of the dosed drug and/or its metabolites at high levels in specific tissues can often lead to toxic events. In this study (Part 1 of a two-part study), in order to better understand drug compound toxicity specificity, we applied MALDI-Imaging MS to determine the specific distribution of chloroquine to the melanin-containing ocular tissue (found in the retina). The mass spectrometry system used in this  studywas Waters MALDI SYNAPT HDMS System, shown in Figure 1.

Experimental

Preparation of the ocular tissue section

The animals used in this study were male Brown Norway rats (Charles River Japan, Inc.) aged six weeks. The rats were subjected to laparotomy under anesthesia at 24 hr after oral administration of chloroquine at a dosage of 20 mg/kg. They were euthanized by exsanguinations from abdominal aorta with a syringe. Ocular tissues, including the harderian gland, were immediately removed from the administered rat of chloroquine or vehicle (control). The isolated ocular tissues were embedded in the Tissue-Tek O.C.T. compounds (Sakura Finetek Japan, Tokyo), and then frozen and stored at -80 °C until preparation of cryosection. The tissues were sliced using a Cryostat (Leica CM-3050, Leica Microsystems Inc., Bannockburn) at a tissue thickness of 10 μm at -18 °C, as shown in Figure 2. The slices were mounted onto non-coated microscope glass plates using electrostatic force, then dried by ventilation at room temperature.

Histological confirmation of ocular tissue

To better visualize the structures of the eyes — including the retina, iris, pupil, and cornea— one of the plates was applied to a hematoxylin-eosin stain, as shown in Figure 3.

Matrix solution

Four varieties of matrix solution were prepared:

  1. 10 mg/mL CHCA prepared in 50% acetonitrile aqueous solution (v/v), including 0.05% trifluoroacetic acid (TFA) (Matrix-A)
  2. 10 mg/mL CHCA prepared in 80% acetonitrile aqueous solution (v/v) including  1.00% TFA (Matrix-B)
  3. 10 mg/mL CHCA prepared in 80% acetonitrile aqueous solution (v/v) including  5.00% formic acid (Matrix-C)
  4. 5 mg/mL CHCA prepared in 80% acetonitrile aqueous solution (v/v) including  5.00% formic acid (Matrix-D)

Matrix application

Two methods, manual air brush and automatic sprayer, were used to apply the matrix solution to the tissue sample surface. For the manual method, an Iwata Studio Series compressor, fitted with an Iwata Eclipse gravity feed air brush (Portland, OR, USA), was used to deposit the matrix solution on the tissue surface. For automatic matrix deposition, a TM-Sprayer from LEAP Technologies (Carrboro, NC, USA) was used to deposit the matrix solution on the tissue surface. A schematic diagram of the TM-Sprayer3 is shown in Figure 4.

Mass spectrometry

Digital scans of the tissue sections were obtained prior to the imaging experiment using an HP ScanJet G4010 (Hewlett-Packard Company, Palo Alto, CA, USA), and imported into MALDI Imaging Pattern Creator Software, where the image area was selected. The MALDI-Imaging MS analysis data were acquired using MALDI SYNAPT HDMS, operated in positive ion mode, as shown in Figure 5.

The laser used was a frequency-tripled Nd:YAG laser (355 nm), firing at 200 Hz at the energy lever of 250 (a laser energy lever of 500 corresponding to about 100 uJ), with a sample plate voltage of 10 V. A spatial resolution of 150 μm was selected, and 400 laser shots were acquired per pixel. Argon was used as the collision gas. The trap collision cell voltage was 6 V in MS mode and 22 V in MS/MS mode. The m/z of precursor ion was set at m/z 320.18 for chloroquine, and a fragment ion of m/z 247.10 was used for imaging, based on the preliminary tests, as shown in Figure 6. Enhanced Duty Circle (EDC) was used for all MS/MS data acquisition.

Results and Discussion

1. Optimization of matrix solution

1-1. Application of Matrix-A using a manual airbrush

The image of the m/z=247.10 fragment ion derived from chloroquine was particularly weak, and the specific distribution to melanin-containing tissue was not observed at all. It appears that  melanin within the eye retina has a stronger affinity to the drug chloroquine than the matrix solution.

1-2. Application of Matrix-B using a manual airbrush

The image of m/z=247.10 fragment ion derived from chloroquine was observed. It appears that the higher the concentration of the acid, and the higher organic percentage in the matrix solution, the more chloroquine was extracted to the matrix in the tissue, resulting in higher signal intensity and better image distribution (Matrix-B).

Figure 8. MS/MS (m/z 320.19 g 247.10) image of an ocular tissue section using Matrix-B (left), and a digital photo image of the section (right).

The MS/MS spectra of m/z=247.10 fragment ion derived from chloroquine were only observed in point 1-4, but not in points 5 or 6. This indicates that the chloroquine is distributed specifically within the retina of the eye.

Figure 9. MS/MS spectra for the precursor ions (m/z 320.19) at point 1-6 in the eye section.

1-3. Application of Matrix-C using manual airbrush

The image produced by Matrix-B was approximately equivalent to the image produced by Matrix-C. However, since Matrix-B has a higher concentration of TFA (1 %), it reduces the sensitivity of the MS more quickly over time; it is considered that it may be more practical to switch to formic acid containing Matrix-C.

2. Optimization of matrix application method (manual airbrush versus automatic sprayer)

The image produced by the TM-Sprayer was more intense, compared to the image produced by manual airbrush, as shown in Figure 11.

Figure 11. Comparison of MS/MS (m/z 320.19 g 247.10) images of an ocular tissue section using TM-Sprayer (Matrix-D, upper) and a manual airbrush (Matrix-C, lower).

This observation was further confirmed by the spectrum peak intensity of the m/z=247.10 fragment ion derived from chloroquine by the TM-Sprayer image, which was 14 times stronger than that manual airbrush image, as shown in Figure 12.

Conclusion

  • MALDI-Imaging using SYNAPT HDMS indicates the specific distribution of chloroquine in rat tissue can visually be obtained with ease.
  • Automatic matrix spraying by TM-Spayer generates better signal intensity than by manual airbrush spraying.
  • There was a correlation between concentration and signal intensity: the higher the concentration of the acid and the organic percentage in the matrix solution, the higher signal intensity and better image distribution.
  • A lower dosage experiment should be conducted to assess the detection limit of the method.
  • This technology will help significantly in elucidating the mechanism of drug efficacy and/or toxicity that is often associated with drug administration at the molecular level in the drug discovery and development processes.

References

  1. Caprioli RM, Farmer TB, Gile J. 1997. Molecular imaging of biological samples: localization of peptides and proteins using MALDI-TOF MS. Analytical Chemistry 69: 4751–4760.
  2. Hsieh Y and Korfmacher, W, 2008. Mass spectrometry in drug metabolism and pharmacokinetics, page, 359.
  3. TM-Sprayer Tissue MALDI Sample Preparation System, Leap Technologies Technote. Can be found at http://www.maldi-msi.org/.
  4. Stoeckli M, http://www.maldi-msi.org/index.

Acknowledgement

The authors wish to thank Jose Castro-Perez, Merck Research Laboratories (Rahway, NJ, USA) for his contribution to this study.

720003706, September 2010

Back To Top Back To Top