• Application Note

Targeted Lipidomics of Oxylipins (Oxygenated Fatty Acids)

Targeted Lipidomics of Oxylipins (Oxygenated Fatty Acids)

  • Katrin Strassburg
  • Billy J. Molloy
  • Claude R. Mallet
  • Igor Bendik
  • Thomas Hankemeier
  • James I. Langridge
  • Rob J. Vreeken
  • Giuseppe Astarita
  • Analytical Biosciences, LACDR, Leiden University
  • Netherlands Metabolomics Centre, Leiden University
  • Waters Corporation
  • DSM Nutritional Products Europe Ltd.

Abstract

In this collaborative work developed by Leiden University, the Netherlands Metabolomics Center, DSM Nutritional Products Europe, and Waters, we present a high-throughput approach to screen and quantify bioactive oxylipins (oxidized fatty acids) in plasma. The combination of solid-phase extraction and UPLC/ESI-tandem quadrupole mass spectrometry provides a comprehensive analysis of oxylipins in a dedicated analytical workflow. Retention times and transitions of 107 oxylipins (including prostaglandins, prostacyclines, thromboxanes, dihydroprostaglandins, and isoprostanes) were annotated for routine high-throughput profiling of plasma samples.

Considering the prominent roles played by oxylipins in health and disease (e.g., inflammation), such a UPLC-based assay could become important as a diagnostic or prognostic screen in nutritional research, clinical research, and drug discovery and development.

Benefits

Here, we present a high-throughput approach for profiling bioactive oxylipins (oxidized fatty acids) in plasma. The combination of mixed mode solid-phase extraction (Oasis MAX SPE) and UPLC-ESI-MRM mass spectrometry (Xevo TQ-S) provides a comprehensive analysis of oxylipins in a targeted analytical workflow. Retention times and transitions of 107 oxylipins (including prostaglandins, prostacyclines, thromboxanes, dihydroprostaglandins, and isoprostanes) were annotated for routine high-throughput analysis of plasma samples. Considering the prominent roles played by oxylipins in health and disease (e.g., inflammation), such a UPLC-based  assay could become important in nutritional research, clinical research, and drug discovery and development.

Introduction

Oxylipins are signaling lipids that play prominent roles in the physiological regulation of many key biological processes, such as the relaxation and contraction of smooth muscle tissue, blood coagulation, and most notably inflammation. Alterations in oxylipin pathways have been associated with response to cardiovascular diseases, host defense, tissue injury and surgical intervention. The ability to semi-quantitatively profile a wide range of oxylipin in plasma samples could help our understanding of their roles in health and disease, as well as serve as biomarkers for disease diagnosis or prognosis.

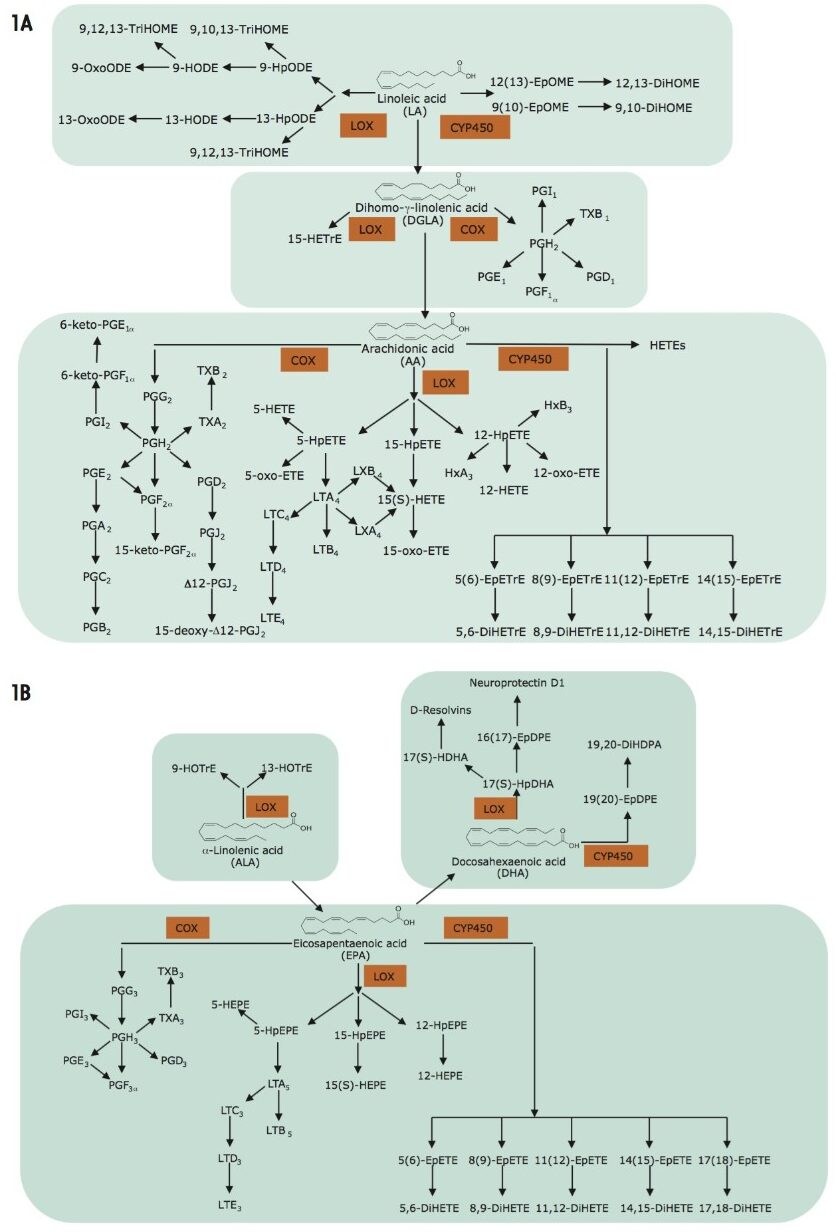
Oxylipins are produced via enzymatic (e.g., mono- or dioxygenase-catalyzed) or non enzymatic oxygenation of an array of both omega-6 polyunsaturated fatty acid substrates (e.g., linoleic acid, dihomo-γ-linolenic acid, adrenic acid and arachidonic acid) and omega-3 polyunsaturated fatty acid substrates (α-linolenic acid, acid, eicosapentaenoic acid, and docosahexaenoic acid) (Figure 1A and 1B). Three major enzymatic pathways are involved in their generation: cyclooxygenase (COX), lipoxygenase (LOX), and cytochrome P450 (CYP). These pathways are important drug targets for multiple diseases (Figure 1A and 1B). 

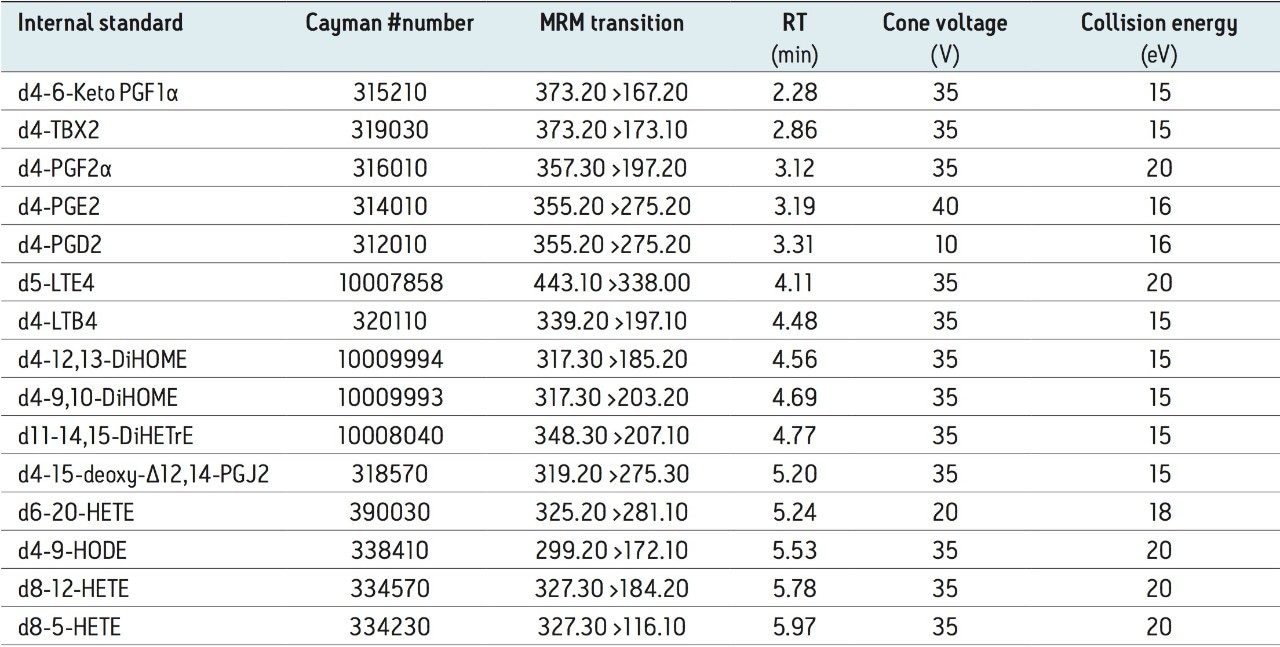
The main challenge for the measurement of oxylipins is the extremely low endogenous concentration of such lipid species and their limited stability. Furthermore, oxylipins are not stored in tissues but are formed on demand by liberation of precursor fatty acids from esterified forms. Lastly, the same fatty acid can be oxidized in different positions of its acyl chain leading to many isomeric species, each with specific metabolic actions. As a consequence, this requires a rapid, highly-sensitive, and specific analytical method.

Historically, measurements of oxylipins have been performed using radiometric and enzymatic immunoassays, which often lacked specificity and targeted only few compounds. GC-MS methodology has also been used, but this still requires multi-step procedures involving derivatization of the oxylipins to increase their volatility and stability.

Recently, various LC-MS methodologies have been described to monitor a broad range of low abundance oxylipins.1-5 In particular the method by Strassburg et al.2 reports on a wide range of oxylipins produced both enzymatically and non-enzymatically in human plasma. Although such methods are both sensitive and specific, there is an increasing demand for a comprehensive and high-throughput screening method to enable wide-ranging lipidomic studies. 

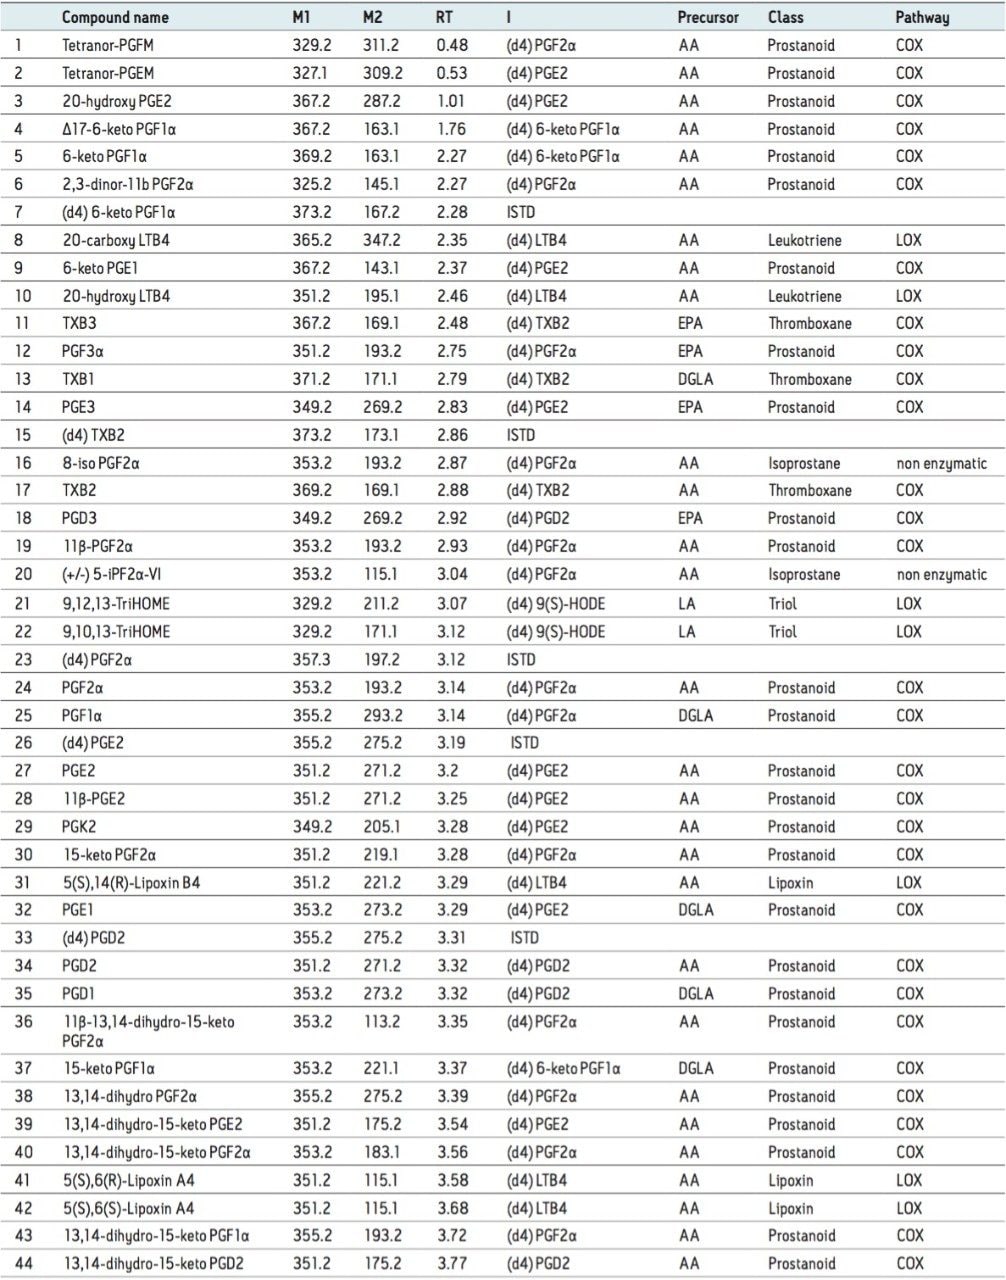
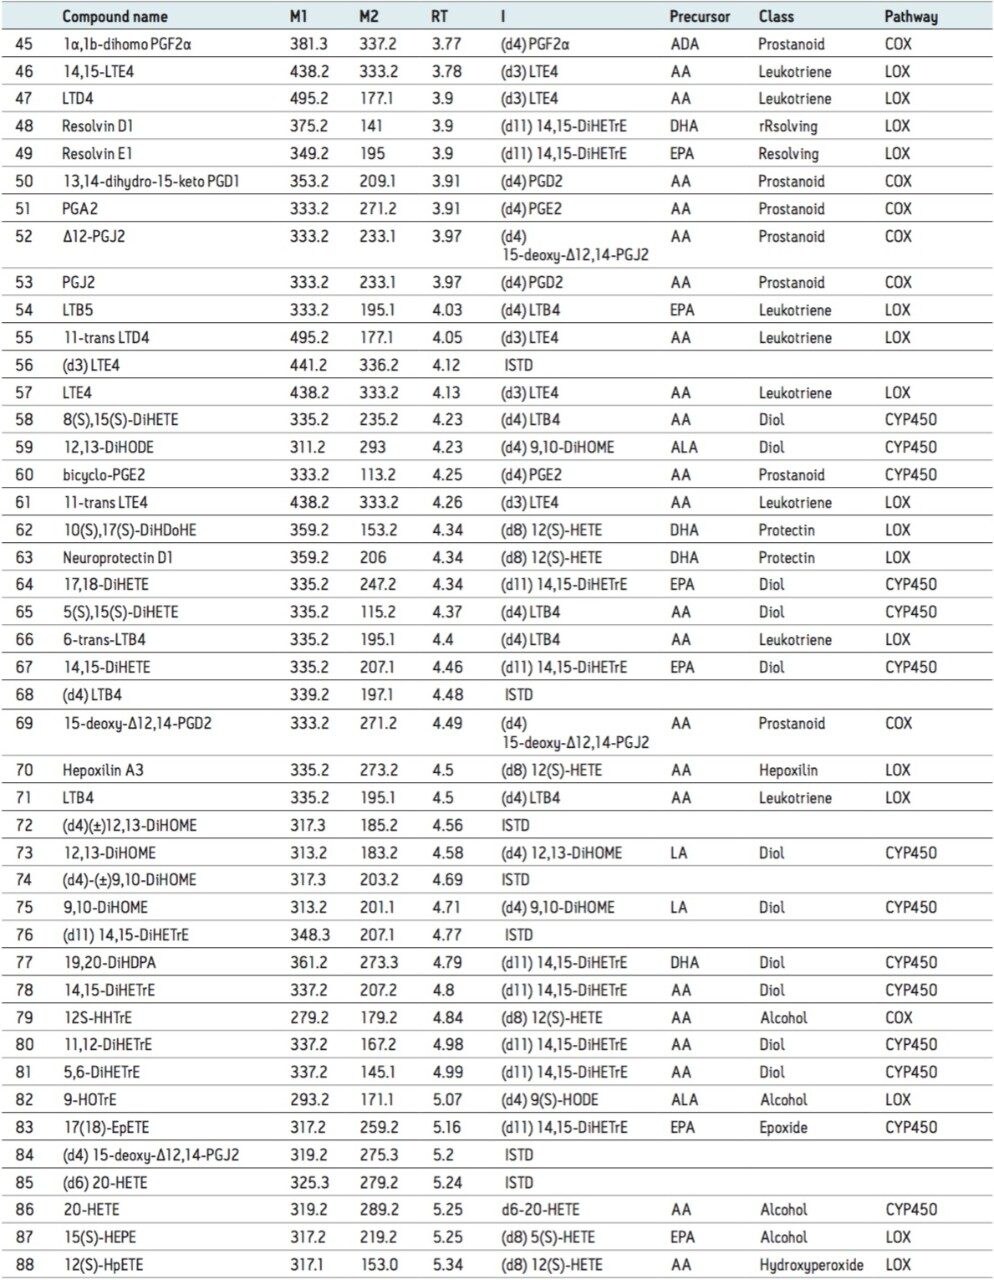
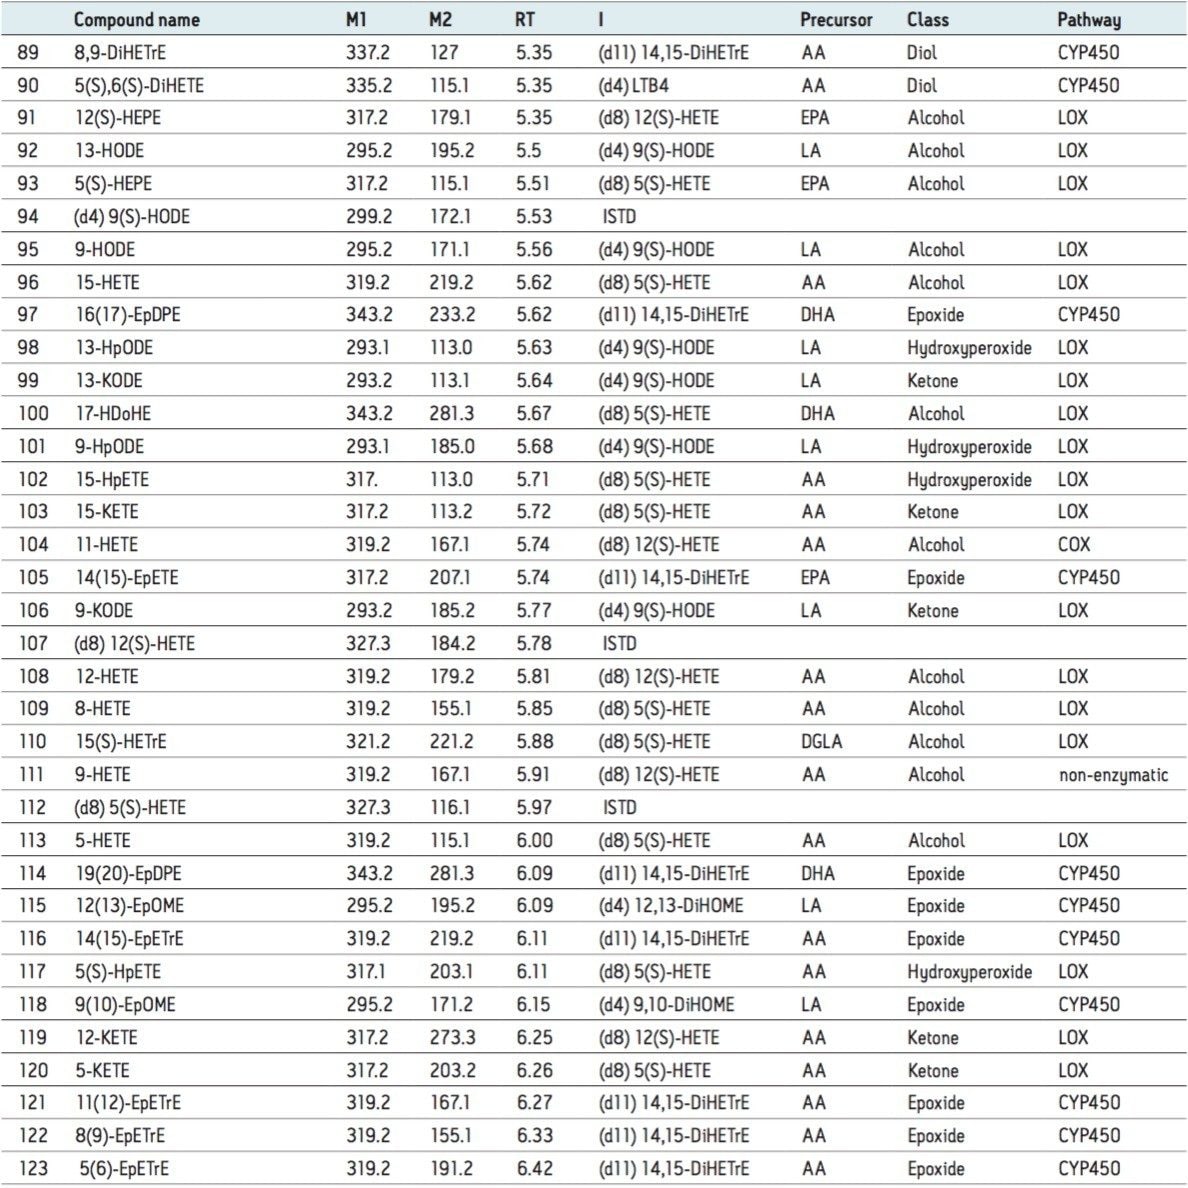
Here we report a high-throughput assay for the profiling of over 100 oxylipins, including prostaglandins, prostacyclines, thromboxanes, dihydroprostaglandins, and isoprostanes, in plasma samples.

Table 1. Internal standards used for profiling natural oxylipins in plasma and optimal UPLC-ESI-MS settings.

Experimental

Sample preparation

Materials

All chemicals were purchased from Sigma-Aldrich (Germany) and were of analytical grade or higher purity. Oxylipins standards were purchased from Cayman Chemicals (Ann Arbor, MI), Biomol (Plymouth Meeting, PA), and Larodan (Malm., Sweden). For mixed mode solid phase extraction we used Waters Oasis MAX 3 cc Vac Cartridge, 60 mg Sorbent per Cartridge, 30 μm Particle Size (p/n 186000367). An internal standard mixture containing 16 isotopically labeled compounds was used (Table 1).

Sample pre-treatment

(dilution, performed in borosilicate glass tubes 13 x 100 mm):

  1. Add 200 μL of 10% glycerol in water to a glass tube
  2. Add 50 – 250 μL of plasma (maximum sample volume available) sample to the tube and mix thoroughly
  3. Add 5 μL of 10 mg/mL BHT in ethanol and mix thoroughly
  4. Add 5 μL of internal standard solution (400 ng/mL) and mix
  5. Make up the total sample volume to 3 mL with 25% MeCN(aq) and mix thoroughly

MAX mixed mode solid phase extraction

  1. Condition Oasis MAX SPE Cartridge with 3 mL of MeCN
  2. Condition Oasis MAX SPE Cartridge with 3 mL of 25% MeCN(aq)
  3. Load the entire pre-treated sample onto the Oasis MAX SPE Cartridge
  4. Wash Oasis MAX SPE Cartridge with 3 mL of 25% MeCN(aq)
  5. Wash Oasis MAX SPE Cartridge with 3 mL of MeCN
  6. Elute analytes with 1.3 mL of 1% Formic in MeCN8*
  7. Transfer eluate to a glass HPLC vial (TruView™ Max Recovery Vial)
  8. Evaporate eluate down until only the glycerol remains (under nitrogen at 40 °C)
  9. Add 60 μL of 50/50 MeOH/MeCN and mix thoroughly
  10. Inject 3 μL onto the UPLC-MS/MS System

*Sample eluted into a glass tube containing 200 μL of 10% glycerol in methanol

UPLC conditions

System:

ACQUITY UPLC. System in negative ESI mode

Column:

ACQUITY UPLC BEH C18, 1.7 μm, 2.1 x 100 mm

Mobile phase A:

H2O + 0.1% acetic acid

Mobile phase B:

ACN/IPA (90/10 v/v)

Flow rate:

0.6 mL/min

Column temp.:

40 °C

Volume:

3.0 μL

Elution Gradient

Min

A%

B%

Curve

0

75

25

1

75

25

6

8

5

95

6

8.5

5

95

6

8.51

75

25

6

10

75

25

6

MS conditions

For optimum reproducibility of retention times we recommend the following tubing to connect UPLC analytical column to ESI probe: PEEK Tubing, 1/16 in. (1.6 mm) O.D. X 0.004 in. (0.100 mm) I.D. X 5 ft (1.5 m) length, cut to 400 mm in length.

MS system:

Xevo TQ-S in negative ESI mode

Acquisition mode:

MRM

Capillary voltage:

2.5 kV

Cone voltage:

10-40 V (compound Specific, default = 35 V)

Source temp.:

150 °C

Desolvation gas temp.:

600 °C

Desolvation gas flow:

1000 L/h

Cone gas flow:

150 L/h

Collision energy:

15-20 V (compound Specific, default = 15 V)

Data management

TargetLynx Application Manager

Results and Discussion

 The primary focus of this work was to provide a high-throughput method to profile bioactive oxylipins in plasma samples.

Figure 1. A. Schematic outline of the oxylipins of the omega-6 series produced by linoleic acid C18:2 (LA), dihomo-γ-linoleic acid C20:3 (DHGLA), and arachidonic acid C20:4 (AA), via the cyclooxygenase (COX), lipoxygenase (LOX), CYP-450, or free radical catalyzed pathways. B. Schematic outline of the oxylipins of the omega-3 series produced by α-linolenic acid C18:3 (ALA), eicosapentaenoic acid C20:5 (EPA), and docosahexaenoic acid C22:6 (DHA), via the COX, LOX, CYP-450, or free radical catalyzed pathways. Abbreviations: dihydroxyeicosatetraenoic acid (DiHETE), epoxyoctadecenoic acid (EpOME), hydroxy-eicosatrienoic acid (HETrE), hydroxyeicosatetraenoic acid (HETE), hydroxy-heptadecatrienoic acid (HHTrE), hydroxyoctadecadienoic acid (HODE), hydroxyeicosapentaenoic acid (HEPE), oxo-eicosatetraenoic acid (KETE), oxo-octadecadienoic acid (KODE), prostaglandin (PG), thromboxane (TX).
Table 2. List of MRM transitions (M1=precursor; M2= fragment) and retention times (RT) for oxylipins.

Oxylipins are present at very low abundance in biological samples, and as such the quality of sample preparation is an important factor for successful analyses. To eliminate non-lipid contaminants and highly abundant species like phospholipids, we used mixed mode solid-phase extraction (SPE) prior to UPLC-MS analysis. Normalization of the extraction efficiency was achieved by adding stable isotope labeled compounds (internal standards), prior to the extraction procedure (Table 1 and 2, and Figure 2). 

Figure 2. Workflow of the sample preparation for the analysis of oxylipins from plasma.

To optimize the chromatographic separation of our analytes, we used a mixture of a wide chemical variety  of commercially available oxylipins. Using reversed-phase UPLC (see Experimental), oxylipins eluted in order of decreasing polarity, numbers of double bonds and increasing acyl chain length, allowing the separation of most isomeric and isobaric species (e.g., PGE2 and PGD2) in less than 10 minutes (Figure 3). Using a Xevo TQ-S in negative ESI-mode, retention times and optimal MRM transitions (compound specific precursor ⇒ product ion transitions) were determined for all individual oxylipins (Table 2). 

To enhance the sensitivity of detection, these MRM transitions were monitored in defined retention time windows, maximizing dwell times by reducing overlapping transitions. In the case of co-eluting metabolites, compound specific precursor ions and their corresponding fragment ions allowed selective profiling of those compounds. Calibration curves for the majority of the analytes were produced and displayed a linear coefficient (Pearson’s correlation, R2) higher than 0.99. (Figure 4). Using this UPLC-MS/MS assay, we rapidly profiled 107 oxylipins in human plasma samples (Figure 5). 

With minor modifications in the sample preparation protocol, this assay could be extended to the measure of oxylipins in other biological matrices.

Figure 3. Representative UPLC-MS/MS chromatogram of a wide chemical variety of oxylipin species.
Figure 4. Linearity of response for representative endogenous oxylipin species present in the plasma samples.
Figure 5. An example of oxylipin quantification in plasma using TargetLynx, showing the use of a specified retention time, MRM transitions and internal standard for the identification and quantification of a selected oxylipin.

Conclusion

We have presented a routine high-throughput MRM method to profile over 100 oxylipins in plasma. These targets include a wide array of both pro- and anti-inflammatory lipid mediators. This SPE-UPLC-MRM assay could find applications in basic research to facilitate our understanding of the role of  these lipid mediators in health and disease, nutritional research, clinical  research, and drug discovery and development.

References

  1. Lundstrom SL, Saluja R, Adner M, Haeggstrom JZ, Nilsson GP, Wheelock CE. Lipid mediator metabolic profiling demonstrates differences in eicosanoid patterns in Two phenotypically distinct mast cell populations. J Lipid Res. 2012 Oct 3. [Epub ahead of print].
  2. Strassburg K, Huijbrechts AM, Kortekaas KA, Lindeman JH, Pedersen TL, Dane A,Berger R, Brenkman A, Hankemeier T, van Duynhoven J, Kalkhoven E, Newman JW, Vreeken RJ. Quantitative profiling of oxylipins through comprehensive LC-MS/MS analysis: application in cardiac surgery. Anal Bioanal Chem. 2012 Sep;404(5):1413–26.
  3. Sterz K, Scherer G, Ecker J. A simple and robust UPLC-SRM/MS method to quantify urinary eicosanoids. J Lipid Res. 2012 May;53(5):1026–36. 
  4. Nicolaou A, Masoodi M, Mir A. Lipidomic analysis of prostanoids by liquid chromatography-electrospray tandem mass spectrometry. Methods Mol Biol. 2009;579:271–86.
  5. Astarita G, Kendall AC, Dennis EA, Nicolaou A. Targeted lipidomics strategies for oxygenated metabolites of polyunsaturated fatty acids. Biochim Biophys Acta. 2014 Dec 5. pii: S1388-1981(14)00251–0.

720004664, March 2015

Back To Top Back To Top