This application note demonstrates an improvement in the current LC-MS method for vitamin D analysis. It demonstrates the determination of total vitamin D by individually measuring the vitamin D and previtamin D in food products. Previtamin D was directly measured in the total vitamin D analysis, eliminating the error that could arise from not measuring previtamin D. This method will be less affected by the heating history of food products.
Vitamin D is a fat-soluble vitamin that promotes calcium absorption and maintains adequate serum calcium and phosphate concentrations to enable normal mineralization of bone and to prevent hypocalcemic tetany.1 The most common vitamin D compounds are vitamin D3 (also known as cholecalciferol) and vitamin D2 (ergocalciferol). Their structures are shown in Figure 1. Vitamin D can be produced endogenously when ultraviolet (UV) light strikes the skin and triggers vitamin D synthesis. Recent studies revealed that humans might not produce adequate supplies of vitamin D from exposure to sunlight alone, so it is important to supplement vitamin D intake through diet.2 The U.S. Food and Drug Administration (FDA) revised the food labeling regulations in 2016 to make the vitamin D content a required item on the nutrition or supplement facts labels for conventional food and dietary supplements.3 The change in labeling regulation is aimed to promote vitamin D awareness among consumers.
Existing standard methods for vitamin D analysis involve saponification, liquid-liquid extraction (LLE), sample clean-up, and liquid chromatography (LC)-UV determination. The most challenging aspect in vitamin D analysis is the diverse interferences from sample matrix. A large number of lipid-like compounds are co-extracted with the vitamin D, and even after extensive sample clean-up, there are still numerous interferences that co-elute and interfere with the vitamin D quantitation. Recently, to simplify the sample preparation and to improve the analysis, a derivatization reaction with 4-Phenyl-1,2,4-triazoline-3,5-dione (PTAD) and mass spectrometry (MS) were adopted in a new AOAC standard method.4 This new method has provided much better analytical performance for vitamin D analysis. However, previtamin D is not measured in this new standard.
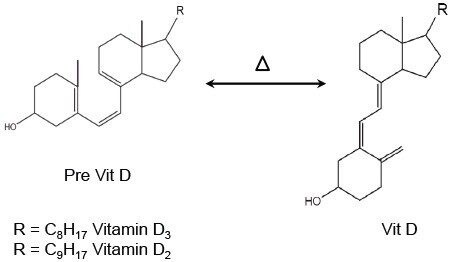
It is known that vitamin D can thermally isomerize to previtamin D. This transformation is reversible (Figure 2), and both forms are biologically active. It has been reported that the relative content of previtamin D could be up to 22% of the total vitamin D at 80 °C.5 Therefore, it is prudent to individually determine previtamin D and vitamin D contents in the analysis of vitamin D in foods. This application note demonstrates the determination of total vitamin D by individually measuring the vitamin D and previtamin D in food products.
Vitamin D3 and vitamin D2 were purchased from Sigma-Aldrich. Stable isotope labeled cholecalciferol (6,19,19-d3) (SIL-D3) was purchased from Cambridge Isotope Labs (Tewksbury, MA) and used as the internal standard (IS). Infant formula reference material NIST 1849a was purchased from National Institute of Science and Technology (NIST, Gaithersburg, MD). PTAD, potassium hydroxide (KOH), pyrogallol (or 1,2,3-trihydroxybenzene), butylated hydroxytoluene (BHT), formic acid, and absolute ethanol were purchased from Sigma-Aldrich. Food products, such as non-fat dry milk powder (fortified with A and D), infant formulas (milk based and soy based), oatmeal, and fish oil were purchased from local market. All sample preparation was carried out in subdued light and in amber glass vials.
The Vitamin D standards (vitamin D3 and vitamin D2) were dissolved in absolute ethanol to form 1 mg/mL stock solutions. Portions of these vitamin D stock solutions were used for the purity check using a UV/Vis spectrophotometer. Aliquots of the vitamin D stock solutions were mixed and diluted with acetonitrile (ACN) to form vitamin D mix stock solutions. The vitamin D mix stock solutions were spiked with IS (SIL-D3), and diluted with ACN to obtain a series of standard calibration solutions ranging from 1 ppb to 500 ppb (or ng/mL). The IS level was kept at constant concentration in these standard solutions. These calibration solutions underwent the derivatization step as described below.
About 0.5 g (weighted to 0.001 g) of samples were separately spiked with IS (20 ng SIL-D3), mixed with 4 mL of water and 16 mL of pyrogallol ethanolic solution (2 g/100 mL). 8 mL of KOH (50%) solution was then added and mixed. The solutions turned black after mixing. The solutions were put in a hot water bath (75 °C) for 1 hour with periodical mixing every 30 min. After the solutions were cooled to room temperature in an ice bath, 12 mL of hexanes (with 12.5 mg/L BHT) was added, mixed, and centrifuged. The hexane layer portion was taken and washed with 8 mL water 4 times. A centrifuge (1500 rpm for 2 min) was used to aid the phase separation. These extracts underwent derivatization as described next.
100 µL of each standard calibration solution or 6 mL of the hexanes extract from each sample was dried with a gentle nitrogen stream at 30 °C, then mixed with 0.6 mL PTAD solution (1 mg/mL in ACN). The mixtures were kept at room temperature in the dark for 40 minutes. The derivatization reaction was quenched with 0.4 mL water and the sample was filtered with a 0.2 µm PTEF syringe filter before injection.
System: |
ACQUITY UPLC H-Class with Xevo TQ-S micro MS System |
Software: |
MassLynx v4.1 |
Column: |
ACQUITY UPLC BEH C18 2.1 x 50 mm, 1.7 μm |
Column temp.: |
40 °C |
Mobile phases: |
A) Water (0.1% formic acid); B) ACN (0.1% formic acid) |
Inj Vol.: |
10 μL |
Flow rate: |
0.60 mL/min |
Run time: |
8.5 min |
Polarity: |
ESI+ |
Capillary (kV): |
1.2 |
Source temp.: |
150 °C |
Desolvation temp.: |
500 °C |
Cone gas flow (L/Hr): |
0 |
Desolvation gas flow (L/Hr): |
1000 |
Figure 3 shows the typical MRM chromatograms of vitamin D and previtamin D in standard mixtures and in infant formula samples. The Retention times of the vitamin D derivatives (D3:PTAD, D2:PTAD, and SIL-D3:PTAD) and the previtamin D derivatives (preD3:PTAD, preD2:PTAD, and SIL-preD3:PTAD) are 3.50 min and 3.67 min, respectively.
There is no pure standard for previtamin D. In order to quantify the previtamin D, the relative response factors of the vitamin D over the previtamin D were determined in a simple experiment as follows. A solution with certain concentrations of the vitamin D3, vitamin D2, and SIL-D3 was split into two portions. One portion was kept at room temperature, while the other portion was heated and maintained at 75 °C for 1 hour. Because of the isomerization equilibration, the heated portion would have increased previtamin D and decreased vitamin D contents than those in the unheated portion. Since the total vitamin D content in the two portions was the same, the relative response factor of the vitamin D over the previtamin D was calculated by the following equation:
Rel. Response Factor = (VitD Peak Area Unheated–VitD Peak Area heated)/(PreD Peak Area Heated–PreD Peak Area Unheated) - Eq. (1)
The Rel. Response Factors for vitamin D3, vitamin D2, and SIL-D3 were determined each time the samples were analyzed.
Total vitamin D is calculated as the sum of the previtamin D and the vitamin D contents. The total vitamin D peak area was calculated according to the following equation:
Total VitD Peak Area = VitD Peak Area + Rel. Response Factor x PreD Peak Area Eq. (2)
In the calibration process, the Total VitD Peak Area ratios of the analyte over the IS were plotted against their total vitamin D concentration ratios (analyte over IS). A linear regression through zero fitted the data points very well. Figure 4 shows a typical calibration plot. The R2 values of 0.999 and 0.997 were obtained (Fig. 4) for vitamin D3 and vitamin D2, respectively. The calibration ranges were 0.0004 mg/kg to 0.2 mg/kg for vitamin D3, and 0.002 to 0.2 mg/kg for vitamin D2. These ranges are comparable to the AOAC standard method.4
The total vitamin D (D3 or D2) content in samples was calculated using the following equation:
Total Vitamin D = (Total VitD Peak Area x mass of spiked IS in sample)/Total VitD Peak Area (IS) x Slope in Calibration Curve x mass of sample - Eq. (3)
where the Total VitD Peak Area is calculated according to equation 2. The IS concentration in calibration solutions were kept at 50 ppb (or 50 ng/mL), and the spiked mass of IS in samples were kept at 0.020 µg. The total vitamin D results are in mg/kg unit.
The limit of detection (LOD) and limit of quantitation (LOQ) were estimated based on the peak area standard deviation (SD) in oatmeal and in solvent at low concentrations near the LOQ (Table 3). The LOD was estimated at 3 times the SD in peak area and the LOQ was estimated at 10 times the SD in peak areas. The LOQ values for vitamin D3 and vitamin D2 were estimated at 0.01 mg/kg and 0.02 mg/kg in oatmeal, and 0.0003 mg/kg and 0.002 mg/kg in solvent, respectively. The LOQ values are comparable to the existing standard.4
The NIST reference material 1849a was measured and the average value and relative standard deviation (RSD) were compared with the reference values (Table 4). Excellent accuracy (102.6%) and repeatability (RSD 2.4%) was obtained. A spiking experiment was performed on the infant formula (at 0.09 mg/kg) and the oatmeal (at 0.02 and 0.09 mg/kg) and results are shown in Table 5. The recovery of the two spiking levels ranged from 98% to 117%. Besides the infant formula, other types of foodstuff, such as non-fat dry milk powder fortified with vitamin D, soy based infant formula, chocolate fortified with vitamin D, oatmeal, and fish oil were tested. Table 6 shows the results of three replicate measurements of the total vitamin D contents of these food products. The mean and the RSD results for the vitamin D3 and D2 are listed in the table. The vitamin D values on nutrition or supplement facts sheet of these foods were converted to numbers in mg/kg and listed in Table 6 for comparison. The determined vitamin D concentrations for milk and oatmeal were in agreement with their label claim for vitamin D values (less than 9% in difference). The result for soy based infant formula was 52% higher than the label value, which is not uncommon for food product testing. The result for the fortified chocolate was high (70% higher than the label value), and the cause is unknown and needs further investigation. The nutrition fact information for the fish oil product was not available for comparison.
To emphasis the need to consider previtamin D in total vitamin D measurements, the same two sets of sample data were processed using two different methods of quantitation. A comparison of the methods is summarized in Table 7. In method A, total vitamin D was quantified without using the previtamin D peak area. This is the same data processing method that the standard method used.4 In method B, total vitamin D was quantified using both the previtamin D and the vitamin D peak areas in the calibration and the quantitation, which is the new method that we propose to use in this study. One can see that in Table 7, method A allowed 11–12% difference for the standards prepared at different conditions (high temperature, HT, vs. room temperature, RT) while method B only had 1–2% difference. For samples with different saponification conditions (HT saponification vs. RT saponification), method A showed a larger difference (3–6%) than method B did (1–3%). Table 7 data proves that method B is less affected by the previtamin D concentration variation. The bottom line is that without measuring the previtamin D concentration, the total vitamin D analysis result could carry a large error that could be contributed to previtamin D formation during the manufacturing, transportation, or storage of food products.
This application note demonstrates an improvement in the current LC-MS method for vitamin D analysis. Previtamin D was directly measured in the total vitamin D analysis, eliminating the error that could arise from not measuring previtamin D. This method will be less affected by the heating history of food products. Therefore, potential errors due to conversion of vitamin D to previtamin D are eliminated when accidental situations occur during the manufacturing, transportation, or storage of food products.
The results of vitamin D analysis for the NIST reference sample showed excellent accuracy (102.6%), and repeatability (2.4%). The recovery data from oatmeal and infant formula ranged from 98% to 117%. The LOQs in oatmeal were 0.01 mg/kg and 0.02 mg/kg for vitamin D3 and vitamin D2, and 0.0003 mg/kg (D3) and 0.002 mg/kg (D2) in solvent. A variety of food products, such as non-fat dry milk power, infant formula (soy based), chocolate, oatmeal, and fish oil samples have been successfully tested with this method. Good agreement with the label values have been observed for the infant formula, dry milk powder, and oatmeal.
720006064, July 2017