• Application Note

UPLC-MS/MS Bioanalytical Quantification of Linaclotide from Plasma

UPLC-MS/MS Bioanalytical Quantification of Linaclotide from Plasma

  • Bhaskar K
  • Raghu T.
  • Taposh Gorella
  • Rajesh PMN
  • Padmakar Wagh
  • Waters Corporation

Abstract

This application highlights the development of a highly sensitive and robust LC-MS assay for the quantification of linaclotide extracted from plasma.

The method described herein achieves an LLOQ of 10.0 pg/mL with a linear dynamic range of 10–4000 pg/mL. The high sensitivity and linearity of method was attributed to extraction specificity using mixed-mode μElution SPE sample preparation, high-resolution UPLC chromatographic separation with the ACQUITY UPLC I-Class System using a sub-2-micron UPLC column, and sensitivity of the Xevo TQ-XS Mass Spectrometer. This developed method has demonstrated its fit-for-purpose use in support of drug discovery and research.

Benefits

  • Use of ACQUITY UPLC Columns for excellent resolution of linaclotide from endogenous interferences
  • Fast, simple, and selective sample preparation using Oasis MAX SPE
  • Linear, accurate, and precise quantitative performance
  • High analytical sensitivity detection, achieving 10.0 pg/mL, using the Xevo TQ-XS equipped with ESI ion source

Introduction

Peptide therapeutics represents an emerging class of drugs with great pharmacologic potential because of their high specificity, affinity, and molecular target recognition. Linaclotide (LINZESS), shown in Figure 1, is a novel, potent 14 amino acid (CCEYCCNPACTGCY) synthetic peptide containing three disulfide bonds (1–6, 2–10, 5–13) with a molecular weight of 1526.80. It is a guanylate cyclase-C (GC-C) agonist used for treating irritable bowel syndrome with constipation and chronic idiopathic constipation.1,2,3 Following oral dosing, linaclotide elicits its potent pharmacologic response locally in the gastrointestinal (GI) tract. It is minimally adsorbed with low systemic circulating plasma levels (<50 pg/mL).

Figure 1. Amino acid sequence of linaclotide with disulfide bonds.

Versus traditional small molecule therapeutics, peptides are often more difficult to analyze by LC-MS/MS, as MS sensitivity is low due to poor transfer into the gas phase and poor fragmentation. In the case of linaclotide, it has 14 chiral centers and exhibits stereoisomerism. Additionally, due to the presence of disulphide bonds, it is a cyclic peptide (Figure 2). Thus, achieving MS sensitivity and selectivity adds additional challenges, as the protonation sites are less accessible, and fragmentation is limited due to the presence of disulphide bonds. With its cyclic nature and low circulating levels developing a sensitive and robust LC-MS analytical method for linaclotide is quite challenging.

Figure 2. Cyclic structure of linaclotide.

In this work, a selective, sensitive, and robust quantification method has been developed for the accurate quantification of linaclotide in plasma. This method uses UPLC separation, tandem quadrupole MS with ESI (electrospray ionization), and selective mixed-mode solid-phase (SPE) extraction to achieve a lower limit of quantitation (LLOQ) of 10.0 pg/mL from 300 µL of plasma.

Experimental

Sample preparation

Standards and quality control (QC) samples were prepared by spiking linaclotide into commercially available human plasma at various concentrations (10–4000 pg/mL). Calibration curve standards were prepared in duplicate, while 6 replicates of each quality control (QC) level were prepared. For each of  the prepared samples, 300 µL of plasma sample was mixed with 200 µL of a 2 mm ammonium acetate solution containing 0.2% ammonium hydroxide. The pretreated plasma samples were extracted using the Waters Oasis MAX 96-well µElution plate. For this extraction, the entirety of the pretreated plasma samples was loaded onto the plate. Following sample loading, samples were washed with 200 µL of 5% Ammonium hydroxide in water, followed by 200 µL of methanol solution. Linaclotide was then eluted from the sorbent using 100 µL of the elution solvent (two aliquots of 50 µL). The extracted samples were then diluted with 100 µL water for a final sample volume of 200 µL and injected onto the LC-MS/MS system. This protocol is shown in Figure 3.

Figure 3. Oasis MAX 96-well µElution plate extraction protocol for linaclotide from human plasma samples.

LC conditions

LC system:

ACQUITY UPLC I-Class

Column:

ACQUITY HSS PFP 130Å, 1.7 μm, 2.1 mm × 100 mm

Column temp.:

42 °C

Sample temp.:

15 °C

Injection volume:

10 μL

Mobile phase A:

0.2% Formic acid in water

Mobile phase B:

0.2% Formic acid in acetonitrile

Purge and wash solvent:

200:10:10:10 Acetonitrile:Methanol:Isopropanol:Water with 0.1% formic acid

Table 1. LC gradient for linaclotide separation.

MS conditions

Mass spectrometer:

Xevo TQ-XS Tandem Quadrupole

Ionization:

ESI+

Capillary voltage:

3.5 kV

Source temp.:

150 °C

Desolvation temp.:

550 °C

Cone gas flow:

150 L/h

Desolvation gas flow:

1000 L/h

Collision cell pressure:

3.6 × e-3 mbar

Data management

Instrument control software:

MassLynx (v 4.2)

Quantification software:

TargetLynx

Results and Discussion

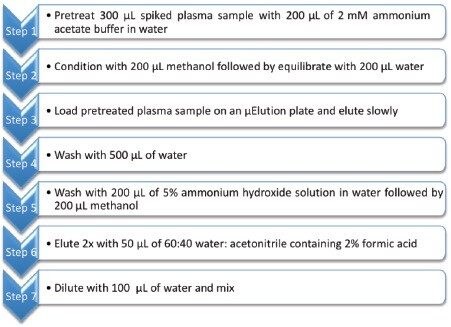
In this work, we have developed a complete sample preparation and UPLC LC-MS/MS method for sensitive and accurate quantification of linaclotide from plasma. SPE extraction of linaclotide from plasma was performed using the Oasis MAX, a mixed-mode sorbent in the 96-well µElution plate format, to enhance selectivity of the extraction. Oasis MAX is a polymeric ion exchange sorbent which relies on both reversed-phase and ion-exchange retention mechanisms to selectively separate linaclotide from other plasma matrix components.

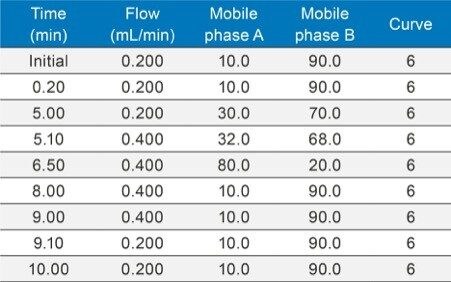
LC-MS/MS quantification was performed using a Waters Xevo TQ-XS Tandem/Triple Quadrupole MS coupled to an ACQUITY  UPLC I-Class System. Reversed phase chromatographic separation was achieved with an ACQUITY UPLC HSS PFP 1.8 µm Column, at an initial flow rate of 0.2 mL/min using a linear flow gradient (Table 1) with 0.2% formic acid in water and 0.2% formic acid in acetonitrile mobile phases here optimized and finalized saw tooth gradient to reduce the column carryover for this cyclic peptide. Linaclotide is a polar Basic compound. During initial method development, several reversed phase columns was evaluated for overall chromatographic performance. Best chromatographic performance for linaclotide (retention, peak shape, resolution from endogenous interferences, etc.) had achieved by using the HSS PFP column.

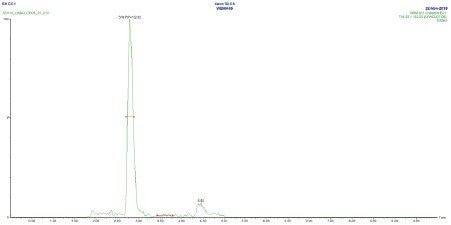
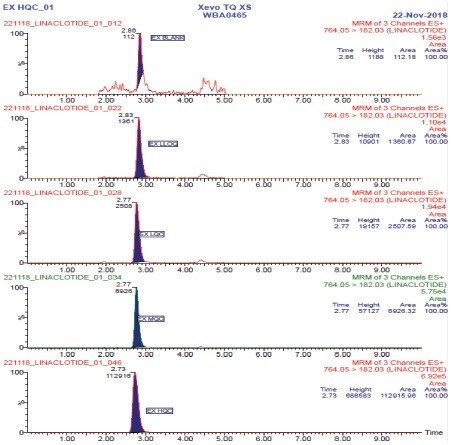
During MS optimization, several multiply charge precursors were observed. Of these, the 2+ (m/z 764) precursor was the most predominant species. The 764→182 MRM transition was used as the primary quantification transition. In this assay, the use of the specific y-ion 182 fragment, derived from the doubly charged precursor, combined with the mixed-mode SPE methodology significantly improved assay specificity. Optimized MS conditions used for linaclotide quantification are listed in Table 2.  

Table 2. MRM transitions, collision energies, and cone voltages for linaclotide.

The Xevo TQ-XS Mass Spectrometer, equipped with a novel step-wave ion guide and tool free ESI ion source, enabled improved  ion sampling in the source and better ion transfer efficiency, while use of the method events within the software to divert flow to waste, reduced system contamination. Use of a low dispersion UPLC I-Class System and sub-2-micron ACQUITY UPLC Column with reverse gradient mechanism, coupled to the Xevo TQ-XS Mass Spectrometer, afforded excellent resolution from endogenous matrix components, enhancing selectivity and sensitivity. This sensitivity and selectivity of this SPE LC-MS method is illustrated  in Figure 4 for the LLOQ, 10 pg/mL extracted plasma sample, achieving a signal to noise (S/N) ratio of 122.82.

Figure 4. Representative linaclotide LLOQ (10.0 pg/mL) chromatogram, extracted from plasma, demonstrating excellent sensitivity and selectivity with S/N ratio of 122.82.

Using this SPE LC-MS method, quantitative performance was excellent. Calibration curves were linear (r2>0.997) from 10–4000 pg/mL with accuracies between 85–115 % and CVs <15% for all points on the curve. Figure 5 illustrates this performance. At the same time, QC statistics easily met recommended bioanalytical method development guidelines,4 with average precision <8% and accuracy between 97–110%. This QC performance is highlighted in Table 3 for precision and accuracy (PA) batches,  while QC chromatographic performance is illustrated in Figure 6. 

Figure 5. Representative linaclotide calibration curve (10.0 to 4000 pg/mL) extracted from plasma.
Table 3. Summary of quality control results for linaclotide extracted from human plasma for P&A Batches 1 and 2.
Figure 6. Representative QC’s chromatograms for linaclotide extract from plasma, highlighting sensitivity and specificity.

Conclusion

This application highlights the development of a highly sensitive and robust LC-MS assay for the quantification of linaclotide extracted from plasma. The method described herein achieves an LLOQ of 10.0 pg/mL with a linear dynamic range of 10–4000 pg/mL. The high sensitivity and linearity of method was attributed to extraction specificity using mixed-mode µElution SPE sample preparation, high-resolution UPLC chromatographic separation with the ACQUITY UPLC I-Class System using a sub-2-micron UPLC column, and sensitivity of the Xevo TQ-XS Mass Spectrometer. This developed method has demonstrated its fit-for-purpose use in support of drug discovery and research.

References

  1. Robert W. Busby, Marco M. Kessler,  Wilmin P. Bartolini, Alexander P. Bryant, Gerhard Hannig, Carolyn S. Higgins, et al. Pharmacologic Properties, Metabolism, and Disposition of Linaclotide, a Novel Therapeutic Peptide Approved for the Treatment of Irritable Bowel Syndrome with Constipation and Chronic Idiopathic Constipation. J Pharmacol Exp Ther. 2013. Jan: 344(1): 196-206.
  2. Yi-Shen Zhu*, Tao Feng, Yong-Qin Diao, and Chun-Yan Tu, Zhu, et al. Analysis and Preparation of Linaclotide by High Performance Liquid Chromatography. J Anal Bioanal Tech. 2017. 8:3DOI: 10.4172/2155-9872.1000366.
  3. O’Neil MJ. The Merck Index an Encyclopedia of Chemicals, Drugs, and Biologicals. (2006) (14thedn), Merck & Co.Inc, 4244.
  4. Bioanalytical Method Validation: Guidance for Industry. May 2018. https://www.fda.gov/downloads/drugs/guidances/ucm070107.pdf.

720006544, April 2019

Back To Top Back To Top