SEC/GPC, DSC, and TGA Analysis of Low Molecular Weight Poly-L-lactic Acid

Abstract
The analysis of a poly lactic acid (PLA) polymer, Poly-L-lactic Acid (PLLA), using orthogonal analytical instruments such as advanced polymer chromatography (APC), differential scanning calorimetry (DSC), and thermal gravimetric analysis (TGA), can reveal polymer characteristics that provide insight into the manufacturing and processing of PLLA. The size exclusion chromatography (SEC) analysis, using APC, reveals the molecular weight distribution. A series of samples with varying molecular weights characterized by complimentary analysis techniques will illuminate the properties of the low molecular weight PLLA series. Thermal analysis techniques such as DSC and TGA reveal the melting, crystallization, and stability properties of the polymer, and lead to better understanding of the manufacturing and processing of the finished products and final product performance.
Benefits
ACQUITY APC:
- System compatibility with chloroform
- PLA analysis in a 10-minute isocratic run
- Robust and small particle columns for high speed/high resolution chromatography
TA Instruments DSC 2500:
- Tzero Technology yields superior baseline, transition resolution, and sensitivity
- Modulated DSC for separating thermodynamic and kinetic transitions, direct measurement of heat capacity
- Data reduction and experiment setup with intuitive TRIOS Software
TA Instruments TGA 5500:
- Outstanding accuracy, sensitivity, and reliability
- Hi-Res mode for increased resolution
- Modulated TGA for direct measurement of activation energy
Introduction
Replacement of petroleum based, non-renewable plastics with polymers from renewable sources has garnered great interest in the last few decades. Great advances have been made in developing ‘green’ polymers with properties comparable to more commonly used commodity plastics. Polylactic acid (PLA) is one of the more common examples of these materials. PLA offers many advantages including renewable source, biodegradability (under specific conditions), thermoplastic, and non-toxic. These advantages make PLA particularly attractive for contact use such as medical devices and food packaging. PLA is produced by two different polymerization pathways, direct polymerization via condensation or a ring opening polymerization of the lactide. A schematic of the polymerization processes appears in Figure 1.
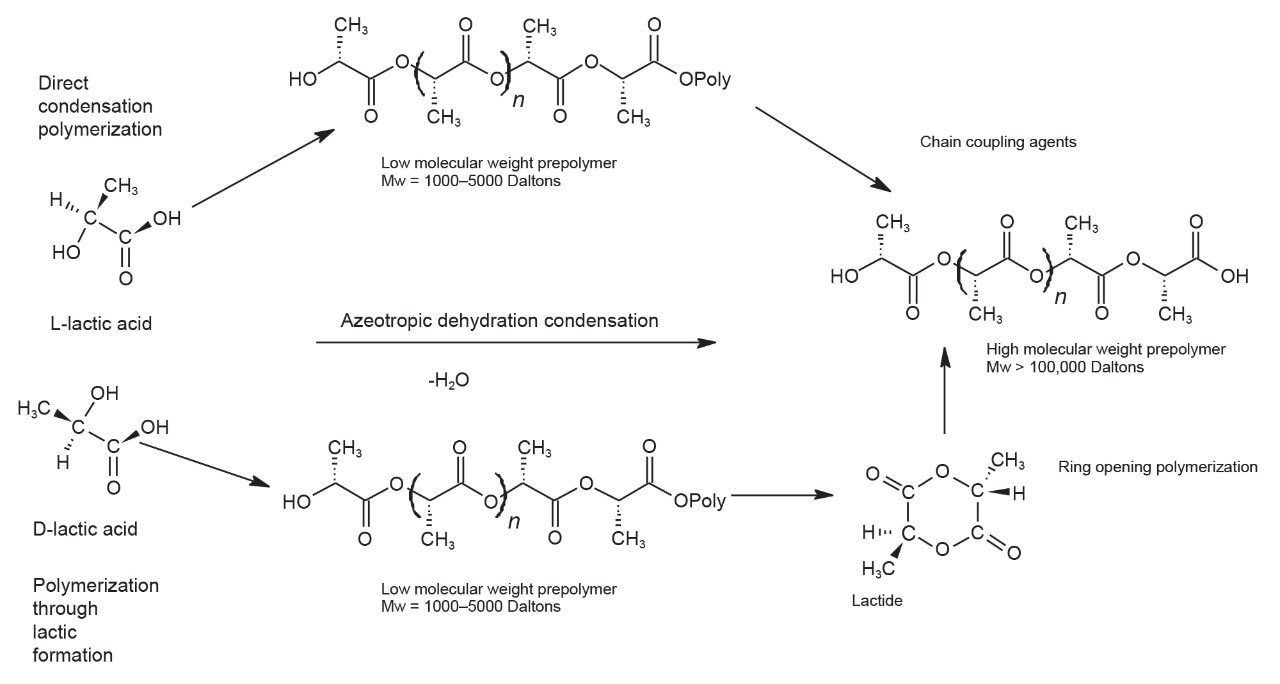 Figure 1. Polymerization Schematic for PLA.1
Characterization of the molecular weight, molecular weight distribution, thermal stability, melting point, glass transition, and crystallization behavior are critical parts of any polymer analysis as they correlate with processing, stability, and many end use performance aspects. In this work, we demonstrate the Waters ACQUITY Advanced Polymer Chromatography System, TA Instruments’ Discovery 2500 Differential Scanning Calorimeter, and Discovery 5500 Thermogravimetric Analyzer in characterizing four samples of poly-L-lactic acid.
Experimental
The focus of this document is SEC of PLA using APC, DSC, and TGA of PLA for thermal analysis. The combination of these polymer analysis techniques reveals the characteristics of a low molecular weight PLLA series which adds new understanding on how the polymer may perform during processing or in a finished product under environmental conditions.
Results and Discussion
Size Exclusion Results
APC
The APC analysis of a molecular weight series of PLLA samples was performed by making a 5 mg/mL stock solution in chloroform (stabilized with 0.75% ethanol) of each sample (Sigma Aldrich, St. Louis, MO) and syringe filtered (Table 1).
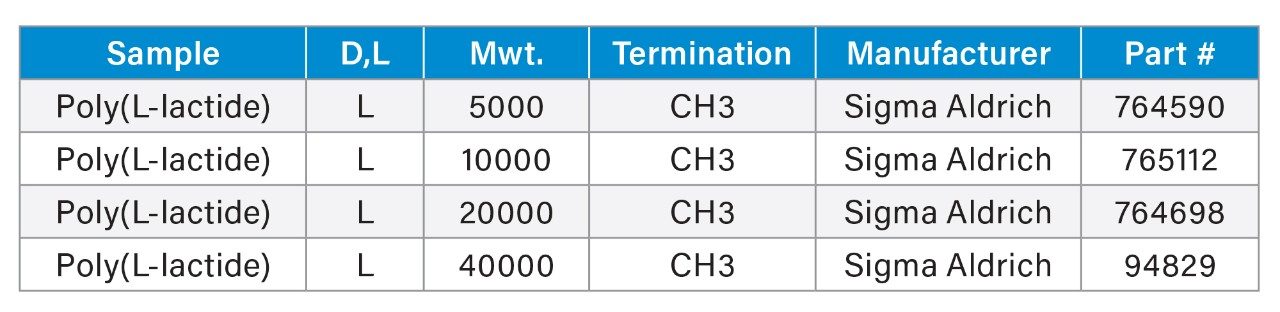 Table 1. PLLA samples used in this experiment.
This SEC experiment used a relative calibration curve with polystyrene calibration standards. The samples were injected using the APC Instrument Settings in Table 2, and a data processing method was created to process the collected data after the analysis was completed.
|
LC system: |
Advanced Polymer Chromatography (APC) with p-QSM Pump |
|
Detection: |
Refractive Index |
|
Detector temp.: |
40 °C |
|
Vials: |
2 mL |
|
Column(s): |
ACQUITY APC XT 4.6 x 150 mm 450 Å, 125 Å, 45 Å (550K–200 Da) |
|
Column temp.: |
40 °C |
|
Sample temp.: |
20 °C |
|
Injection volume: |
20 μL |
|
Flow rate: |
0.8 mL/min |
|
Run time: |
10 min |
|
Mobile phase: |
Chloroform stabilized with 0.75% ethanol |
|
Seal wash: |
Isopropanol |
|
Calibration type: |
Relative |
|
Calibration standards: |
Polystyrene Ready-Cal Kit |
|
Chromatography software: |
Empower 3 FR5 |
Table 2. LC conditions for the PLLA experiment.
When the PLLA chromatograms were compared with the calibration standards, the peak height of the PLLA was almost unseen compared to the standards due to the close value of sample refractive index and mobile phase (Figure 2). The PLLA samples are not ultraviolet (UV) active and will not be appropriate for a detector using UV. Therefore, the samples were run at a higher concentration (sample preparation and calibration details available in Additional Information).2
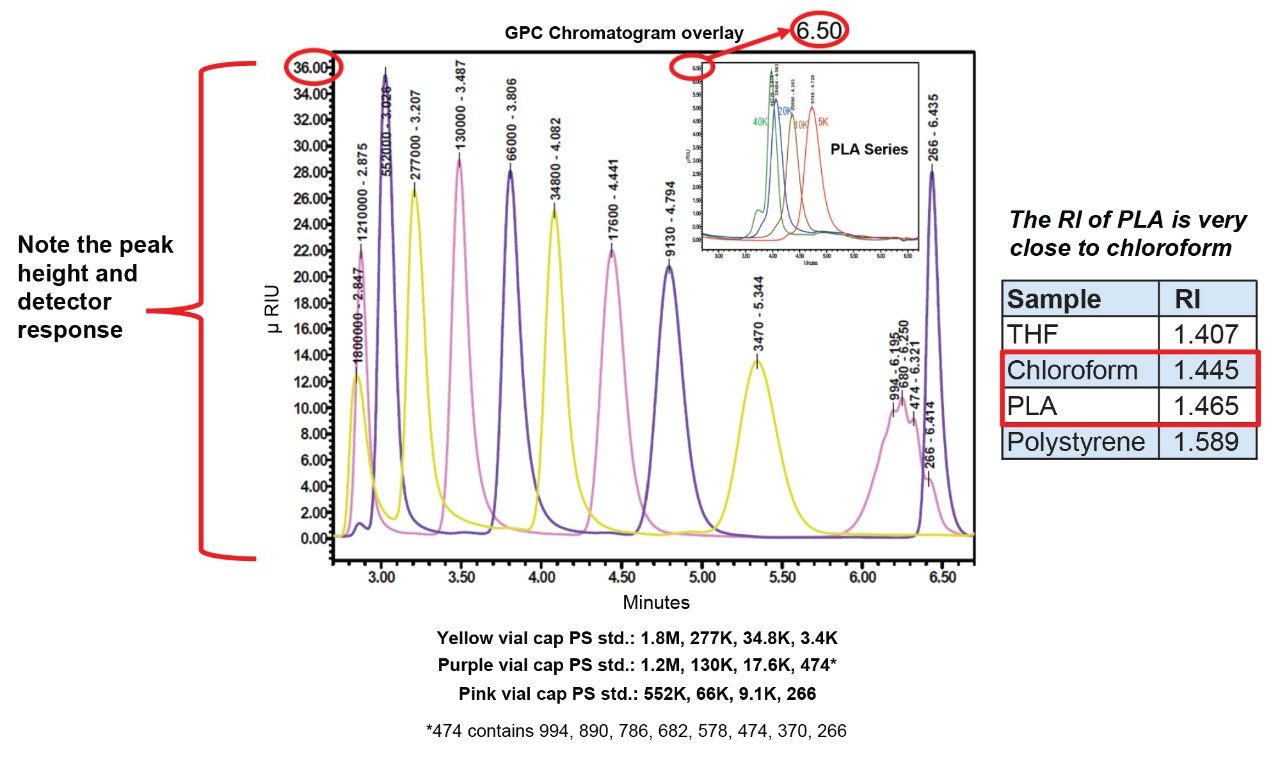 Figure 2. Example of polystyrene RI detector response in chloroform mobile phase and the corresponding refractive index table.
The elution time of the PLLA series in Figure 3 follows a predictable pattern of largest molecular weight to smallest. However, the 40 K Dalton sample has a small higher molecular weight peak that elutes before the larger peak, and there is a small flat peak of low molecular weight species at five minutes (Figure 4). These variances in molecular weight species, within one polymer sample, can contribute to the melt and cooling properties of a polymer.3
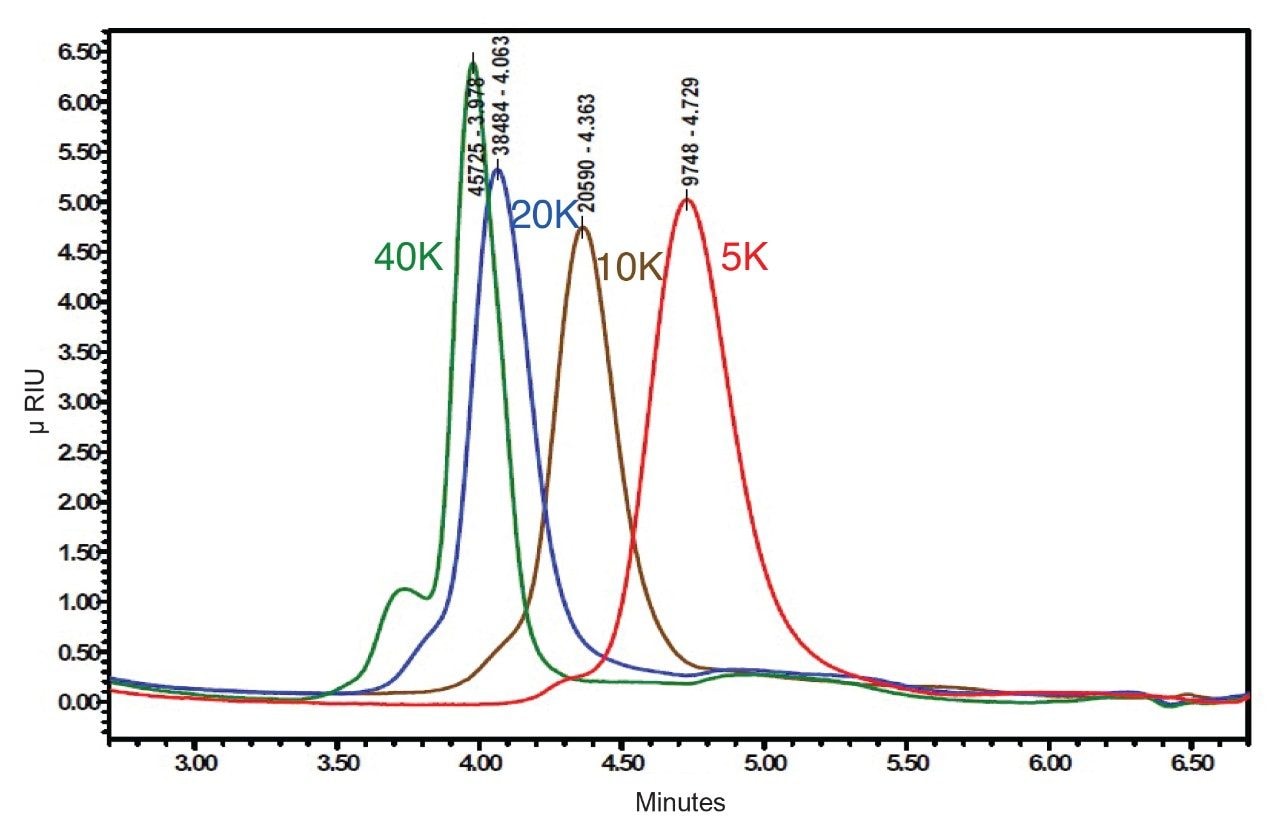 Figure 3. PLLA molecular weight series 5 K, 10 K, 20 K, and 40 K Daltons.
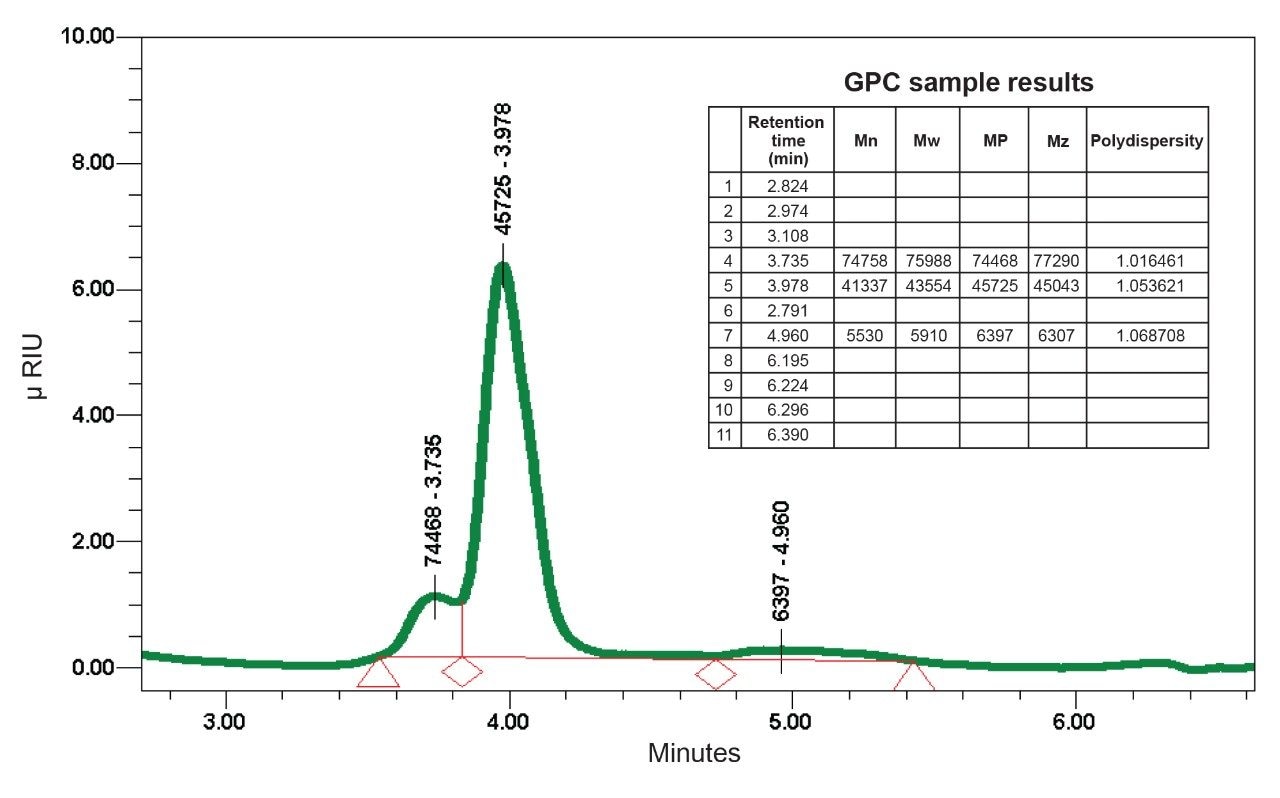 Figure 4. The 40 K Dalton PLLA sample molecular weight integration.
SEC can reveal low and high molecular weight regions that can add surprising results in a thermal analysis, especially when the peaks are below 15 K–20 K Daltons. There is a molecular weight at which a polymer begins to thermally behave consistently. This point of consistency is unique for PLLA, just as the behavior is unique to each type of polymer. The commonly accepted point of polymer consistent behavior is 15 K–20 K Daltons. An example is exhibited below from the Polymer Properties Database (Figure 5), and further examples are demonstrated in the thermal analysis section of this study.4
“Not only the average molecular weight but also its distribution has a noticeable effect on the physical, mechanical, and processing properties. In most cases, a narrow molecular weight distribution will yield better mechanical properties than a broad distribution because the low molecular weight portion will act as a plasticizer and soften the polymeric material, whereas an exceedingly high molecular weight portion will make processing of the polymer resin very difficult due to its disproportionately high contribution to the melt viscosity.”
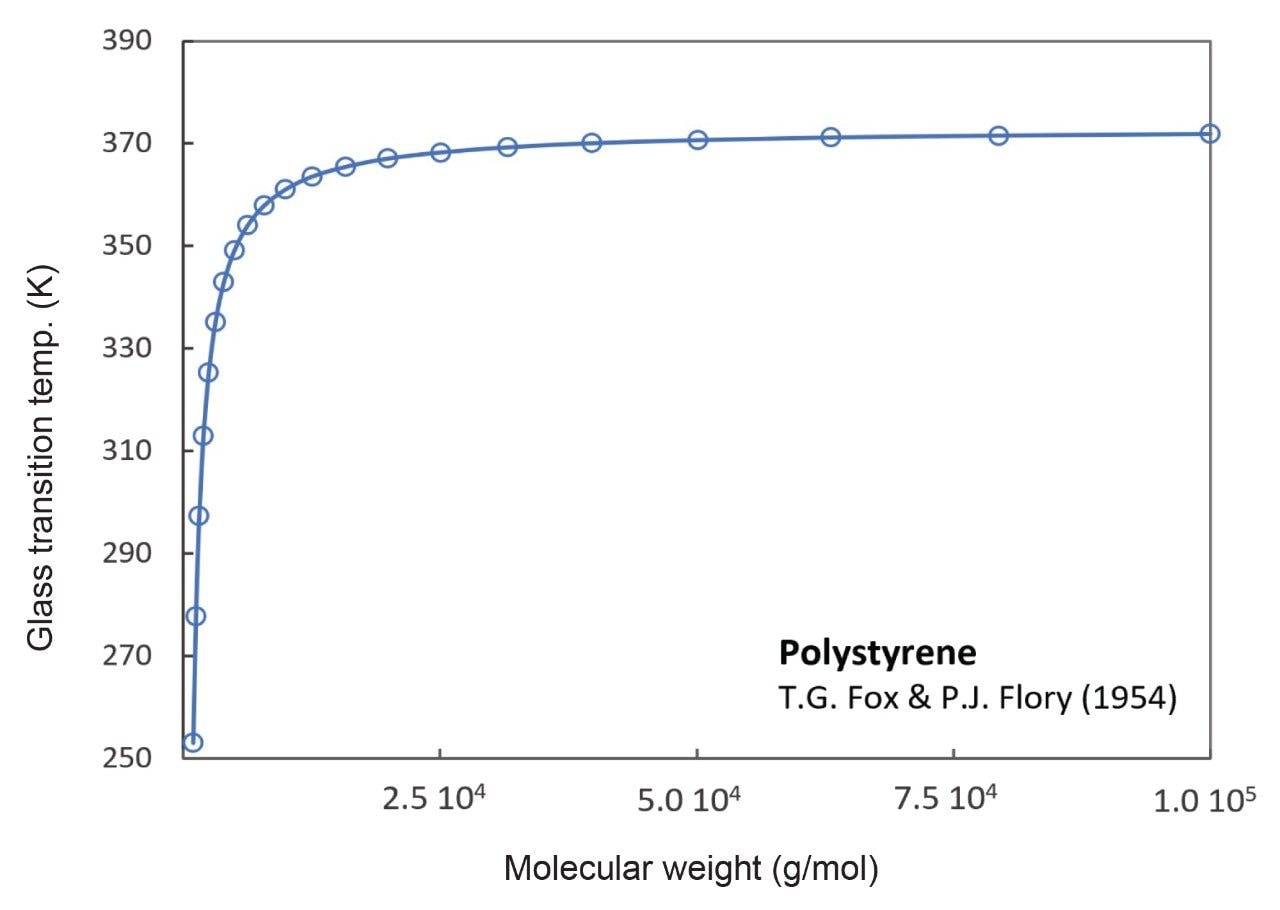 Figure 5. Example of polystyrene behavior affected by changes in molecular weight.
Thermal Analysis Results
|
Thermal analysis system: |
TA Instruments Discovery 5500 |
|
Sample container: |
100 microliter platinum pans |
|
Purge gas: |
Nitrogen |
|
Max temp.: |
800 °C |
|
Min temp.: |
23 °C |
|
Sample mass: |
4 mg nominal |
|
Heating rate: |
10 °C/min |
Table 3. TGA experimental conditions.
Figure 6 shows a comparison of the mass loss and rate of mass loss as a function of temperature at a heating rate of 10 °C/min in N2 using platinum crucibles. The TGA data indicates the sample stability low to high as 40 K<10 K<5 K< 20 K Daltons. Intuitively, we expect that the higher molecular weight species would be more stable indicating that for this sample set other structural characteristics are affecting stability. Some possible characteristics include tacticity or conformations that hinder or enable oxidative attack.
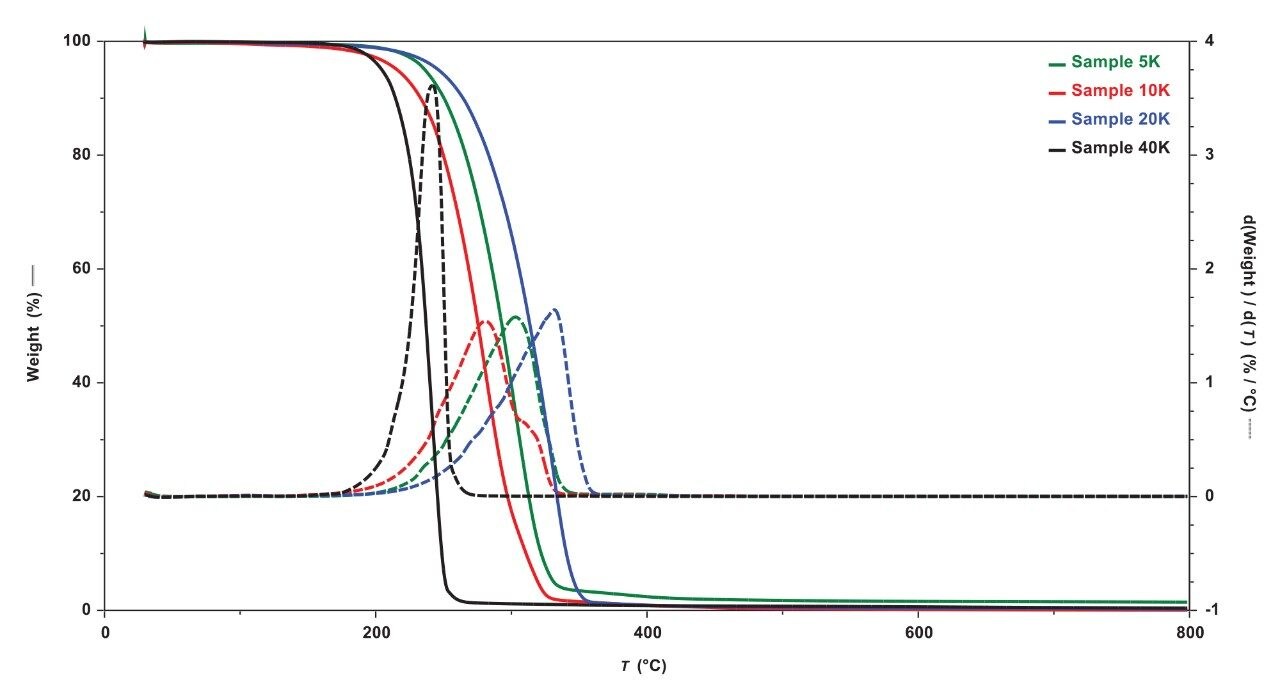 Figure 6. TGA results showing mass loss and rate of mass loss as function of temperature.
DSC
|
Thermal analysis system: |
TA Instruments DSC 2500 |
|
Sample container: |
Tzero Aluminum Pans |
|
Purge gas: |
Nitrogen |
|
Max temp.: |
190 °C |
|
Min temp.: |
-70 °C |
|
Sample mass: |
4 mg nominal |
|
Heating rate: |
10 °C/min |
|
Cooling rate: |
10 °C/min |
|
Experiment type: |
Heat, Cool, Heat |
Table 4. DSC experimental conditions.
The DSC experiment should be preceded by a TGA experiment to determine the decomposition temperature of the sample of interest. This temperature is often taken as the point where approximately 2% mass loss occurs. Because of the kinetic nature of decomposition, the TGA experiment should have the same parameters as the DSC experiment specifically sample mass, purge gas composition, heating rate, and sample form (film, powder, molded part, etc.). For our samples, the upper limit was determined to be 190 °C.
The equilibrium melting temperature (TM0) of PLLA is has been reported by Zhang and coworkers and Saiedlou and coworkers with values between 172 to approximately 200 °C depending on method of calculation.5, 6 We estimated the equilibrium melting temperature for sample 20 K which appears to be the most thermally stable as 185 °C using the Hoffman-Weeks Method.7 In previous work, we have demonstrated the importance of significantly heating above the equilibrium melting temperature to destroy all initial sample structure in the DSC experiment.8 This is especially important when evaluating crystallization. It is apparent that caution is needed with the PLLA samples as significant mass loss occurs at temperatures above the equilibrium melting temperature especially in samples 40 K and 10 K (Figure 6).
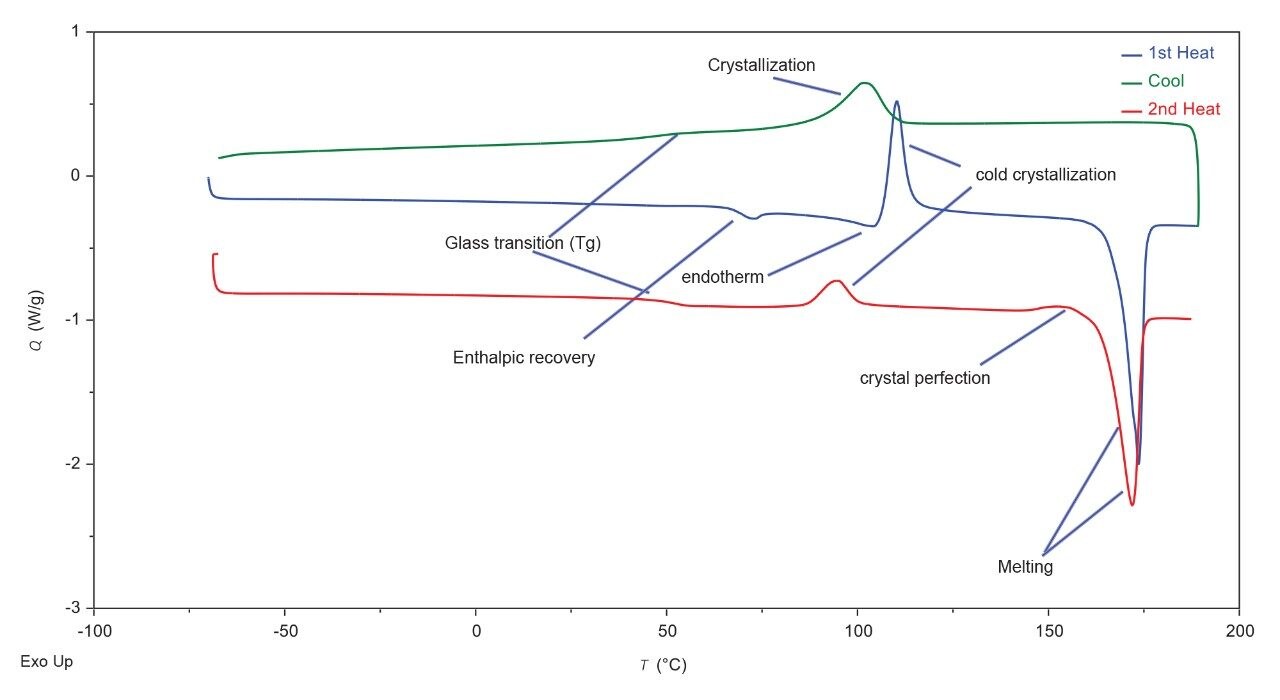 Figure 7. Sample 40 K with annotations.
Table 5 summarizes Heat – Cool – Heat DSC results for each of the samples. Figure 7 shows sample 40 K annotated with the transition terms referred to in Table 5. Overlays of DSC traces appear in Figures 8, 9, and 10. Sample 5 K shows the simplest thermal behavior, showing a glass transition, crystal perfection, and melting in the first heat; crystallization and glass transition during cooling, and crystal perfection followed by melting in the second heat. Samples 10 K, 20 K, and 40 K show more complex thermal behavior than sample 5 K showing the following transitions:
1st Heat
- Glass transition – in samples 20 K and 40 K, endotherm occurring at the glass transition is due to enthalpic recovery resulting from amorphous phase enthalpic relaxation.
- Endotherm occurs just before cold crystallization. This endotherm may be a melt transition for a metastable structure occurring simultaneously with the cold crystallization. Further experimental design is needed to characterize this endotherm.
- Cold crystallization
- Melting
Cooling
- Crystallization exotherm
- Glass transition
2nd Heat
- Glass transition – no indication of enthalpic recovery in either sample 20 K or 40 K
- Cold crystallization (endotherm observed before cold crystallization in 1st heat is absent)
- Crystal perfection
- Melting
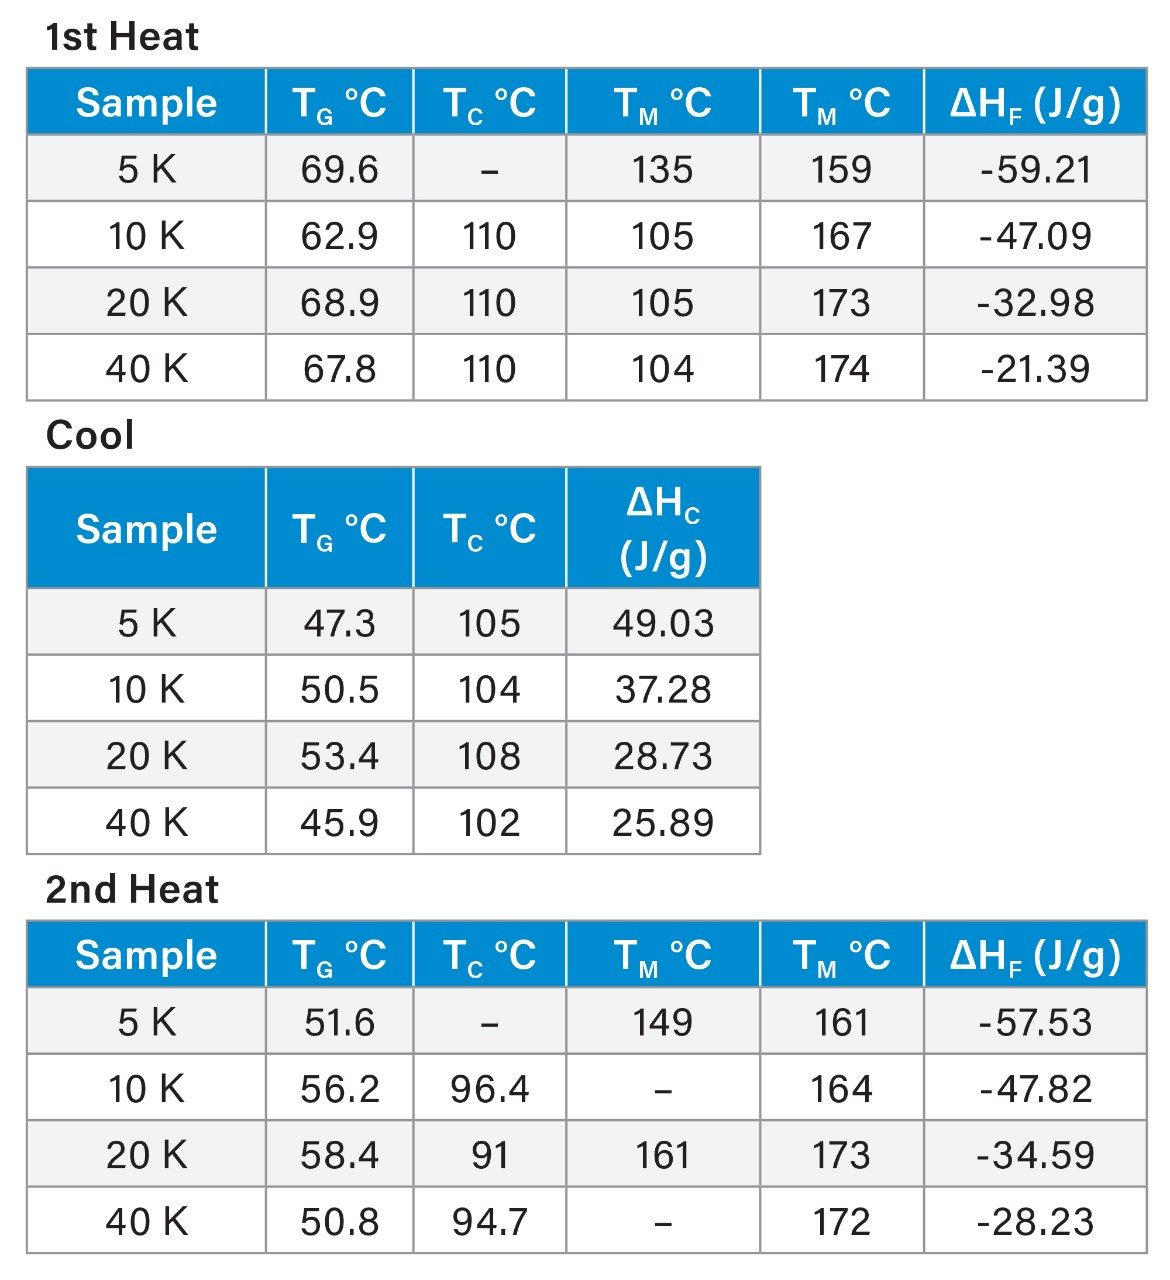 Table 5. Summary of DSC results for PLLA samples.
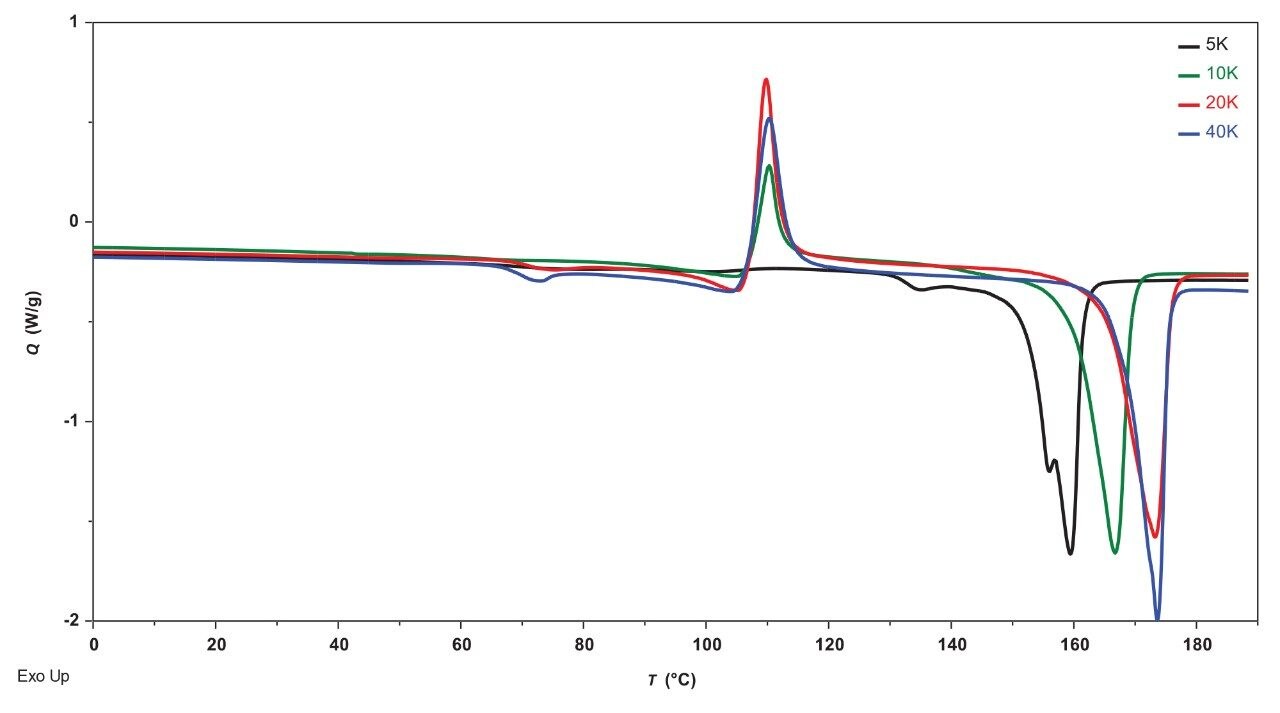 Figure 8. Overlay comparison of 1st heats of PLLA samples.
1st Heat Overlay – The overlay in Figure 8 compares the DSC 1st heat data showing that only sample 5 K does not cold crystallize. Melting points increase with molecular weight with samples 20 K and 40 K converging. Each of the samples show evidence of enthalpic recovery with samples 20 K and 40 K being most obvious.
- Cooling Overlay – Figure 9 shows a comparison of cooling data indicating potential differences in the crystallization kinetics that can be further evaluated.
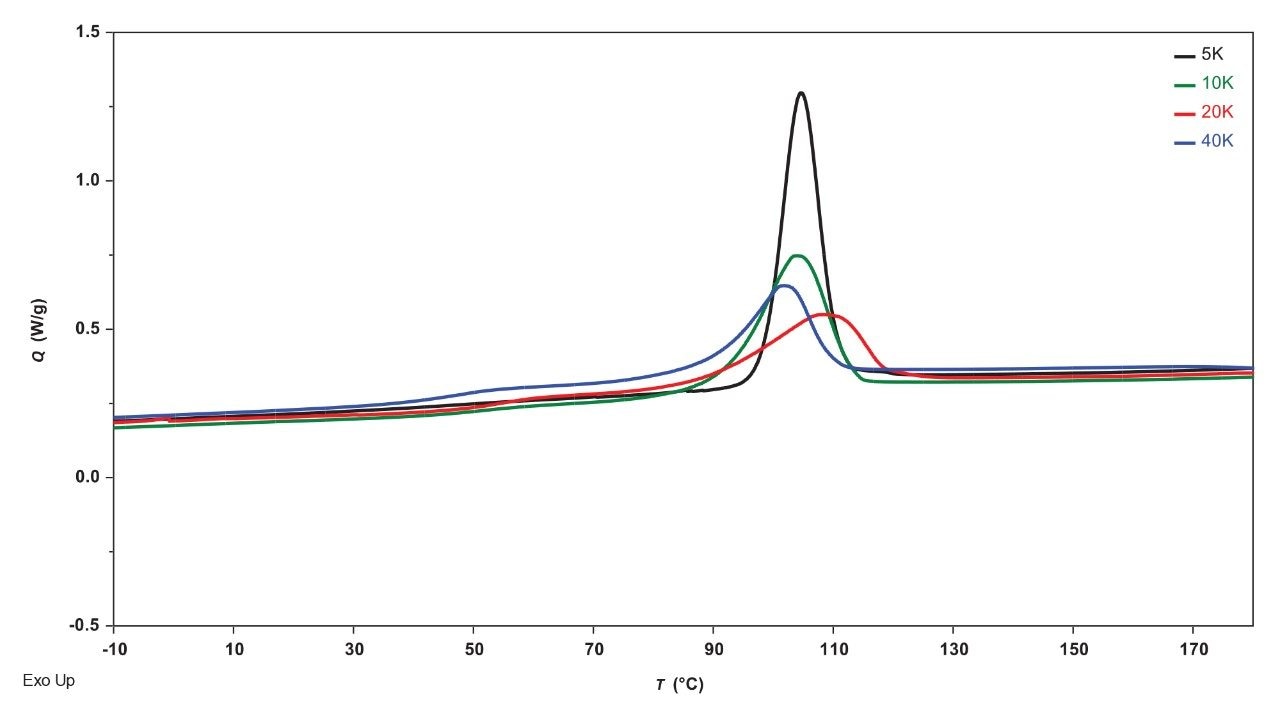 Figure 9. Overlay comparison of cools of PLLA samples.
2nd Heat Overlay – Figure 10 compares the 2nd heat DSC data. Sample 5 K shows no evidence of cold crystallization but each of the other samples do show cold crystallization in addition to crystallization from the melt. This may indicate that complete crystallization does not occur or the crystal structure that forms is metastable at the chosen cooling rate (10 °C/min). More information can be obtained with follow-up experiments. Each of the samples also show some crystal perfection before melting.
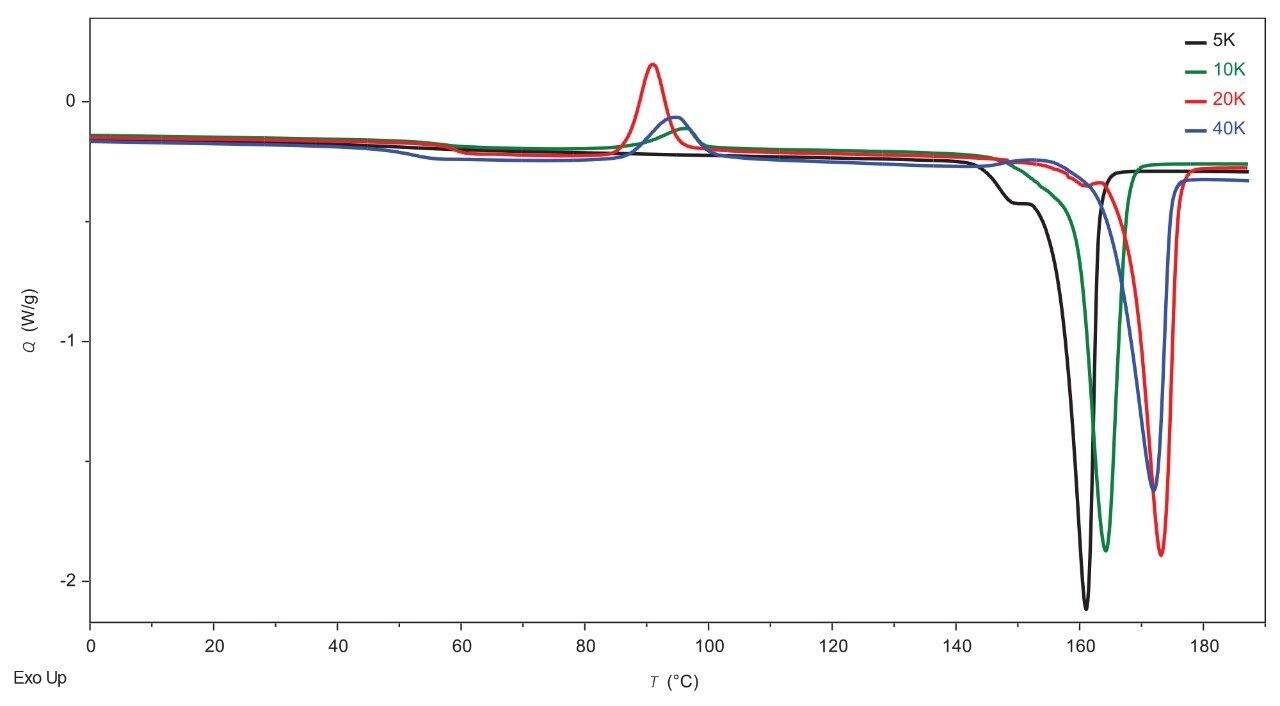 Figure 10. Overlay comparison of 2nd heats of PLLA samples.
Glass Transition Temperature
Figure 11 compares the glass transition temperatures as function of molecular weight. The first heat samples were obtained as neat samples from the bottles, so they contain all the aging effects that occurred after polymerization. The glass transition temperatures are similar for samples 5 K, 20 K, and 40 K, but lower for sample 10 K which may imply that this sample underwent less aging. There are significant differences in the glass transition temperature between the 1st heat and 2nd heat which is due to aging effects notably enthalpic relaxation. This is an important characteristic as the higher glass transition is correlated with increased modulus and brittle fracture. The glass transition temperature in the cool and second heat increases with molecular weight for samples 5 K, 10 K, and 20 K but shows a decrease in sample 40 K. This may be explained by plasticization due to the low molecular weight fraction observed in the APC experimental data presented in Figure 4.
 Figure 11. Comparison of glass transition temperatures as function of molecular weight.
The change in heat capacity during the glass transition is proportional to the amount of amorphous phase present. Table 6 below summarizes the change in relative heat capacity which is also plotted in Figure 12. Larger changes in heat capacity are observed with increasing molecular weight with the data showing apparent convergence. The enthalpy value for the glass transition in the second heat increases linearly as a function of molecular weight and is shown in the last column.9
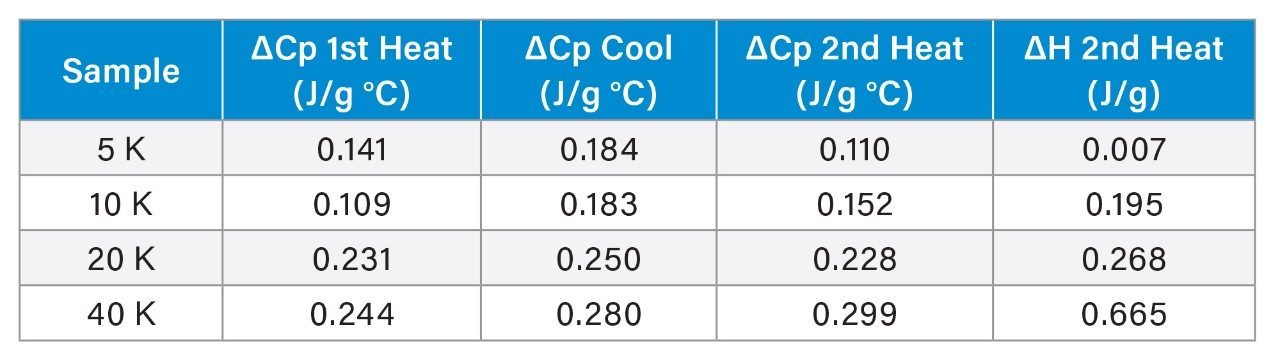 Table 6. Heat capacity change through glass transitions.
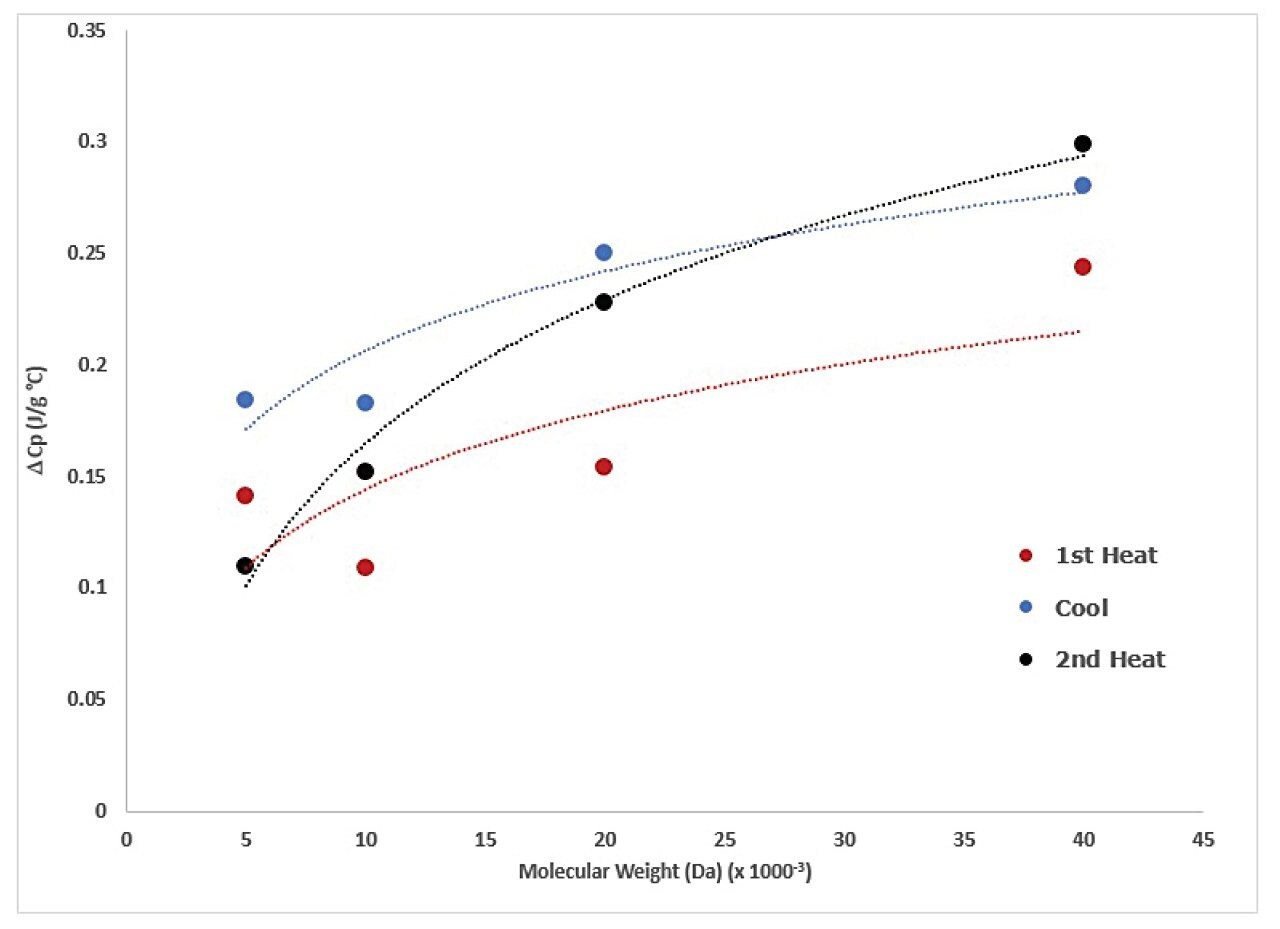 Figure 12. Change in heat capacity at glass transition as function of molecular weight.
Enthalpic Recovery
Samples show different levels of enthalpic recovery indicated by an endotherm at the glass transition. Enthalpic recovery is the result of enthalpic relaxation which in simple terms is the process of the amorphous phase releasing energy as it approaches equilibrium after cooling to a nonequilibrium state below the glass transition. The first heat of the samples with no added thermal history is shown in Figure 13. For this sample set, the extent of enthalpic relaxation/recovery correlates with molecular weight most apparent in sample 40 K.
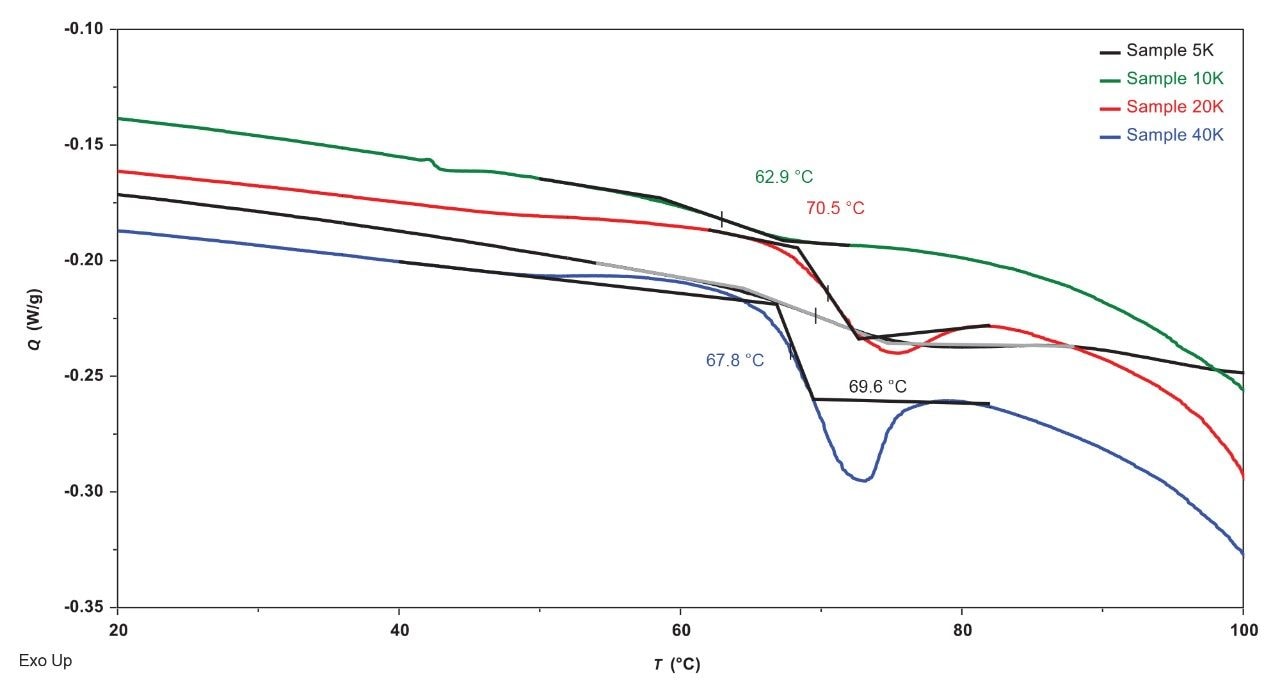 Figure 13. 1st Heat comparison of PLLA samples showing enthalpic recovery.
Figure 14 shows a comparison of the samples glass transition in the second heat after controlled heating and cooling with virtually no enthalpic recovery observed.
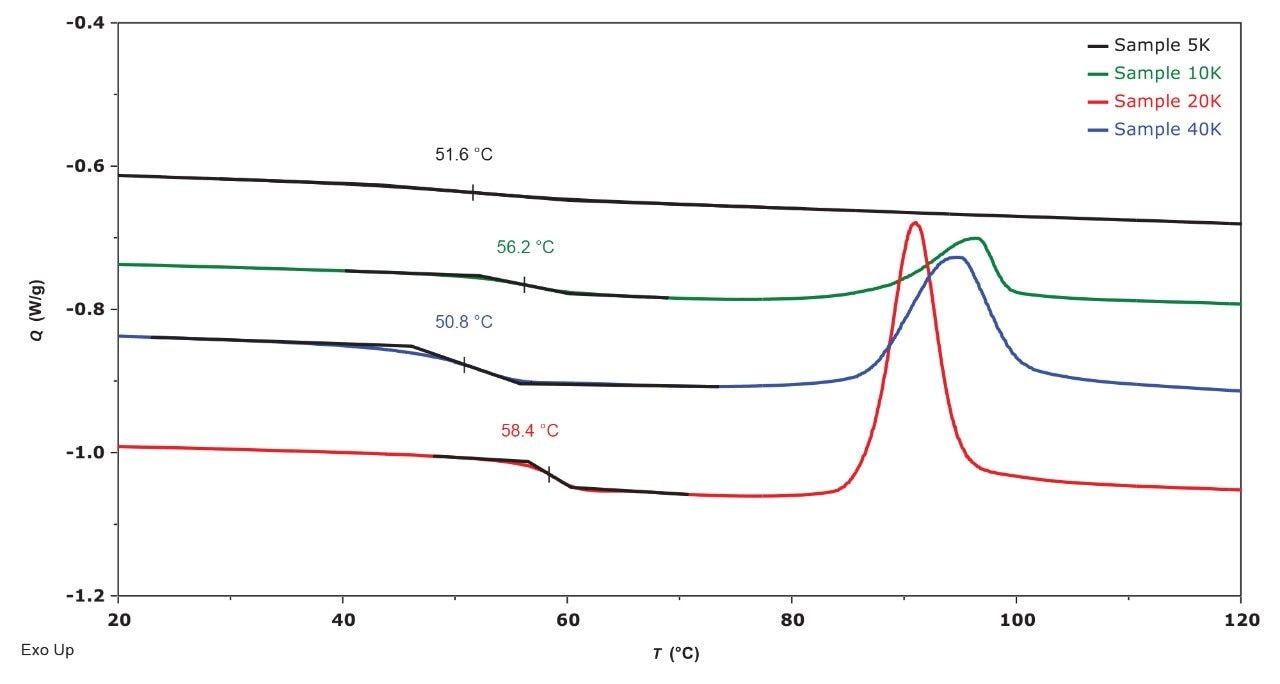 Figure 14. 2nd Heat comparison of PLLA samples.
A comparison of the first and second heats of sample 40 K which shows the most prominent first heat enthalpic recovery is shown in Figure 15.
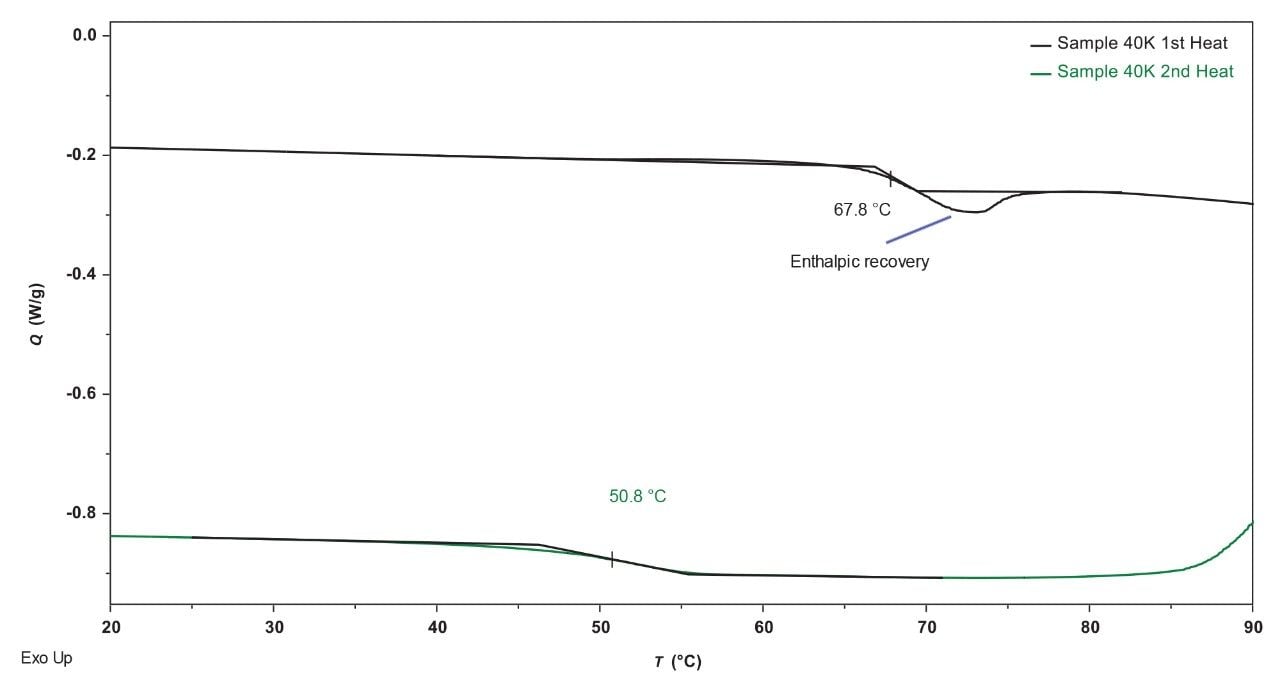 Figure 15. Comparison of glass transitions in 1st and 2nd heats of sample 40 K.
The energy associated with enthalpic recovery can be calculated using the method described by Yue9 or by modulated DSC (MDSC) which effectively separates the heat flow of the enthalpic recovery from the glass transition.10
Data Management
|
Chromatography software: |
Empower 3 FR5 |
|
Thermal analysis software: |
TRIOS 5.5 |
Conclusion
Using a combination of analysis techniques for the analysis of PLLA, such as SEC, DSC, and TGA can reveal polymer characteristics that give insight into the manufacturing and processing of PLLA. The SEC analysis technique is very important in understanding the molecular weight distribution, and APC provides the molecular weight data for each injection in this experiment in 10 minutes, with a calibration curve provided in 30 minutes. Relative stability was determined by TGA and the results indicate the need to understand the effect of other structural characteristics on the stability of the polymer. DSC shows complex thermal transitions including crystallization from the melt and cold crystallization in 3 of the 4 samples. Each of the samples also shows enthalpic recovery due to enthalpic relaxation (aging) which potentially can be mitigated with process control.
The analysis reveals an unusual distribution of the 40 KDa sample of 3 separate peaks. The 75 KDa and 6 KDa peaks can affect the melting and crystallization properties of the polymer, and these effects can potentially manifest in final product performance. The potential effect of the 75 KDa fraction on crystallization can be evaluated by either isothermal or non-isothermal kinetics methods. The effect of the 6 KDa fraction is apparent in plasticization of the sample resulting in the observed lower glass transition temperature and by implication lower modulus.
Opportunities for further study include:
- Evaluation of metastable crystalline forms
- Crystallization kinetics of the crystalline forms
- Evaluation of kinetics of enthalpic relaxation
Additional Information
SEC Sample Preparation and Calibration
The samples were left in the fume hood overnight to dissolve (Table 1). Once the dissolution was complete, each stock solution was filtered through a 13 mm, 0.2 µm syringe filter into a clean 20 mL scintillation vial with a polyethylene cone insert cap. The filtered samples were added to each corresponding labeled 2 mL APC sample vial and diluted to 1 mg/mL concentration with the ethanol stabilized chloroform.
The three polystyrene Ready-Cal Calibration Standard Vials, yellow cap, purple cap, and pink cap (1.8 Million to 200 Dalton), were diluted with 1.5 mL of ethanol stabilized chloroform and left in the fume hood overnight to dissolve. All APC sample vials were contained in the APC vial rack, and all the stock solutions were stored in a 5 °C refrigerator after final dilution.
Once the calibration standards analysis was completed, a data processing method was created to analyze the data. The given peak molecular weight values for each peak were entered into the sample table for each corresponding retention time.
The experiment was repeated with 5 mg/mL PLLA samples and the standards were left at 1 mg/mL. The PLLA molecular weight series was processed using the relative calibration curve from the polystyrene standards, and the two highest molecular weight peaks were excluded due to the seprartion range, 550 Kilo(K)–200 Daltons, of the column bank. The resulting chromatograms are displayed in Additional Figure 1.
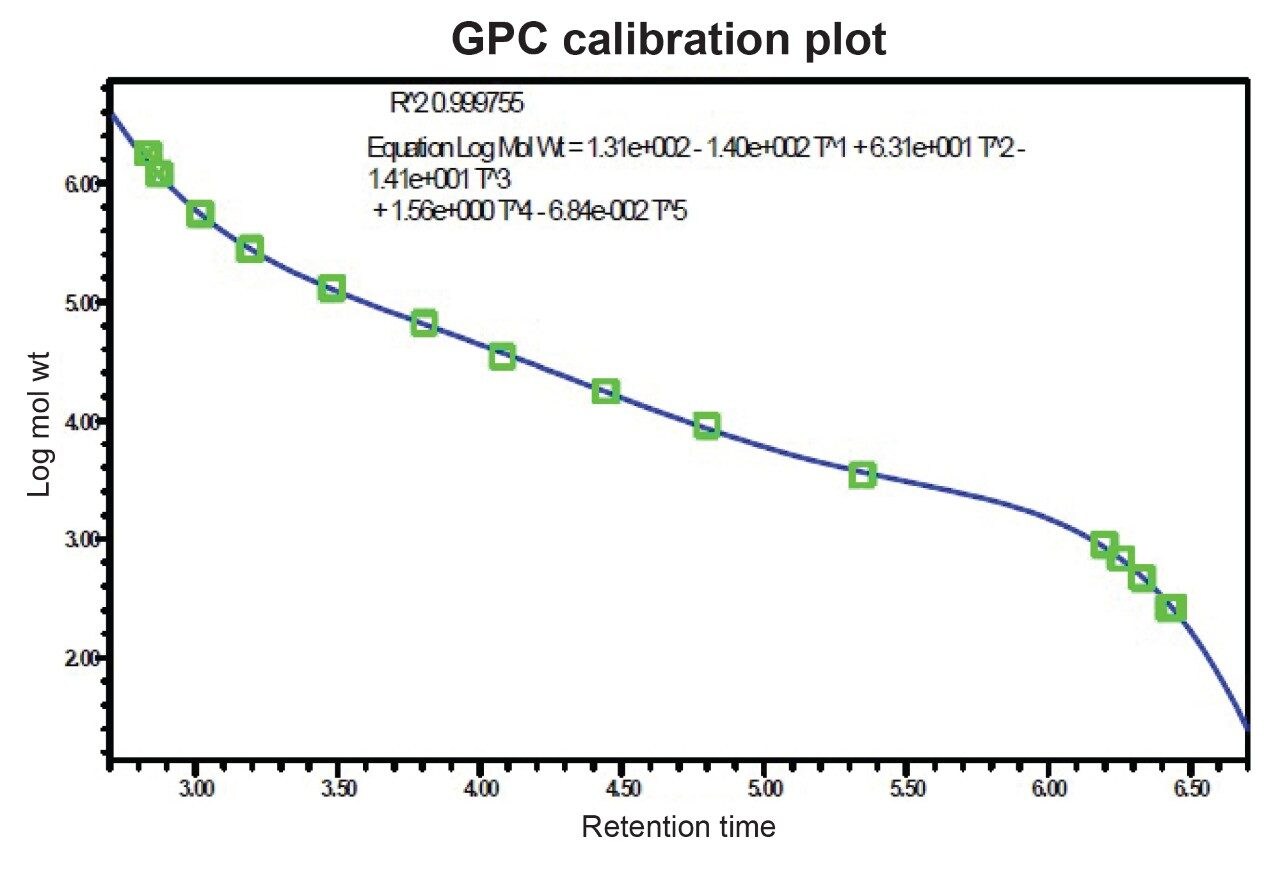
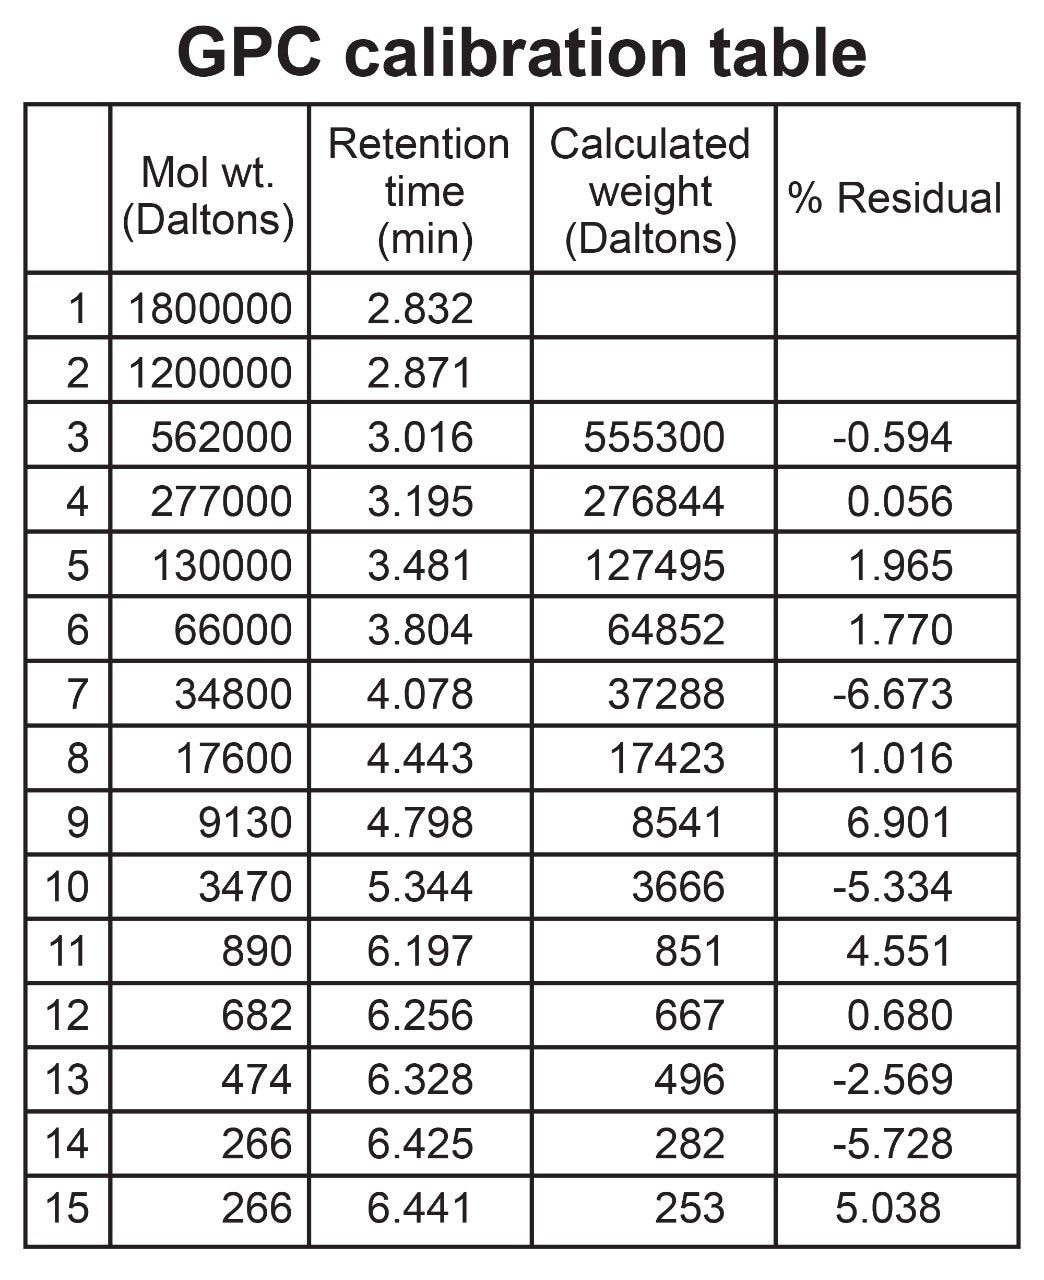 Additional Figure 1. Calibration curves for polystyrene standards.
References
Size Exclusion Analysis
1. Rafael Auras, Bruce Harte, Susan Selke, An Overview of Polylactides as Packaging Materials, Macromol. Biosci. 2004, 4, 835–864.
2. Serban C. Moldoveanu, Victor David, Chapter 13 - Solvents, Buffers, and Additives Used in the Mobile Phase, Editor(s): Serban C. Moldoveanu, Victor David, Selection of the HPLC Method in Chemical Analysis, Elsevier, 2017, Pages 393–450, ISBN 9780128036846, https://doi.org/10.1016/B978-0-12-803684-6.00013-5.
3. A.A. Cuadri, J.E. Martín-Alfonso, Thermal, Thermo-Oxidative and Thermomechanical Degradation of PLA: A Comparative Study Based on Rheological, Chemical, and Thermal Properties, Polymer Degradation and Stability, Volume 150, 2018, Pages 37–45, ISSN 0141-3910, https://doi.org/10.1016/j.polymdegradstab.2018.02.011.
4. Polymer Properties Database, 2015–2021, https://polymerdatabase.com/home.html.
Thermal Analysis
5. Ri-Chao Zhang, Dan Sun, Ai Lu, Meiling Zhong, Guangyao Xiong, Yizao Wan; Polymers 2017, 9, 625; doi:10.3390/polym9110625.
6. Sajjad Saeidlou, Michel A. Huneaulta, Hongbo Li, Chul B. Park; Poly(lactic acid) Crystallization; Progress in Polymer Science 37 (2012) 1657–1677.
7. Hoffman J., Weeks J.; Melting Process and the Equilibrium Melting Temperature of Polychlorotrifluoroethylene; Journal of Research of the National Bureau of Standards-A. Physics and Chemistry, Vol. 66A, No. 1, January-February 1962.
Acknowledgements
Ben MacCreath, Claudia Lohmann
720007344, August 2021