Low Level Quantification of Six Vitamin D Metabolites By UPLC-MS/MS For Clinical Research
For research use only. Not for use in diagnostic procedures.
Abstract
This application note demonstrates a clinical research method that has been developed for the analysis of six vitamin D metabolites in serum with good analytical sensitivity. Using only 200 μL of serum, this method was able to quantify 1,25diOHD3 at 5 pg/mL and can distinguish between a blank stripped serum sample and the same matrix spiked with 1.25 pg/mL of 1,25diOHD3, with a relatively simple sample extraction procedure.
Benefits
- Simplified protein precipitation and SPE sample extraction procedure, utilizing PTAD derivatization
- Excellent analytical sensitivity, enables differentiation between a blank sample and 1.25 pg/mL of 1,25-dihydroxyvitamin D3 in stripped serum
- Only 200 µL of sample required
Introduction
While the role of vitamin D in bone metabolism is well established, comparatively little is known about its role in other diseases, although recent research suggests possible links between vitamin D deficiency and a variety of diseases. Liquid chromatography-mass Spectrometry (LC-MS) can provide the required analytical sensitivity and selectivity, and the capability of multi-analyte quantitative detection in a single run. However, methods that have been described often feature a complex workflow with evaporation steps or mobile phase additives that may make it difficult to use the system for other research studies.
Therefore, a semi-automated clinical research method for the extraction and analysis of six vitamin D metabolites from human serum has been developed. Chromatographic separation of extracted samples was achieved with a Waters™ ACQUITY™ UPLC™ I-Class using a CORTECS™ Phenyl Column followed by mass detection using a Xevo™ TQ-XS Tandem Quadrupole Mass Spectrometer (Figure 1). This system provided the required analytically sensitivity. A Hamilton STAR Liquid Handling Robot was used to automate and simplify the extraction workflow, allowing for sample tracking from the primary tube to processed results.
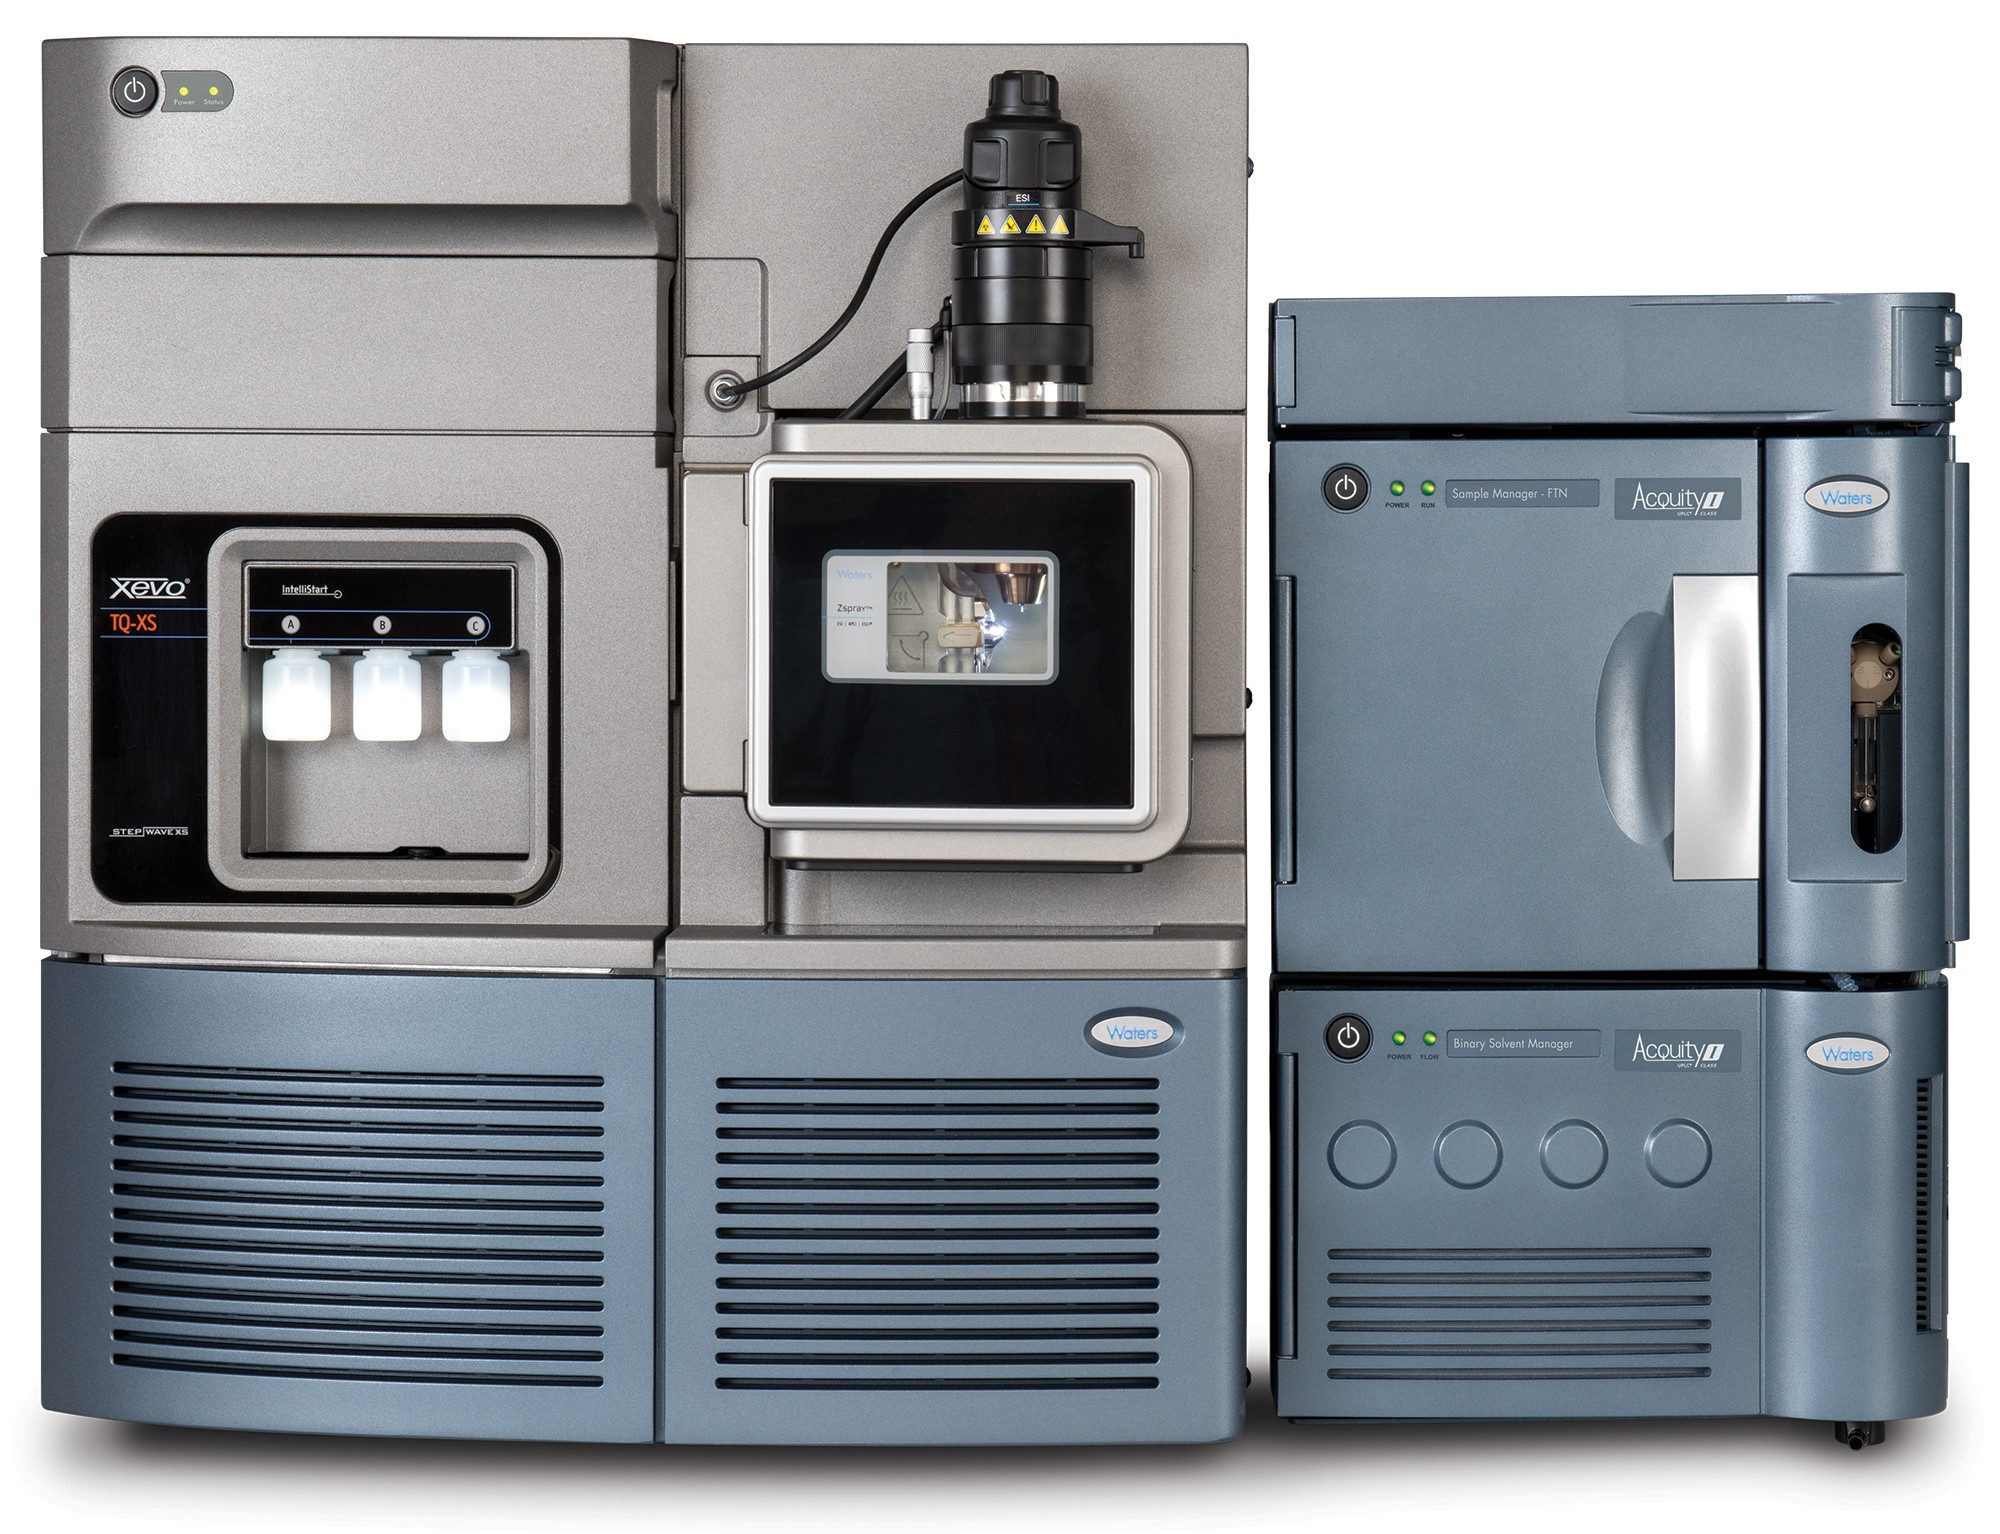 Figure 1. The Waters ACQUITY UPLC I-Class and Xevo TQ-XS mass spectrometer.
Experimental
UPLC Conditions
|
System: |
ACQUITY UPLC I-Class (FTN) with Column Manager |
|
Needle: |
30 µL |
|
Column: |
CORTECS Phenyl 2.1 x 100 mm, 1.6 µm (p/n: 186008381) |
|
Mobile phase A: |
LC-MS Grade Water + Ammonium Fluoride |
|
Mobile phase B: |
LC-MS Grade Methanol/Acetonitrile + Ammonium Fluoride |
|
Needle wash solvent: |
LC-MS Grade Methanol/Acetonitrile/ LC-MS Grade Water/2-Propanol + Formic Acid |
|
Purge solvent: |
LC-MS Grade Methanol/LC-MS Grade Water |
|
Column temp.: |
40 °C |
|
Injection volume: |
25 µL |
|
Gradient: |
See Table 1 |
|
Run time: |
9.5 minutes |
Method Conditions
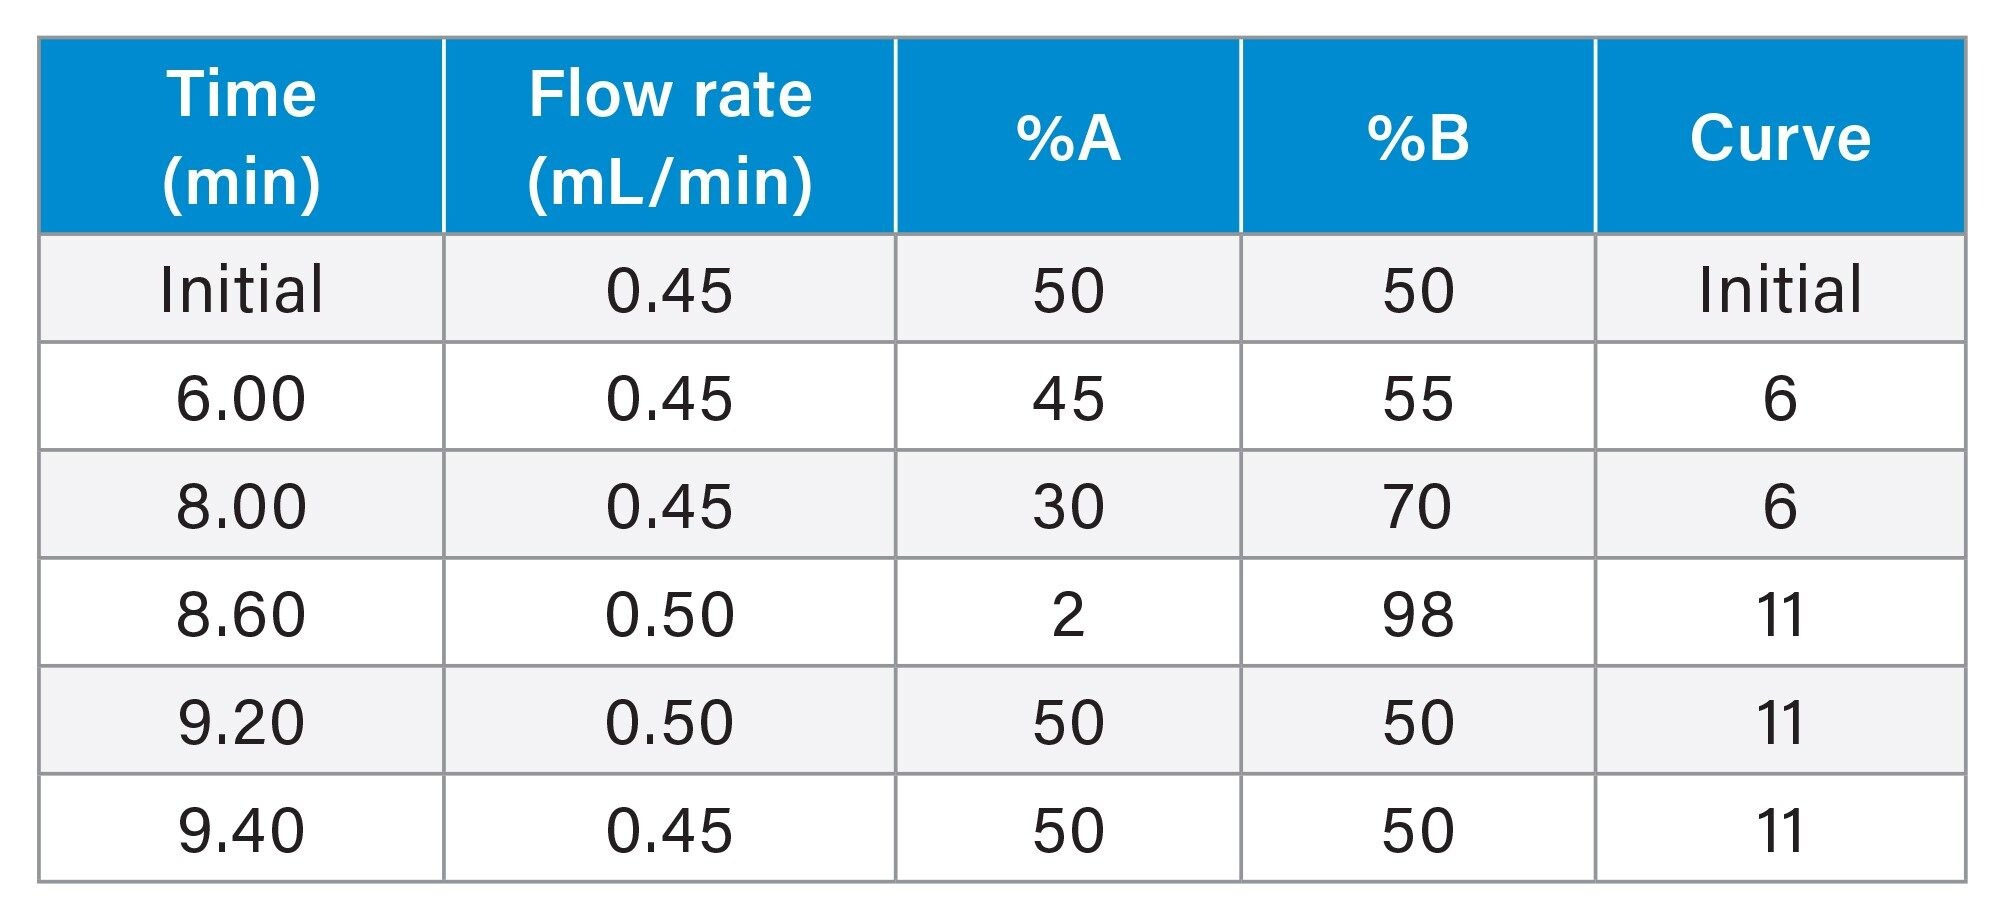 Table 1. Gradient table for the separation of the vitamin D metabolites.
MS Conditions
|
System: |
Xevo TQ-XS |
|
Resolution: |
MS1 (0.7 FWHM) MS2 (0.7 FWHM) |
|
Acquisition mode: |
Multiple Reaction Monitoring (MRM) (see Table 2 for details) |
|
Polarity: |
ESI positive |
|
Capillary: |
3.0 kV |
|
Source temp.: |
150 °C |
|
Desolvation temp.: |
600 °C |
![Table 2. MRM parameters of vitamin D metabolites quantifier ions, qualifier ions (in brackets) and their internal standards (* dihydroxyvitamin D2 metabolites were monitored but not quantified) C3-epi-25OHD3 and C3-epi-25OHD2 have the same MRM parameters as 25OHD3 and 25OHD2 respectively C3-epi-25OHD3 used it's own labelled [2H3]-C3-epi-25OHD3 internal standard and C3-epi-25OHD2 used the [2H3]-25OHD2 internal standard.](/content/dam/waters/en/app-notes/2022/720007589/720007589en-t2.jpg.82.resize/img.jpg)
Table 2. MRM parameters of vitamin D metabolites quantifier ions, qualifier ions (in brackets) and their internal standards (* dihydroxyvitamin D2 metabolites were monitored but not quantified)
C3-epi-25OHD3 and C3-epi-25OHD2 have the same MRM parameters as 25OHD3 and 25OHD2 respectively
C3-epi-25OHD3 used it's own labelled [2H3]-C3-epi-25OHD3 internal standard and C3-epi-25OHD2 used the [2H3]-25OHD2 internal standard.
Data Management
MassLynx v4.2 with TargetLynx XS application manager
Sample Preparation
25-hydroxyvitamin D2 (25OHD2), 25-hydroxyvitamin D3 (25OHD3), C3-epi-25-hydroxyvitamin D2 (C3-epi-25OHD2), C3-epi-25-hydroxyvitamin D3 (C3-epi-25OHD3), 24,25-dihydroxyvitamin D3 (24,25diOHD3), 1,25-dihydroxyvitamin D2 (1,25diOHD2), and 1,25-dihydroxyvitamin D3 (1,25diOHD3) certified reference solutions were purchased from Merck Life Sciences (Gillingham, UK). 24,25-dihydroxyvitamin D2 (24,25diOHD2) certified reference solution and [2H3]-25OHD2, [2H3]-25OHD3, [2H3]-C3-epi-25OHD3, [2H6]-24,25diOHD3, and [2H3]-1,25diOHD3 certified labelled internal standard solutions were purchased from IsoSciences (Ambler, PA).
Calibrators and QC’s were prepared in a surrogate matrix of MSG2000 stripped serum purchased from Golden West Biologicals (Temecula, CA) across the following concentration ranges (Table 3), with the QC concentrations shown in brackets.
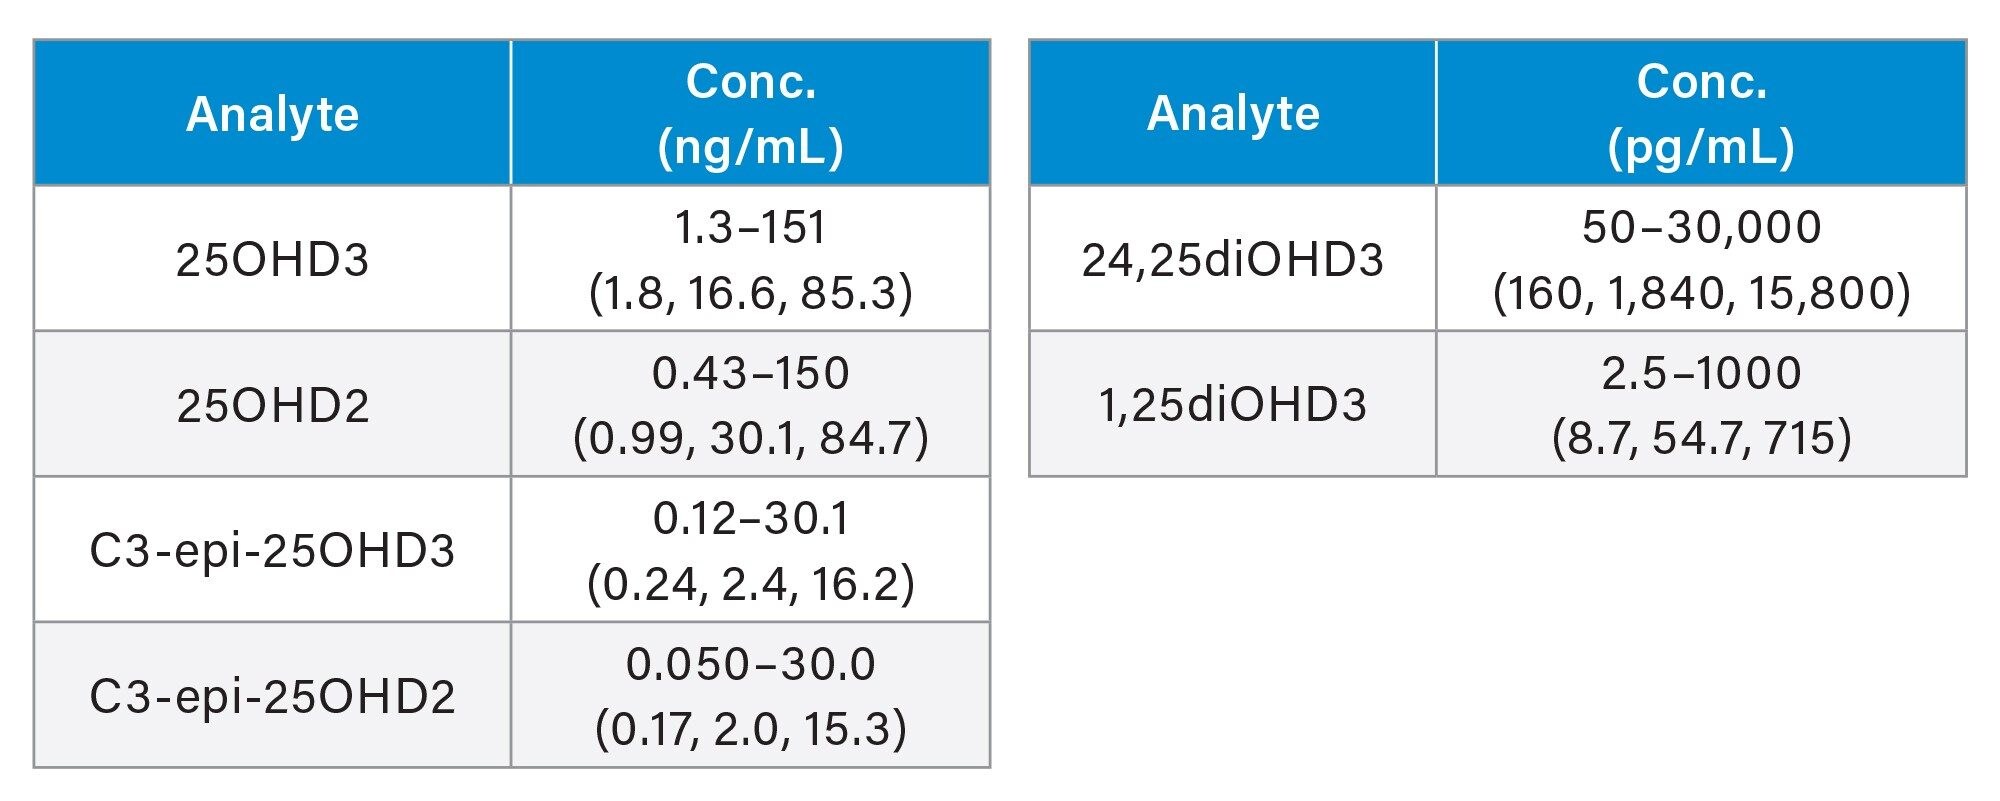 Table 3. Calibrator ranges and QC concentrations for the vitamin D metabolites.
LC-MS Grade Water and methanol were purchased from Honeywell (Bracknell, UK). Acetonitrile and formic acid were purchased from Greyhound (Birkenhead, UK). Ammonium fluoride and zinc sulfate were purchased from Sigma-Aldrich (Gillingham, UK).
Sample Extraction
Sample extraction was performed on a Hamilton STAR liquid handling robot.
To 200 μL of sample, 20 μL of internal standard was added and mixed. Protein precipitation was performed by adding zinc sulfate(aq) followed by methanol, with samples being mixed thoroughly after each addition. Samples were centrifuged prior to the supernatant being transferred into an Oasis PRiME HLB µElution plate (p/n: 186008052). Samples were washed using a methanol/water solution and the vacuum left on to dry the extraction sorbent. Samples were then eluted using acetonitrile and derivatization performed using PTAD reagent. Following derivatization, distilled water was added to quench the reaction and samples were directly injected onto the UPLC-MS/MS system. No evaporation steps were required prior to derivatization, simplifying the extraction workflow.
Results and Discussion
Below are example chromatograms of the vitamin D metabolites from a human serum sample (Figure 2).
Note: 1,25diOHD2 and 24,25diOHD2 have been supplemented for monitoring purposes only, to obtain a detectable peak at low levels.
 Figure 2. Typical chromatograms for the detection of vitamin D metabolites in human serum.
Precision was assessed by extracting and measuring five replicates of the QC L, QC M, and QC H samples across five days. Within-run and total precision were ≤7.2%CV across all concentrations for all vitamin D metabolites as shown in Table 4.
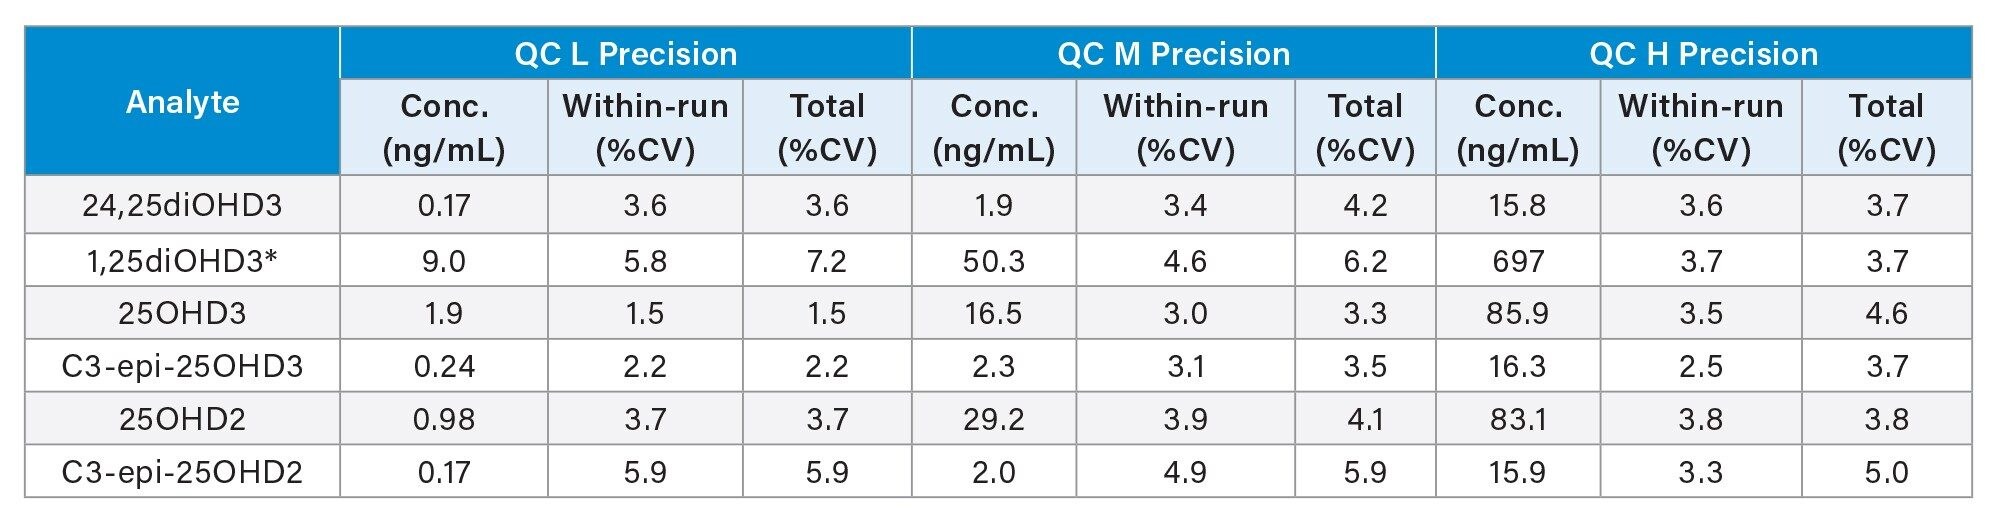 *pg/mL
Table 4. Precision Performance Summary for the vitamin D metabolites.
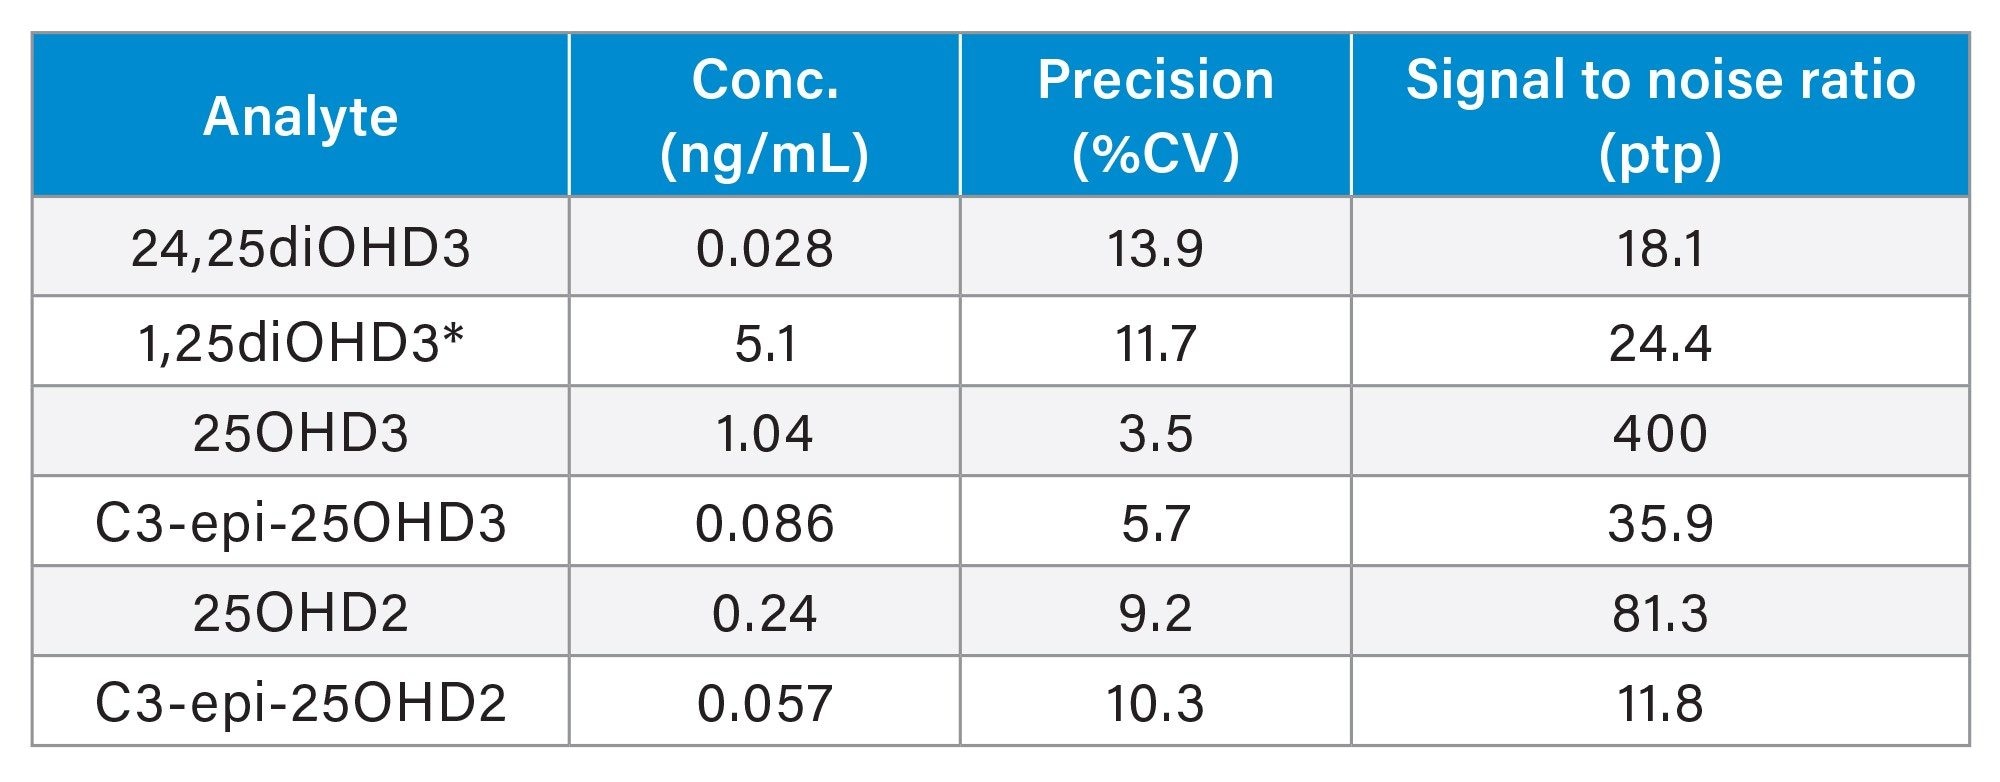
Analytical sensitivity was assessed by extracting and quantifying ten replicates of low-level vitamin D metabolite samples prepared in stripped serum over four days. The LLOQ was determined to be the lowest concentration at which precision was ≤20%CV and signal to noise ratio (S:N(ptp)) was ≥10:1. The LLOQ’s for the vitamin D metabolites are shown in Table 5. For 25OHD3, C3-epi-25OHD3, and 25OHD2, the endogenous contribution contained within the MSG2000 stripped human serum limited the LLOQ from being reduced further.
 *pg/mL
Table 5. Analytical Sensitivity Summary for the vitamin D metabolites.
Figure 3 shows typical chromatograms of a blank and low-level samples for 1,25diOHD3 spiked into MSG2000 stripped human serum. Whilst an LLOQ of 2.5 pg/mL was achieved with a %CV of ≤20%CV and a mean S:N(ptp) of ≥10:1, some replicates did not meet the signal to noise requirements, therefore, an LLOQ of 5.1 pg/mL was selected for 1,25diOHD3. Furthermore, a blank stripped serum sample can be differentiated from the same serum sample spiked with 1.25 pg/mL of 1,25diOHD3.
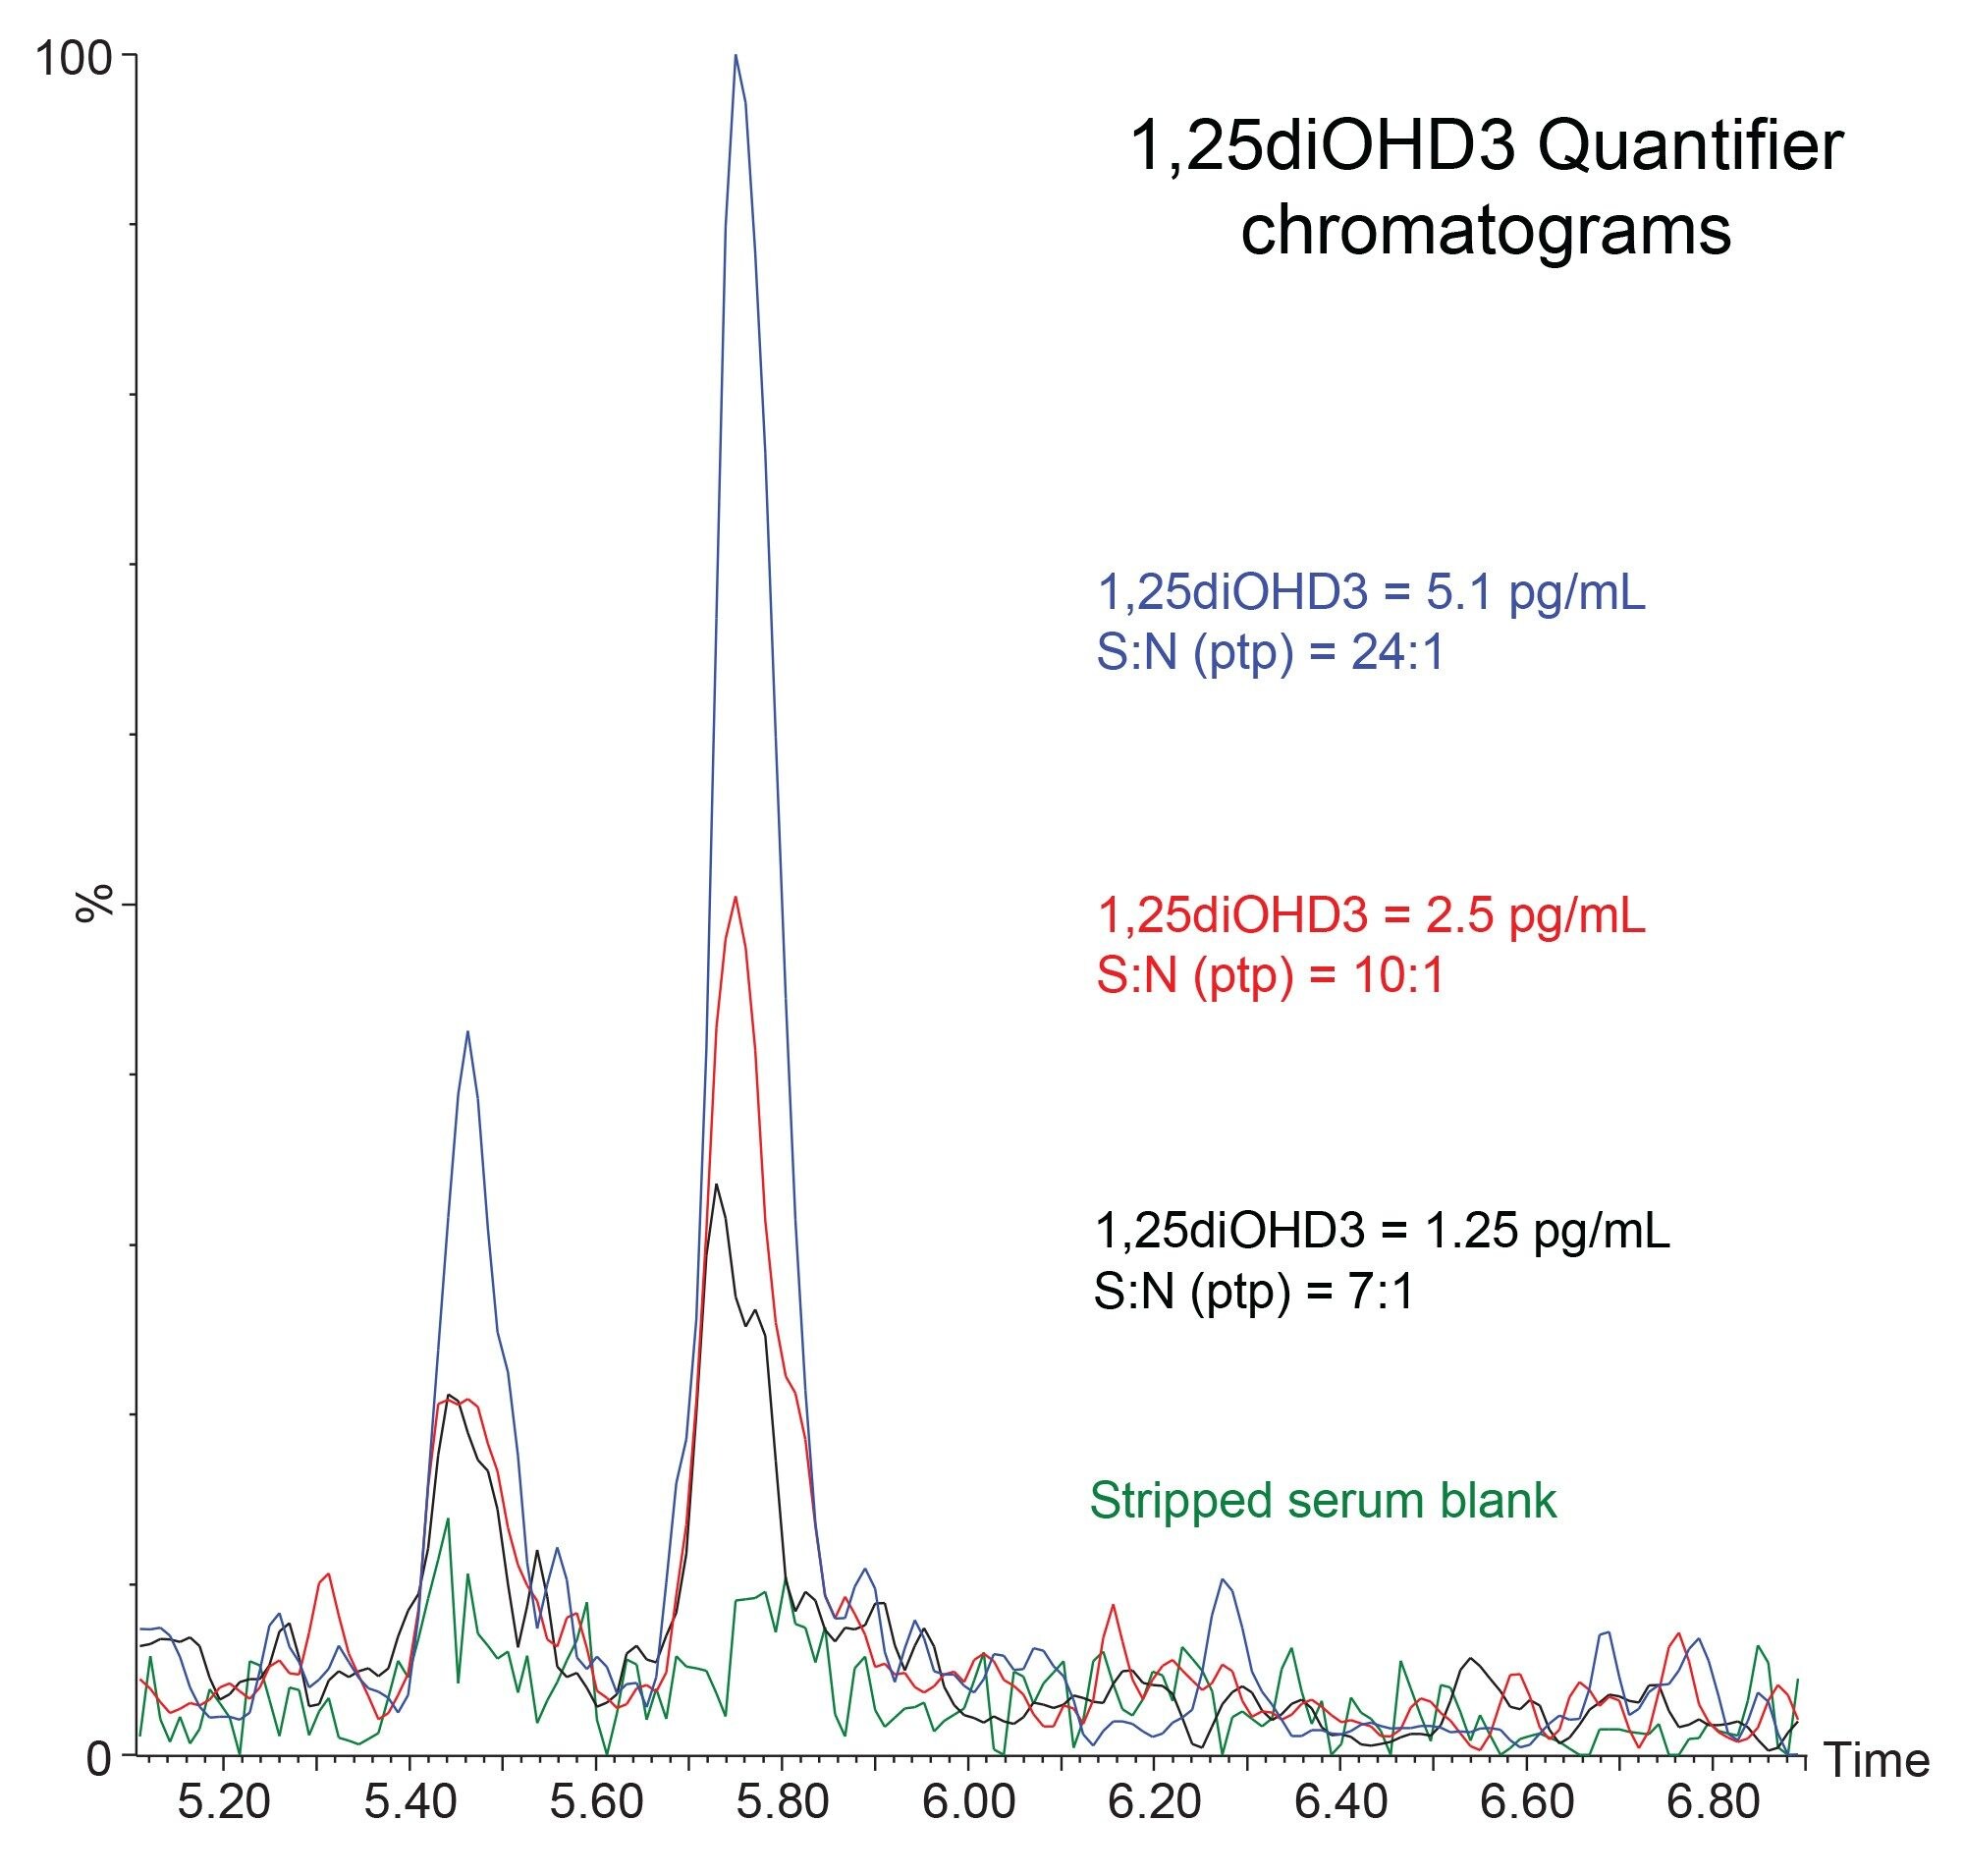 Figure 3. Chromatograms of a blank and low-level samples in stripped serum for 1,25diOHD3.
The method was shown to be linear across the ranges shown in Table 3 for all vitamin D metabolites when low and high pools were mixed in known ratios to give up to ten samples over the range. All calibration lines in spiked stripped serum were linear with a coefficient of determination (r2) >0.99 across ten separate occasions for all vitamin D metabolites.
The carryover of the assay was assessed by analysing a series blank and high (3 x Calibrator 7) samples for all vitamin D metabolites. No significant carryover was observed, all responses were <20% of the low calibrator sample. A sample dilution protocol using a 1:1 proportion and a 1:4 proportion of sample to calibrator 0 was developed and demonstrated to provide recovery of within 85–115%, allowing for dilution of samples outside of the calibration ranges for all vitamin D metabolites quantified.
Typical endogenous interferences (bilirubin, cholesterol, intralipid, triglycerides and uric acid) were tested and percent recoveries of the test samples compared to controls were all within ±15%. Matrix effect investigations were performed using donor serum samples from six individuals. Whilst ion suppression was observed when assessing the analyte peak areas alone (recoveries were less than 1.0), this was compensated for by the internal standards used as indicated by the normalized matrix factor results. All normalized matrix factor calculations, based on the analyte:internal standard response ratio were within 0.85 and 1.15 (Table 6). Due to the high endogenous concentrations of 25OHD3 and C3-epi-25OHD3 present in the samples obtained, the low-level spike was not able to be assessed.
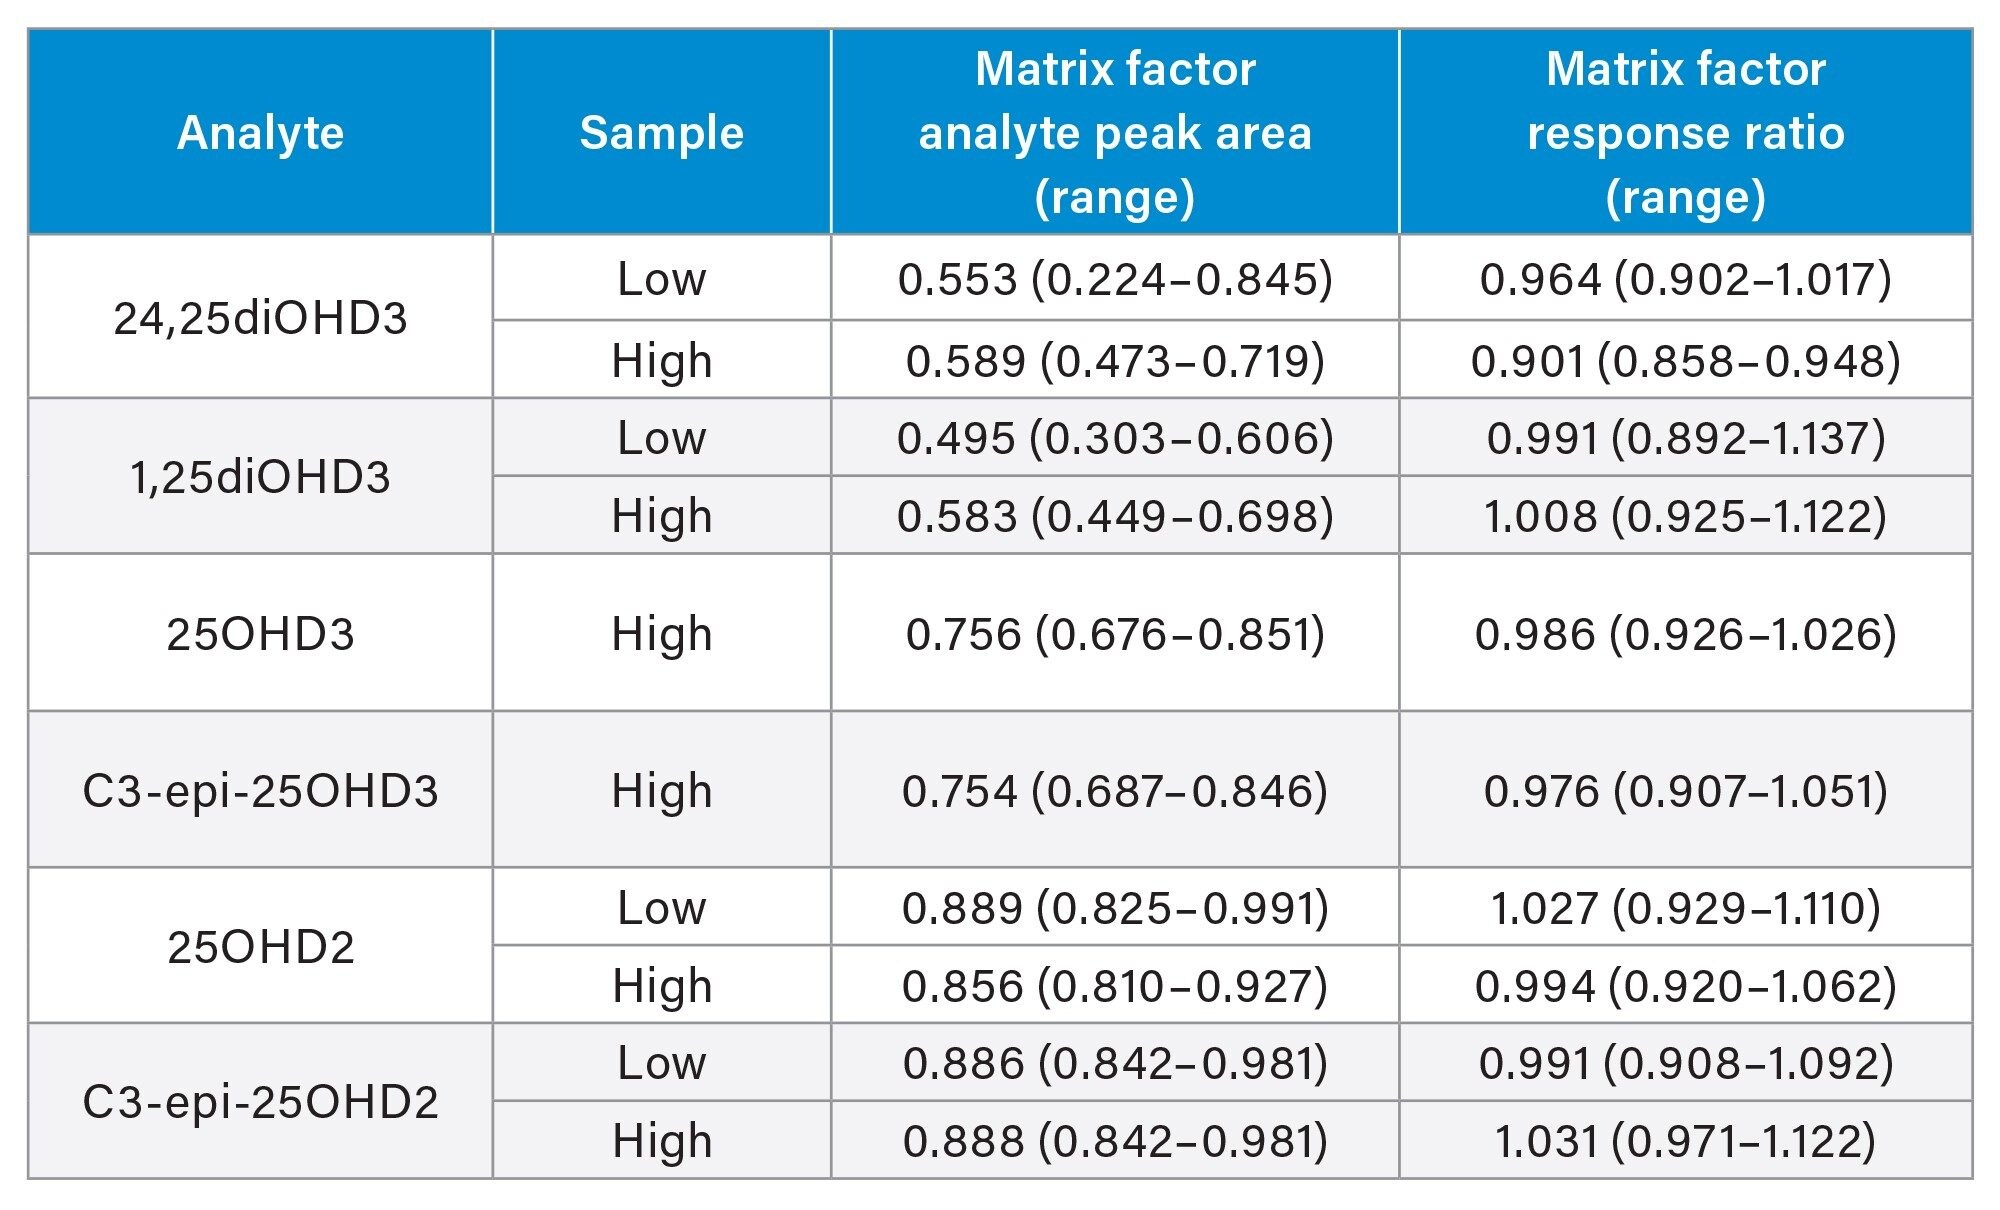 Table 6. Matrix Effects Summary for the vitamin D metabolites.
Accuracy was assessed by analyzing 40 DEQAS samples (Charing Cross Hospital, UK) for the metabolites 25OHD3 and 1,25diOHD3, with calculated concentrations compared to the NIST assigned values or LC-MS trimmed means (LC-MS TM), respectively. The accuracy for 25OHD3 and 1,25diOHD3 can be seen in Table 7 and Figure 4. Good agreement with a minimal bias was observed for 25OHD3 when compared to the DEQAS NIST assigned values, however, good agreement with a negative bias was observed for 1,25diOHD3 when compared to the DEQAS LC-MS trimmed mean. One potential explanation for the negative bias is the possibility of interference from other dihydroxyvitamin D metabolites that are chromatographically resolved using this method as shown in Figure 2.
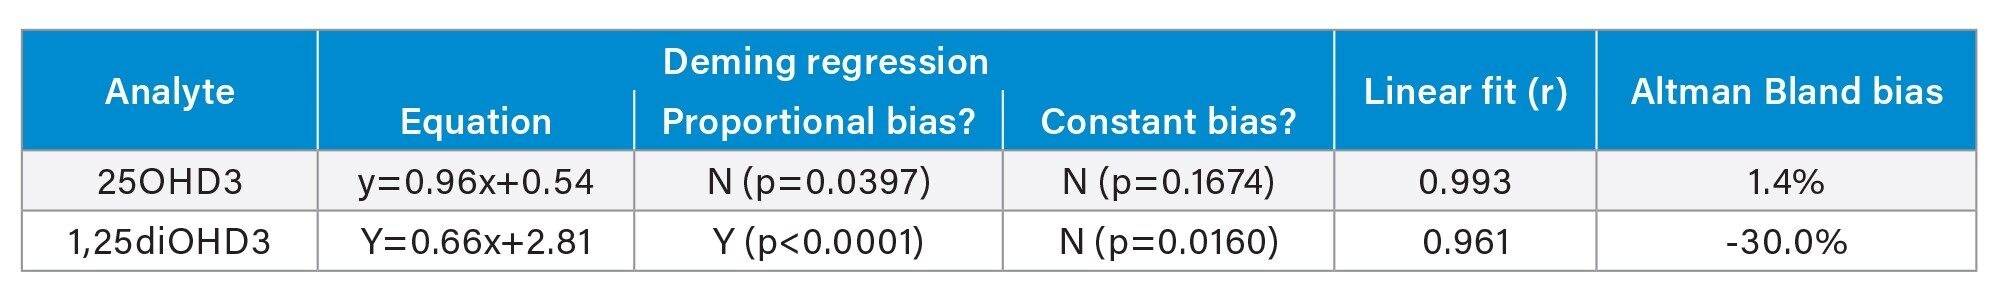 Table 7. Accuracy Summary for 25OHD3 and 1,25diOHD3.
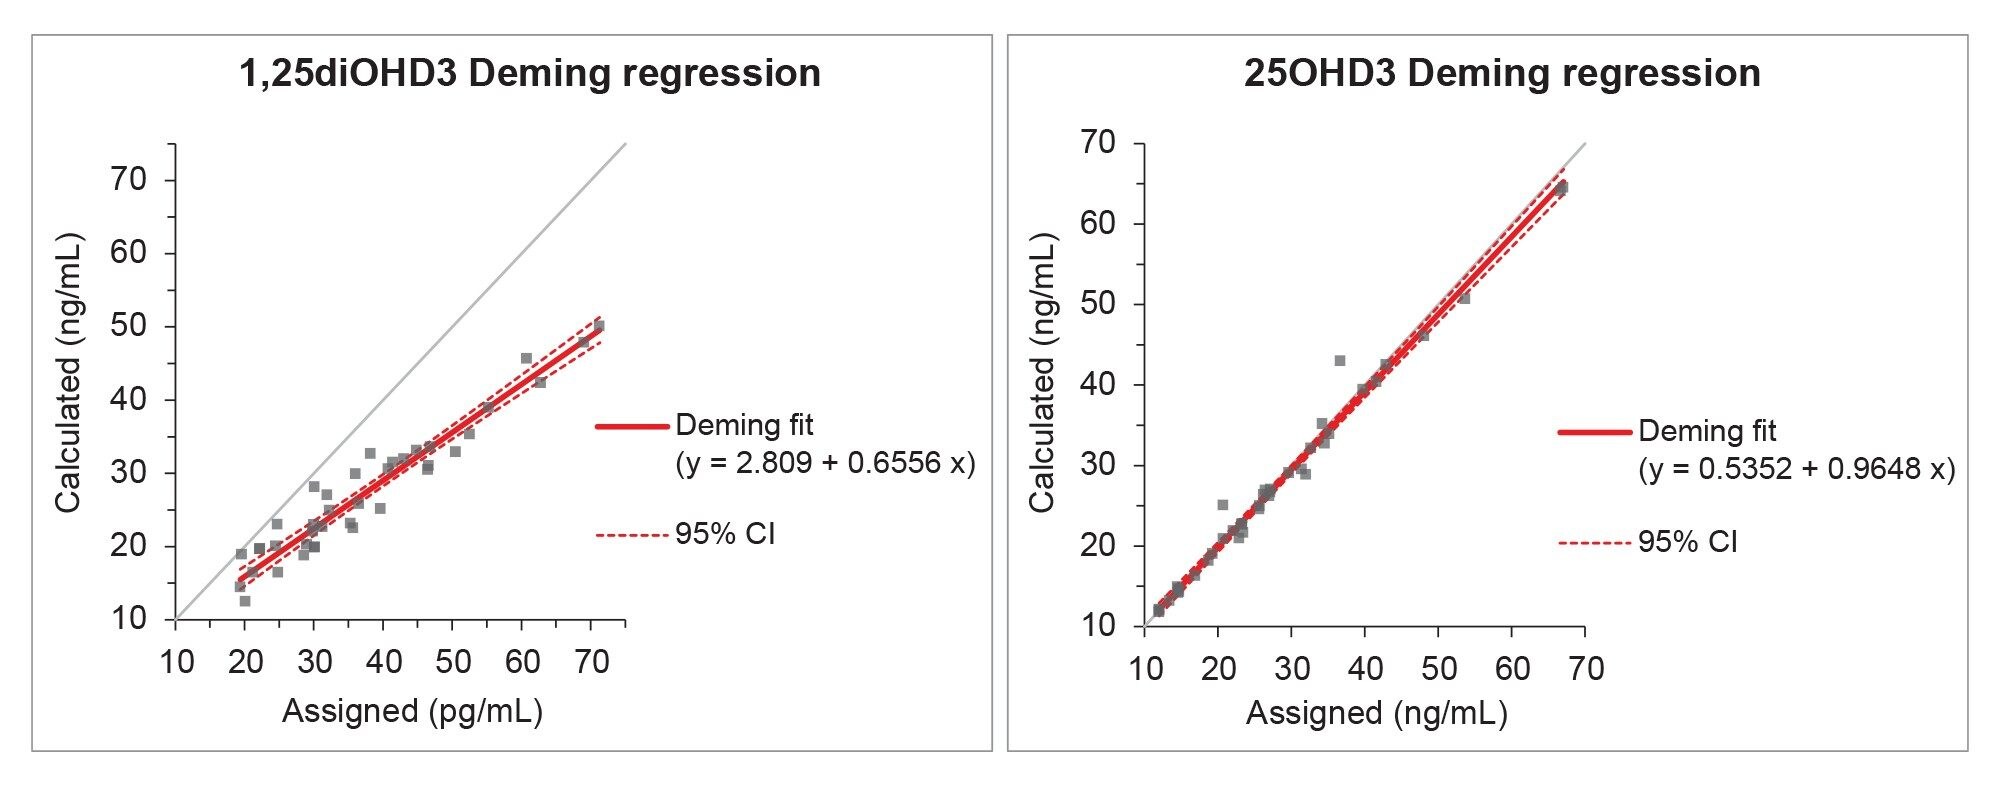 Figure 4. Deming Regression plots comparing the DEQAS NIST Assigned (25OHD3) or LC-MS TM (1,25diOHD3) values (Assigned) to the Waters UPLC-MS/MS method (Calculated).
Conclusion
A clinical research method has been developed for the analysis of six vitamin D metabolites in serum with good analytical sensitivity. Using only 200 μL of serum, this method was able to distinguish between a blank stripped serum sample and the same matrix spiked with 1.25 pg/mL of 1,25diOHD3 and is able to quantify 1,25diOHD3 at 5 pg/mL, with a relatively simple sample extraction procedure. Sample extraction can also be semi-automated, by utilizing a Hamilton STAR liquid handling robot, enabling sample tracking from the sample tube bar code to the processed results.
The assay described demonstrates excellent precision over five days, accuracy, and linearity across the measuring range. There was no significant carryover or interference from the endogenous compounds tested, matrix effects were compensated through the use of internal standards and up to a 1:4 dilution can be performed.
720007589, April 2022