• Application Note

Metabonomics and the Application of LC-MS to the Analysis of Rat Urine from a 90-Day Safety Assessment Study Applications Note

Metabonomics and the Application of LC-MS to the Analysis of Rat Urine from a 90-Day Safety Assessment Study Applications Note

  • John N. Haselden
  • Maria Anthony
  • Susan Conner
  • Brian Sweatman
  • Robert S. Plumb
  • Chris L. Stumpf
  • Jennifer H. Granger
  • GlaxoSmithKline
  • Waters Corporation

For research use only. Not for use in diagnostic procedures.

Abstract

An optimized Waters exact mass LC-MS System with a dedicated MassLynx 4.0 Software Application Manager has been developed to facilitate the rapid metabonomic analysis of biological fluids. This system is of particular utility in the pharmaceutical industry for the analysis of clinical trial or safety assessment samples, typically urine or plasma. The system and Applications Manager provide a complete solution to facilitate the collection and statistical analysis of bioanalytical data. By employing exact mass and MS/MS analysis the facile identification of putative endogenous biomarkers is accomplished. This application note shows the use of the Waters Metabonomics MS System with the MarkerLynx Application Manager for the analysis of samples resulting from a 90-day rat safety tolerability study.

Introduction

Most potential pharmaceuticals in the drug development process fail due to poor efficacy or toxicity. Unfortunately, this failure most often occurs during long-term safety assessment, human safety and tolerability studies, or efficacy studies in Phase I and Phase II clinical trials. At this late stage, a considerable amount of money and time has already been invested in the compound. In an attempt to address this problem by reducing the attrition rate, the focus of the analytical efforts in the pharmaceutical industry has moved into the safety assessment area. 

As a result of this focus over the past 5 years, a new science has evolved called “metabonomics”. This science initially employed analytical techniques such as GC-MS and more commonly 1H-NMR to profile urine samples from a toxicological study. The related discipline of metabolomics involves the quantitative measurement of a discrete number of low molecular weight metabolites in an organism’s cell at a specific point in time. Thus, metabolomics is focused on changes at the cellular level and does not reflect the interlinked nature of mammalian metabolism.1,2 Metabonomics, on the other hand, is based upon the multivariate analysis of complex biological profiles generated by spectroscopic techniques, such as 1H-NMR or MS, and is used for toxicological screening or disease diagnosis. Metabolic changes in the biological system are caused by a toxic insult or disease; these changes manifest themselves as perturbations in the homeostatic state of the biological fluids.

The spectroscopic data generated is then processed using multivariate statistical analysis, to discern any toxicological differences between a control and dosed group of animals.3-5 Early work by Nicholson et al.6,7 showed that the effect of a toxin was not characterized by changes in the concentration of a limited number of metabolites but by a more complicated series of changes in the entire metabolic profile. 

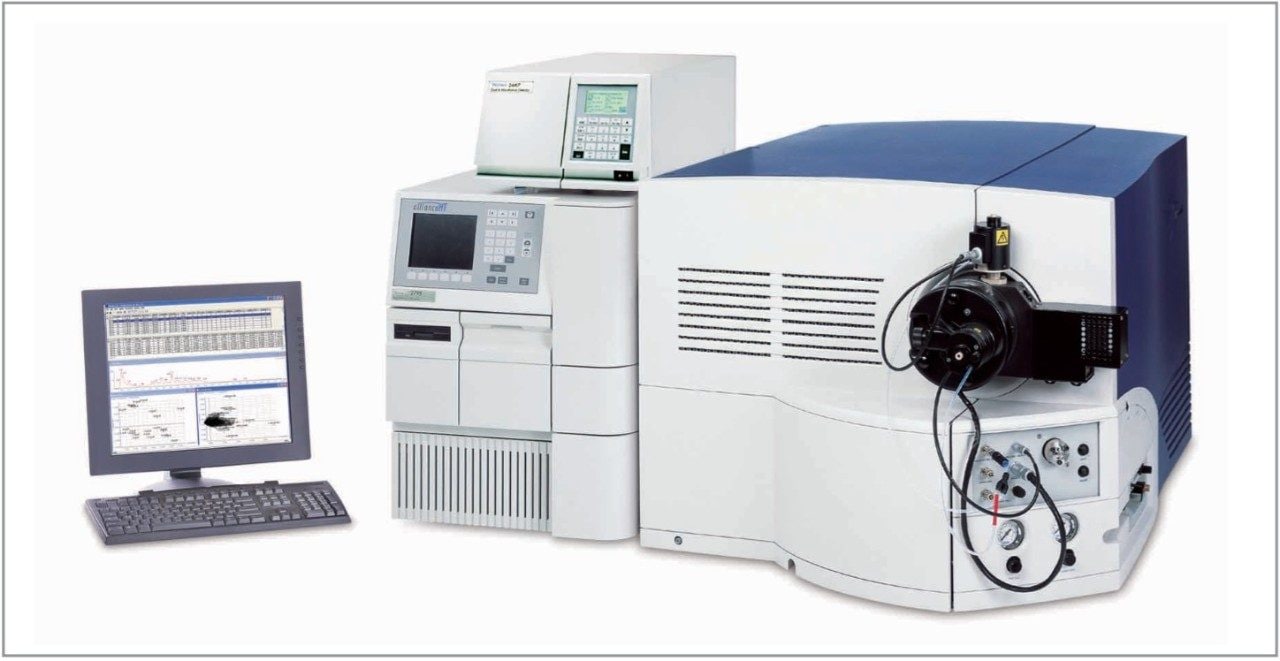
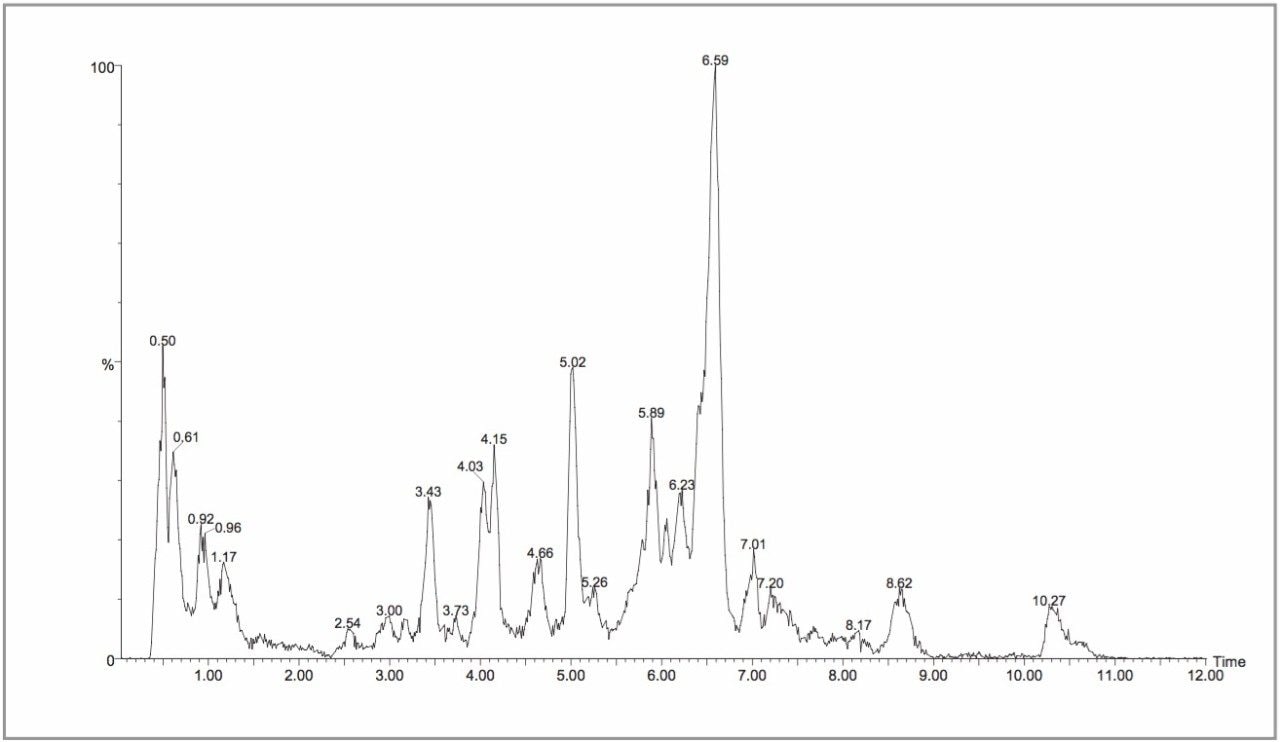
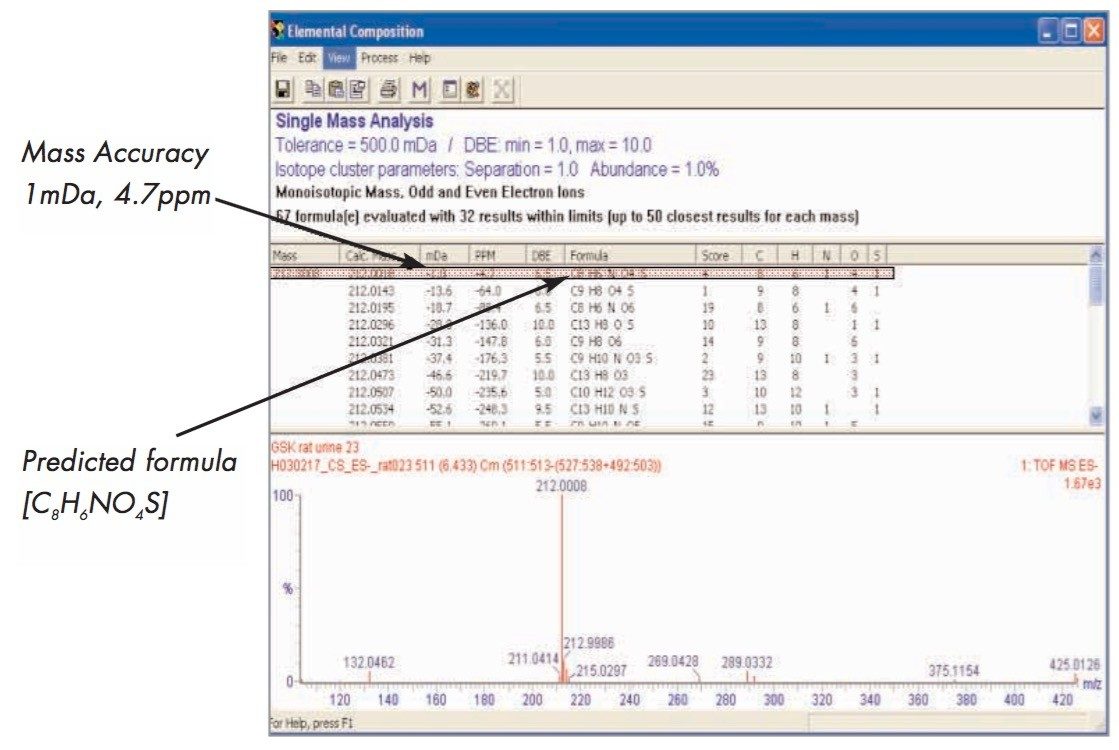
Electrospray mass spectrometry (ESI-MS) coupled to liquid chromatography (LC) is the current technique of choice for both quantitative and qualitative bioanalysis;8-10 more recently, the application of hybrid quadrupole orthogonal acceleration time-of-flight (Q-Tof) mass spectrometry has become increasingly popular for metabolic profiling and drug metabolite identification. The inherent extra sensitivity afforded by a Q-Tof instrument in full scan mode and the ability to elucidate elemental composition data make the timeof- flight instrument the ideal choice for endogenous metabolite profiling, which is the heart of metabonomics. Whilst one could simply infuse the sample into the mass spectrometer and gain some useful data, the use of a chromatographic step significantly reduces the ion suppression observed in the mass spectrometer, and hence increases sensitivity. The chromatography system can also separate isobaric compounds that would be measured as one component in an infusion experiment. In this metabonomics experiment, reversed-phase gradient chromatography was employed as it is easily interfaced with electrospray mass spectrometry and is capable of separating compounds with a wide range of polarities. 

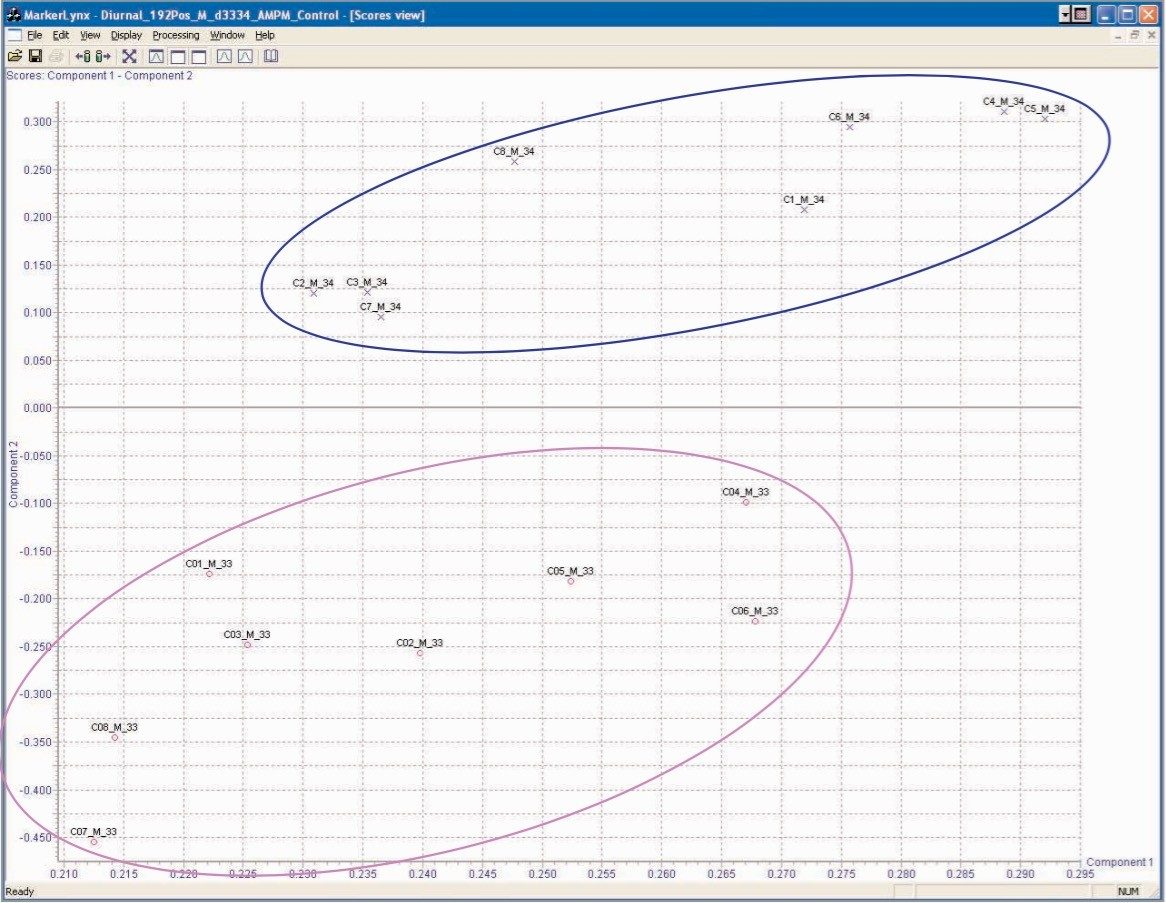
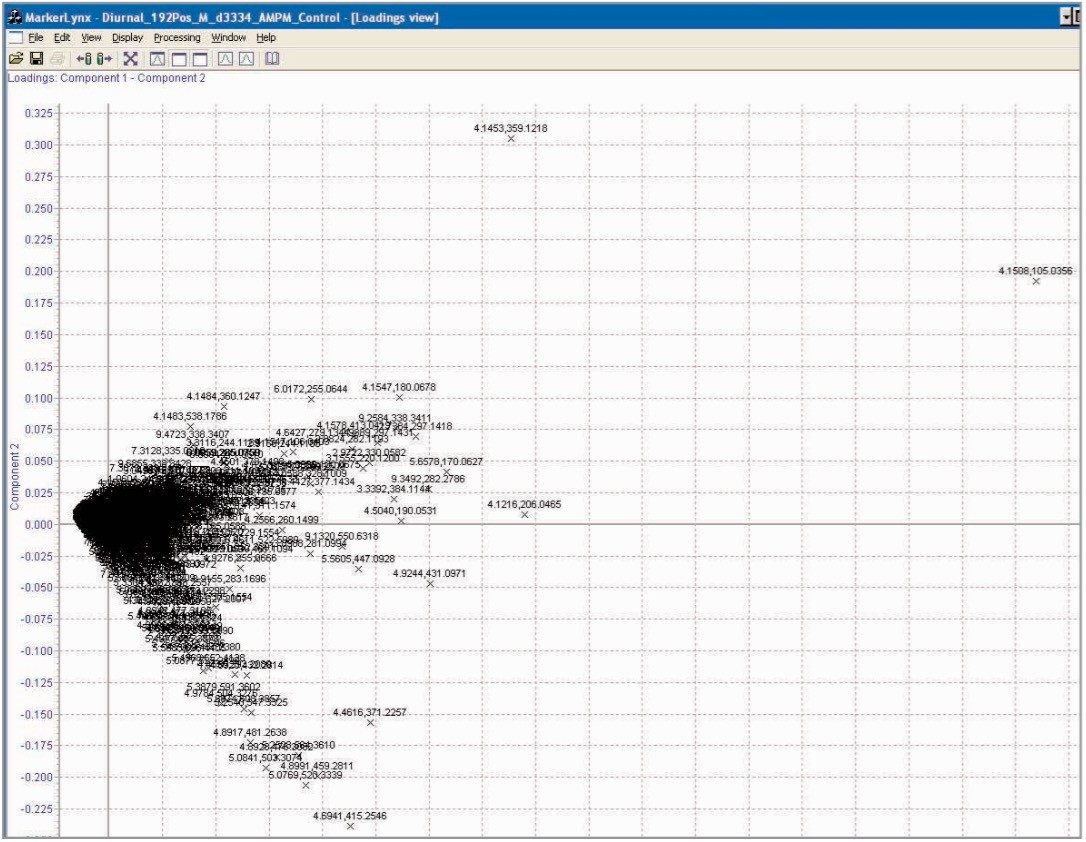
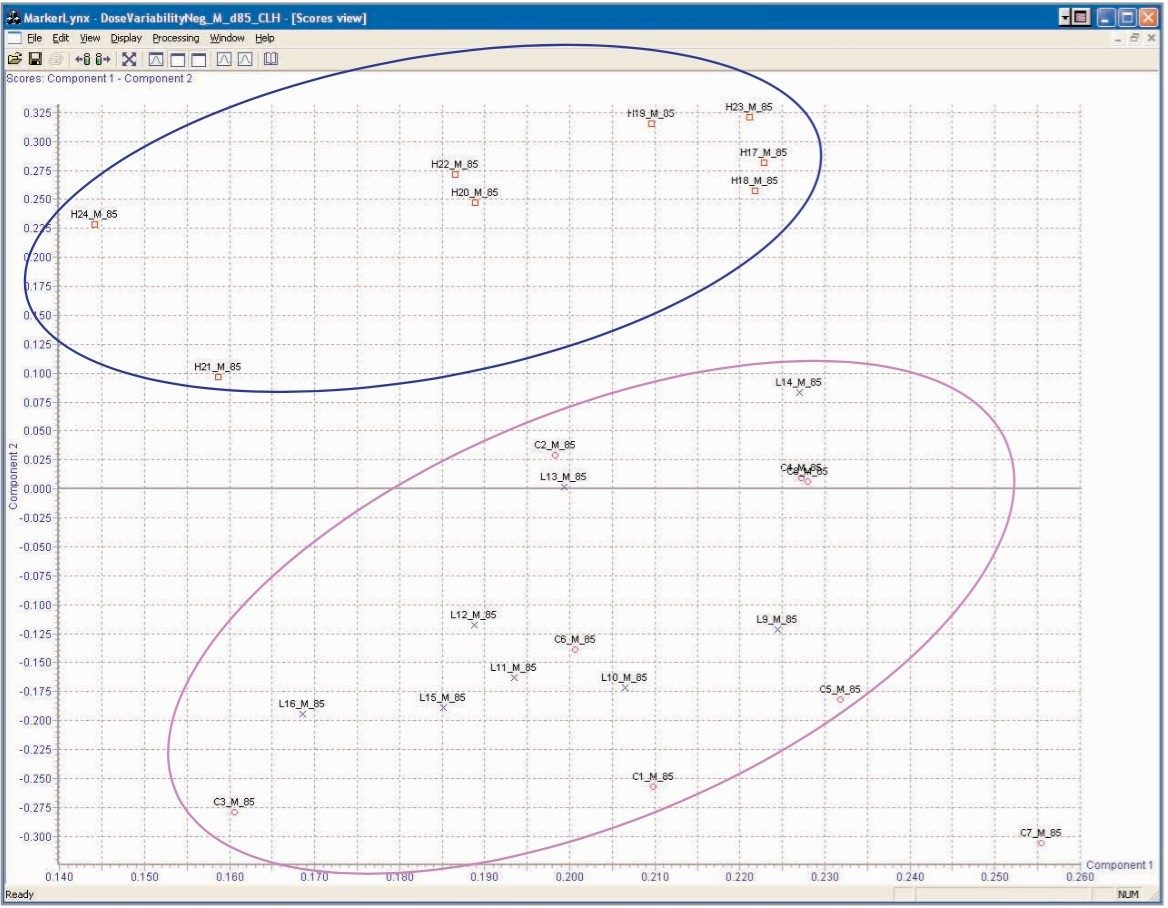
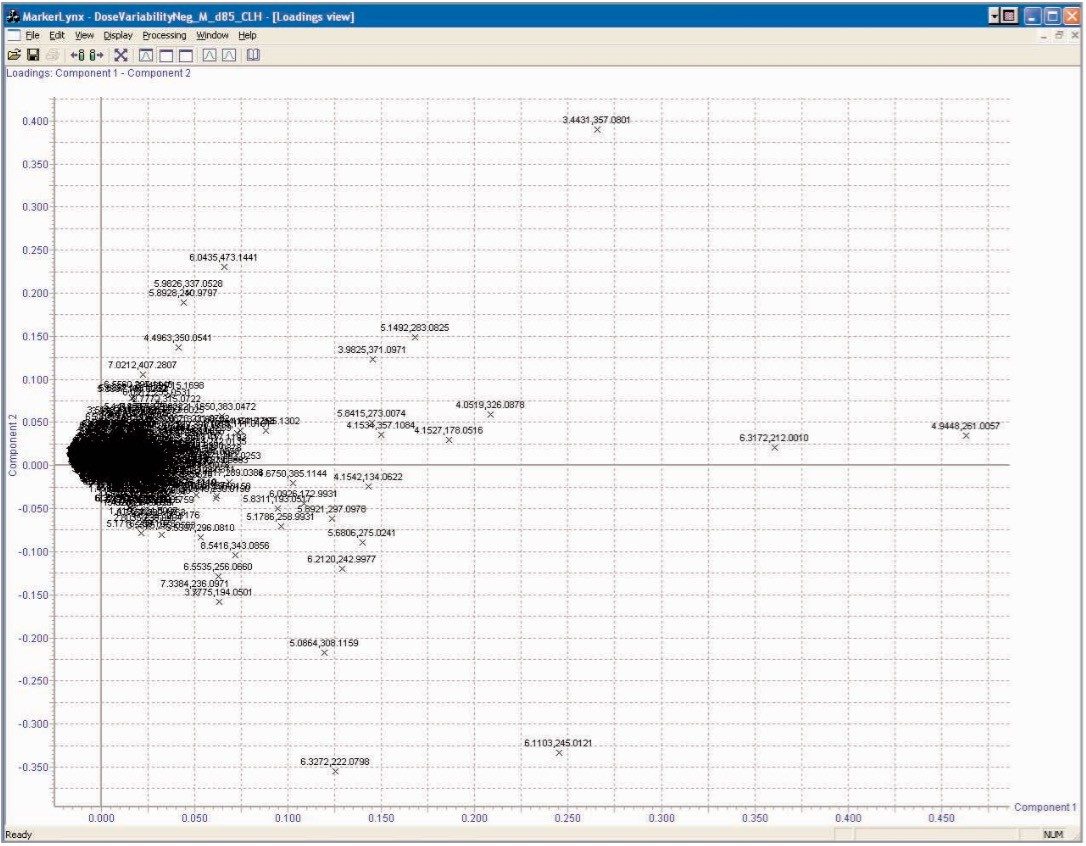
Previously, the statistical analysis of spectroscopic data has involved the “bucketing” of the acquired data into subsets, followed by the transfer of the data to a separate statistical package for analysis. This is not only a time-consuming process, but the “bucketing” action also results in a significant reduction in the resolution of spectroscopic data. Furthermore, it requires the user to perform the cumbersome step of switching between the statistical and spectroscopic software platforms to evaluate and/or remove any signals from potential biomarkers or unwanted xenobiotics. To address these shortcomings in current software offerings, Waters has developed the MarkerLynx Application Manager for MassLynx 4.0, a single software solution to facilitate both the processing and reviewing of LC-MS metabonomics data from the same platform from which it was acquired. This allows for easy viewing of both the derived multivariate statistical data and the original raw LC-MS data for dynamic user interaction. A Principle Component Analysis (PCA) package present within MassLynx, MarkerLynx clusters processed LC-MS data according to mass intensity and retention time comparison. In addition, xenobiotics and their metabolites can be easily discarded prior to processing. 

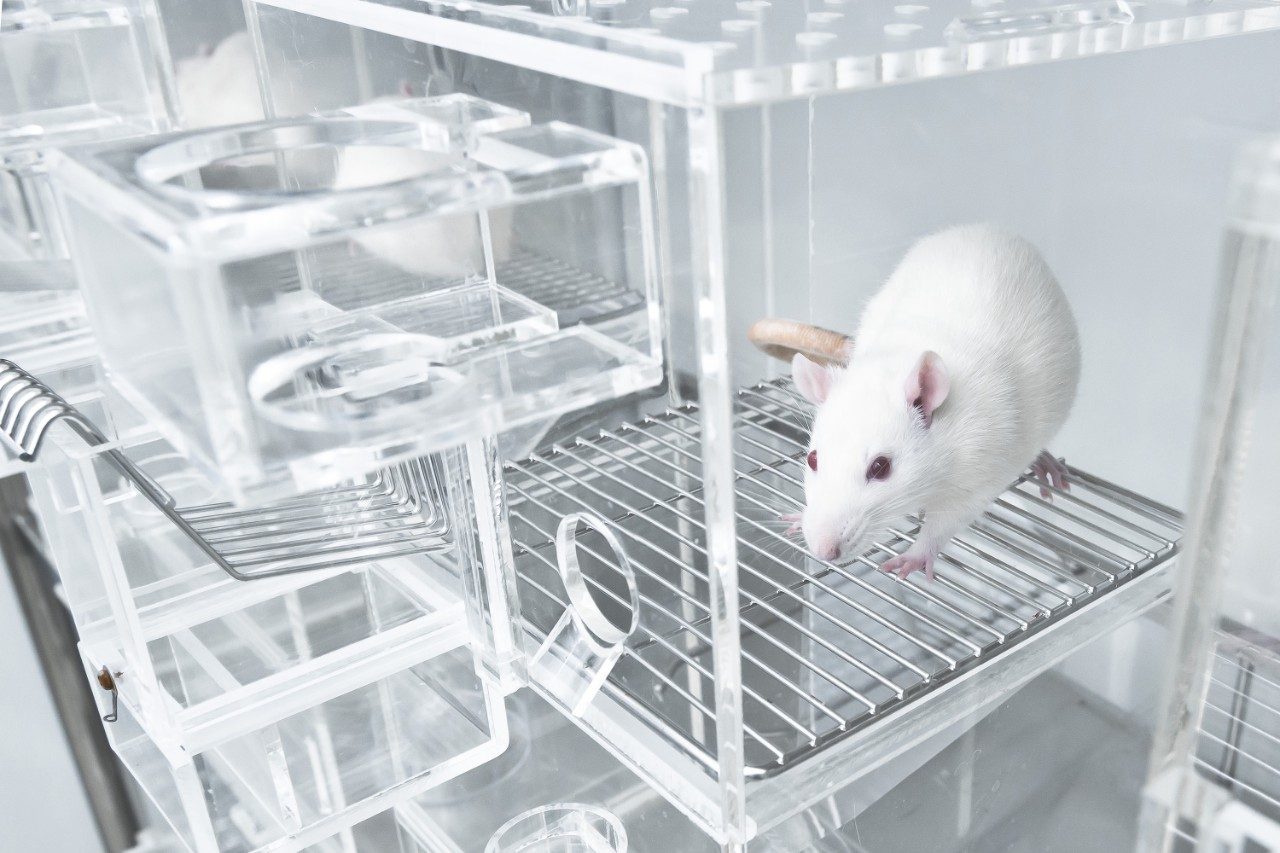
In this application note, we demonstrate the use of the Waters Metabonomics MS System for the analysis of urine collected from male and female rats following the once-daily oral administration of a candidate pharmaceutical for 90 days.

Technology

The Waters Micromass Q-Tof micro, a hybrid quadrupole orthogonal acceleration time-of-flight mass spectrometer, has become the instrument of choice for metabolite profiling and identification. The addition of a LockSpray lockmass interface to the instrument ensures correct mass referencing independent of the composition of the mobile phase or temperature fluctuations. The ability of the instrument to routinely acquire reliable exact mass data has allowed the elemental composition of xenobiotics, pharmaceutical impurities, or potential biomarkers to be elucidated. The ability to produce an elemental composition allows the user to reduce the number of potential structures or rapidly search a database. Any comparison of LC-MS data relies on the performance and reproducibility of the chromatography system and column. To address this, the Waters 2795 XC Separations Module has been specifically designed to produce exceptionally reliable chromatography, with retention time stability due to reproducible gradient performance (for both high- and low-flows) and synchronization with each injection. Complementing the Waters 2795 XC Separations Module capabilities, Waters Symmetry high performance high purity silica HPLC columns yield excellent peak shape and are very reproducible. Since the success of multivariate statistical analysis and subsequent database interaction is heavily dependent upon retention time reproducibility, the Waters 2795 XC Separations Module paired with Symmetry column technology makes it well-suited for metabonomics applications.

Experimental

A novel candidate pharmaceutical compound currently under investigation by GlaxoSmithKline research laboratories, (Ware, UK) was used in this study. Male and female Wistar Han rats were obtained from Charles River UK Ltd., (Kent, UK). The animals were randomly divided into three equal groups (n=16 per group, 8 female, 8 male) and acclimated for 7 days prior to dosing. The animals were housed individually in grid-bottomed urine collection cages, all animals had access to food and water ad libitum and were maintained on a 12 hour light/12 hour dark cycle (21°C ± 1°C). Each group received a once-daily oral dose of the candidate pharmaceutical or vehicle alone, to serve as a control, for a total of ninety days. The dosing levels were vehicle alone, 2 mg/kg, or 18 mg/kg. Urine samples were collected 0–8 hr. and 8–24 hour post-dose, urine volumes were recorded, and the samples maintained at -20°C until analysis. 

The rat urine samples were allowed to thaw at room temperature prior to analysis, centrifuged at 13,000 rpm for 5 minutes, and the supernatant removed. A 50 μL aliquot of supernatant was diluted to 200 μL with distilled water. The LC-MS data of the urine from all of the dose and sex groups on both day 33 and day 84 at the 0–8 hour and 8–24 hour time points were acquired and used in this particular study. 

The samples were analyzed on the Waters Metabonomics MS System using the conditions described below:

LC Conditions

LC system:

Waters 2795 XC Separations Module

Column:

Waters Symmetry C18 3.5 μm 2.1 x 100 mm

Flow rate:

600 μL/minute split to 150 μL/minute into MS

Injection volume:

10 μL

Gradient:

Linear, 0–20% B over 0.5–4 minute, 20-95% B over 4–8 minute, hold at 95% B for 1 min. then return to 0% B at 9 min.

Where A = 0.1% Formic acid in water, and B = 0.1% Formic acid in acetonitrile

MS Conditions

MS system:

Waters Micromass Q-Tof micro with a LockSpray interface

Ion mode:

Positive or negative electrospray

Cone voltage:

30 V

Capillary voltage:

3.2 kV

Desolvation temp.:

250 °C

Source temp.:

120 °C

Collision energy:

4 eV

Detection mode:

Full scan 50–1400 m/z, centroid mode

Dwell:

0.1 sec.

Collision gas:

Argon, 5 x 10⁻³ mbar

Lock mass:

Leucine Enkephalin at a concentration of 50 fmol/μL, a flow rate of 20 μL/minute was employed with a frequency of 10 seconds

All data processing was performed using the MarkerLynx Application Manager on a MassLynx 4.0 workstation.

Results and Discussion

The LC-MS data acquisition for a total of 192 samples in both positive and negative ion mode took ten days (a total of 384 analyses). Prior to the collection of any urine LC-MS data the system was characterized by the triplicate injection of the Waters Metabonomics MS System performance acceptance test mix. This ensured that both the chromatographic performance and mass spectrometric sensitivity were within acceptable limits before data collection. A typical chromatogram is shown in Figure 1. This test mix was subsequently injected every 10 samples to ensure the continuous correct operation of the LC-MS system.

Figure 1. Waters Metabonomics MS System performance acceptance test mix.

All of the full scan MS experiments were performed on a single Symmetry 2.1 x 100 mm column, with a new guard column employed every 96 samples. Despite the high numbers of urine samples injected onto the column, the chromatographic performance of the column was still within acceptable limits at the end of the study. As discussed in our previous communication,13 urine contains several thousand components, many unidentified, and it is not possible to detect all of these components with one rapid LC-MS analysis. Typical LC-MS chromatograms from the negative and positive ion analyses are shown in Figures 2 and 3. MarkerLynx processing resulted in the detection of approximately 10,000 discrete ion signals. This result indicates that the LC-MS system was able to detect a significant number of the endogenous compounds present in urine.

Figure 2. Positive ion LC-MS separation of control rat urine samples.
Figure 3. Negative ion LC-MS separation of control rat urine samples.

Diurnal Variation

It has been well documented that there is a significant difference in the metabolic processes that occur during the day versus during the night. As the test animals were maintained on a 12 hour light/dark cycle in this study, one would expect to be able to differentiate between the 0–8 hour and 8–24 hour control samples using the LC-MS derived spectral data acquired. The data in Figure 4 shows the PCA scores plot of the urine samples from the male control group, where there is a clear separation of the rat samples between day and night. These results are similar to those reported by Shockcor and Holmes,11 which showed differentiation between day and night urine samples with proton NMR. The loadings plot identifying the ions responsible for the separation in the scores plot is shown in Figure 5. From this plot, we can see that the major ions responsible for the separation in the scores plot are m/z 105, 206, 359, 415, 431 in positive ion mode.

Figure 4. Statistical analyses of male control rat urine 0–8 hour and 8–24 hour samples, positive ion ESI.
Figure 5. Principal Component Analysis loadings plot of diurnal separation.

Dose group variation In this study, the animals received either control vehicle alone, 2 mg/kg, or 18 mg/kg daily dose of the compound under investigation. As the resulting sample set was complex, with variables such as gender, dose, and sample collection occasion, one would expect to see the signals from these animals to cluster into several different groups. The effect of the dose level on the endogenous metabolism of the male test animals on day 84 8–24 hour was readily observed, Figure 6. In this Figure, we can see that the samples representing the dosed animals are well resolved from those of the control animals. In addition, the low dose animal samples are clearly separated from those of the high dosed. This indicates that the LC-MS analysis was capable of differentiation between not only control and dosed samples but could also as, in this instance, detect differences in the endogenous profile due to dose level.

Figure 6. Analysis of LC-MS data from control, low and high dose male urines.

From the PCA loadings plot, Figure 7, it is possible to identify the analytes (retention time, m/z value) of the ions responsible for the group clustering; here we can see that some of the ions responsible for the separation were m/z 178, 212, 261, and 357. Further analysis of the raw LC-MS data from the 212 ion, Figure 8, shows that it was possible to determine the exact mass and thus the elemental composition of this analyte.

Figure 7. PCA loadings plot for the analysis of the control, low, and high dose male urine samples.
Figure 8. Endogenous biomarker structure identified by exact mass LC-MS.

The further analysis of the urine samples by LC-MS/MS coupled with the exact mass data from the original analysis allowed the putative structures of the endogenous biomarkers to be identified, Figure 9.

Figure 9. LC-MS/MS analysis of putative biomarker m/z 212.

The results presented above show that LC-MS can be used to highlight variations in endogenous metabolism due to diurnal effects, sex and dosage level. The loadings plots allow the LC/MS ion signals responsible for separations observed in the respective PCA scores plot to be identified. Further, the ions having the greatest influence on the PCA scores plot separations are those furthest away from the main cluster of ions. 

Thus, we can use this information to indicate potential biomarkers, i.e. compounds whose presence, absence, or relative concentration are indicative of a disease state or toxicological response. A representative number of samples from the high dose groups from both males and females were analyzed by LC-MS/MS using product ion MS/MS. The fragment ion data produced from the product ion MS/MS has enabled the identification of several of the analytes responsible for the PCA scores plot separation. The metabolite identification was also aided by the use of exact mass analysis on the Q-Tof instrument. An example of an analyte identified is shown in Figure 9. The metabolite indican is of interest because it is part of the tryptophan metabolism cycle; the essential amino acid tryptophan is converted to indole by intestinal bacterial cleavage of the tryptophan side chain. Another analyte of interest detected was phenylacetylglycine (not shown); this metabolite was first detected as a toxicological marker for the decrease in urinary citrate and 2-oxaglutarate levels by Haselden et al.12 using 1H-NMR. 

This study has illustrated that LC-MS has several strengths for metabonomics. LC-MS for the majority of cases has superior sensitivity over current 1H-NMR techniques. The extra resolution provided by the chromatography step facilitates a reduction in chemical interference, particularly for low abundance analytes. Finally, the removal of interfering xenobiotic data is also greatly improved in LC-MS spectra because of the lower probability of analyte overlap in a mass spectrum when compared to an NMR spectrum, due to the fundamental differences in the two analytical techniques.

Conclusion

The data presented here shows that exact mass LC-MS data coupled with multivariate statistical analysis, as generated by the Waters Metabonomics MS System with the MarkerLynx Application Manager, is a very effective tool for metabonomics. Diurnal variations in the samples were clearly observed in samples from the control rats. The analysis of the LC-MS data also revealed the variation in endogenous metabolism depending upon the dosage received by each animal group. 

Using the LC-MS data and PCA, it was possible to identify gender differences in the metabolic tolerance to the toxicological insult as a result of administration of the compound under evaluation. The results from the PCA loadings plot of the exact mass LC-MS data indicated the ions responsible for the group clustering. This data clearly shows that exact mass LC/MS data can be used for the putative identification of potential biomarkers in metabonomics studies.

References

  1. L.S. Ramos, J. Chromatogr. Sci., 1994, 32, 219. 
  2. R. Freeman, R. Goodacre, P.R. Sisson, J.G. Magee, A.C. Ward and N.F. Lightfoot, J. Med. Microbiol., 1994, 40, 170. 
  3. D.G. Robertson, M.D. Reily, R.E. Sigler, D.F. Wells, D.A. Paterson an T.K. Braden, Toxicol. Sci., 2000, 57, 326. 
  4. E. Holmes, A.W. Nichols, J.C. Lindon, S.C. Connor, J.C. Connelly, J.N. Haselden, S.P. Damment, M.S. Spraul, P. Neidig and J.K. Nicholson, Chem. Res.Toxicol., 2000, 13, 471–478. 
  5. C.L. Gavaghan, E. Holmes, E. Lenz, I.D. Wilson, J.K. Nicholson, FEBS Letters, 2000, 484,169–174.
  6. J.K. Nicholson, J.C. Lindon and E. Holmes, Xenobiotica, 1999, 29, 1181. 
  7. J.K. Nicholson, J.C. Lindon, J. Connelly and E. Holmes, Nat. Rev. Drug Discovery, 2002, 1(2), 153. 
  8. G.D. Bowers, C.P. Clegg, S.C. Hughes, A.J. Harker, and S. Lambert. LCGC, 1997, 15, 48–53. 
  9. G.J. Dear, J. Ayrton, R.S. Plumb and I.J. Fraser, Rapid Commun. Mass Spectrom., 1999, 13, 456–463. 
  10. J. Ayrton, G.J. Dear, W.J. Leavens, D.N. Mallett and R.S. Plumb, J. Chromatrog. B, 1998, 709, 243–254. 
  11. J.P. Shockcor and E. Holmes, Curr. Topics Med. Chem., 2002, 2, 35–51. 
  12. A.W. Nicholls, J.K. Nicholson, J.N. Haselden, C.J. Waterfield, Biomarkers, 2000, 5, 410–423. 
  13. R.S. Plumb, C.L. Stumpf, M.V. Gorenstein, J.M. Castro-Perez, G.J. Dear, M. Anthony, B.C. Sweatman, S.C. Connor, and J.N. Haselden, Rapid Commun. Mass Spectrom., 2002, 16, 1991–1996.

Featured Products

720000622, June 2003

Back To Top Back To Top