• Application Note

The Analysis of Urinary Free Cortisol by On-Line Solid Phase Extraction

The Analysis of Urinary Free Cortisol by On-Line Solid Phase Extraction

  • Lisa J. Calton
  • Gareth Hammond
  • Brian Keevil
  • Waters Corporation
  • University Hospital of South Manchester

For research use only. Not for use in diagnostic procedures.

Abstract

In this application note, we describe the analysis of UFC by an automated on-line solid-phase extraction (XLC) MS/MS technique. The method uses a Spark Holland Symbiosis automated SPE instrument coupled to a Waters Quattro micro tandem quadrupole mass spectrometer.

Benefits

The integrated Symbiosis Pharma / Quattro micro system is easy to use with the new MassLynx driver, enabling complete control of the system.

Introduction

The measurement of urinary free cortisol (UFC) is of clinical importance in the diagnosis of Cushing’s syndrome. Cushing’s is a disease caused by the autonomous and excessive production of cortisol. The majority of routine methods for determining 24 hr-UFC concentrations involve RIA or HPLC with UV detection. In general, the performance of immunoassays is limited due to the cross-reactivity of cortisol metabolites leading to the amounts of UFC being over estimated.1,2 In clinical laboratories, LC-MS/MS is now becoming more common due to the gains in specificity and accuracy compared to immunoassays.3

In this application note, we describe the analysis of UFC by an automated on-line solid-phase extraction (XLC) MS/MS technique. The method uses a Spark Holland Symbiosis automated SPE instrument coupled to a Waters Quattro micro tandem quadrupole mass spectrometer (Figure 1).

Figure 1. Symbiosis Pharma/Quattro micro Systems.

Experimental

Sample Preparation

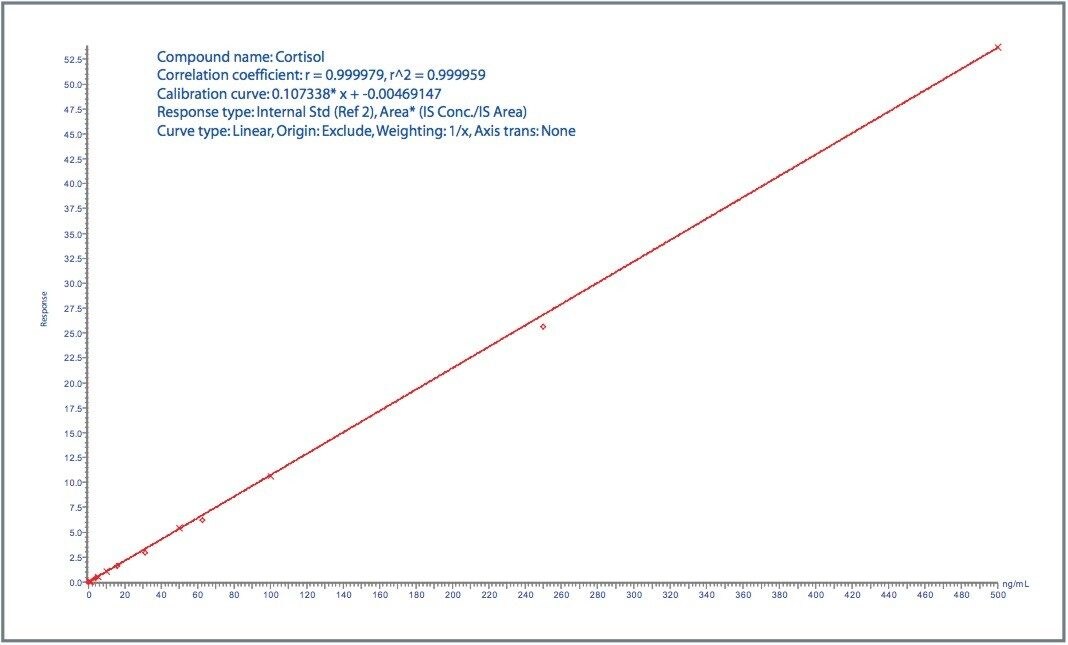
Calibrators were prepared in urine like electrolyte solution (ULE solution Fluka) over the concentration range 0.5-500 ng/mL and six QC samples were prepared independently.

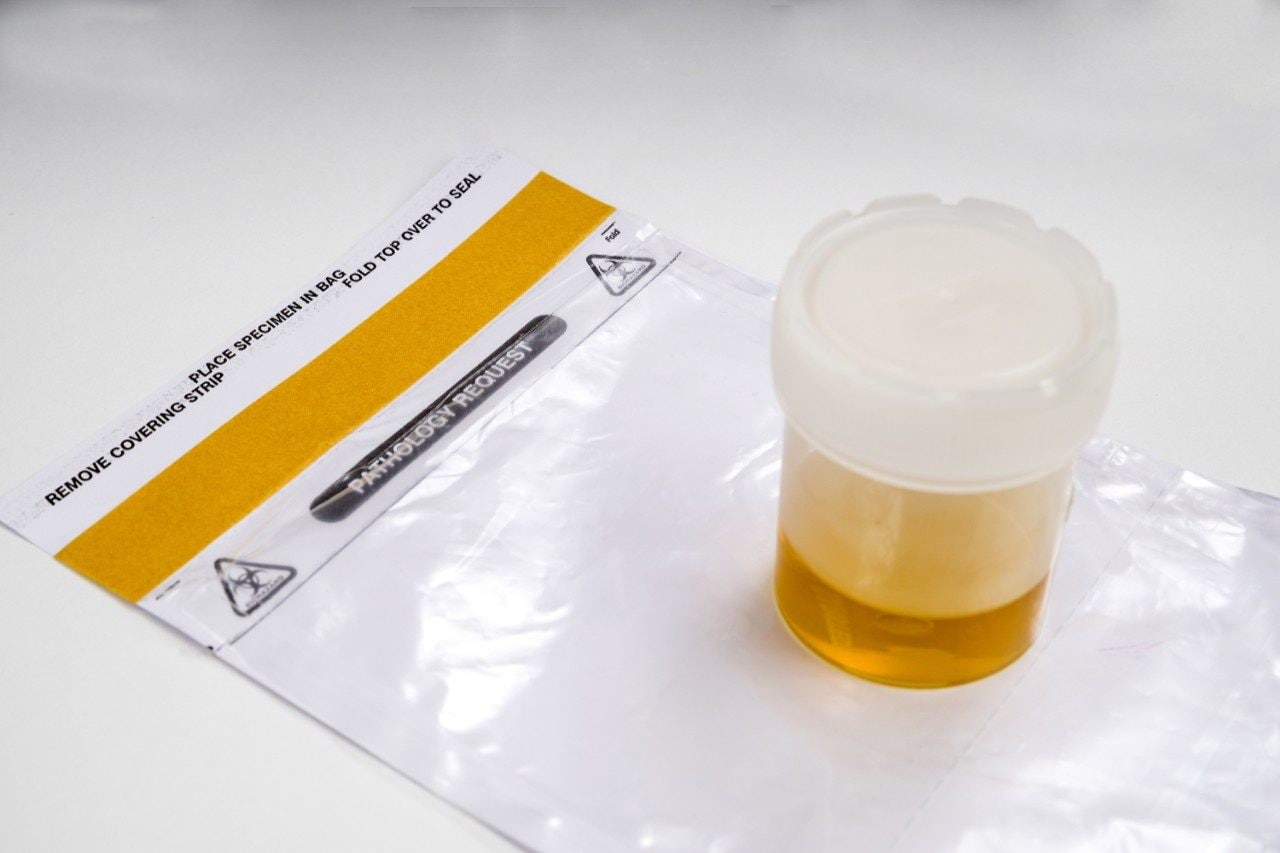
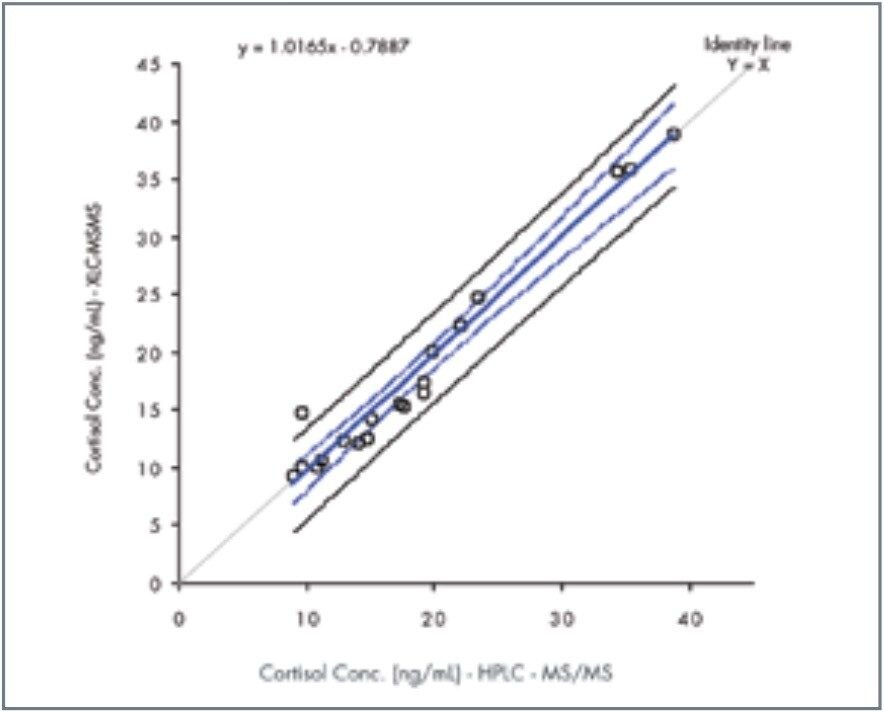
Twenty anonymised 24 hour urine samples collected into plain containers, were received for the investigations into possible Cushing’s syndrome. After determination of the urine volume, an aliquot was taken and kept at 8 ˚C for a maximum of one week and analyzed at South Manchester University Hospital (SMUHT) by their ‘in house’ routine LC-MS/MS method. After the analysis, the aliquot was stored at -20 ˚C prior to analysis by XLC-MS/MS.

Internal standard (d2-cortisol; 10 μL) was added to 240 μL of each calibrator, QC and patient sample to give a final concentration of 20 ng/mL.

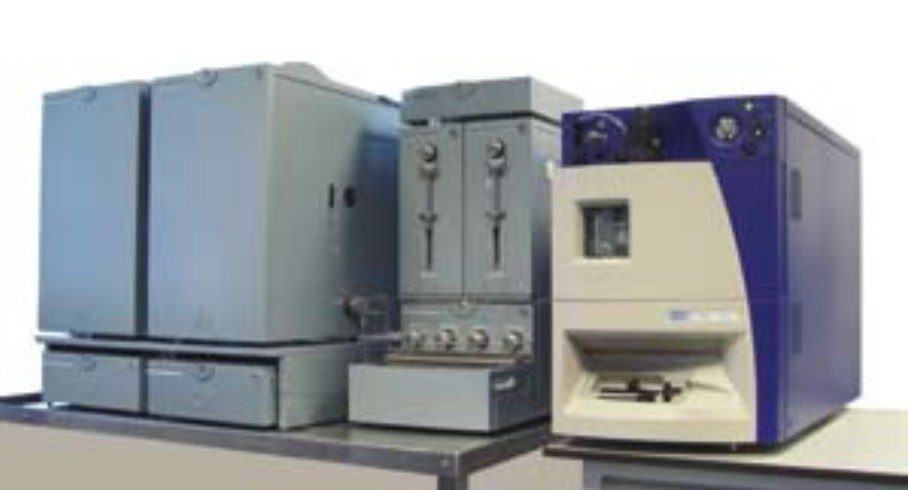
Prepared samples were placed in the Symbiosis sample manager and the following operations were performed automatically: Sample (20 μL) was loaded on to the Oasis HLB SPE cartridge (new cartridge per sample), washed at high and low pH and the analytes eluted from the cartridge using the gradient described below. The same gradient focussed and further purified the analytes on the SunFire analytical HPLC column before detection by MRM tandem mass spectrometry.

XLC Conditions

XLC System:

Spark Holland Symbiosis Pharma

SPE Cartridge:

Waters Oasis HLB 1 x 10 mm, 30 μm

30 μm Conditioning:

Acetonitrile 1 mL

Equilibration:

Water 1 mL

Load:

Water 1 mL

Wash:

Water 2% NH4OH 1 mL

Wash:

5% Acetonitrile 2% Formic Acid 1 mL

Elution mode:

Standard (LC Pump)

Elution time:

3.5 minutes

Injection Volume:

20 μL

LC Conditions

HPLC Column:

Waters Sunfire C18, 2.1 x 50 mm, 3.5 μm

Eluents:

A: 2 mM Ammonium Acetate + 0.1% Formic Acid in water

B: Acetonitrile

Column Temp.:

30 ˚C

Sample Temp.:

4 ˚C

Flow Rate:

0.2 mL/min

Total Run Time:

5.5 minutes

Gradient

Time

%A

%B

0.0

80

20

2.0

55

45

2.5

55

45

3.0

5

95

3.5

5

95

3.6

80

20

MS Conditions

MS System:

Waters Quattro micro

Ion Mode:

Electrospray +ve

Capillary Voltage:

1.00 kV

Source Temp:

120 ˚C

Desolvation Temp:

400 ˚C

Desolvation Gas Flow:

1150 L/hour

Cone Gas Flow:

50 L/hour

Detection Mode:

MRM (see Table)

Dwell Time:

0.20 seconds

Inter-scan Delay:

0.05 seconds

Collision Gas:

Argon (3.30 x 10⁻³ mbar)

Results and Discussion

Linearity

The data were processed using QuanLynx quantification software, using the ApexTrack integration algorithm. The mole ratio parameter in QuanLynx was used to adjust for cross contamination of the native and d2 cortisol. This allowed a linear fit to be applied with a 1/x weighting. The correlation coefficient (R2) for cortisol was 0.9999 (Figure 2) and the calculated concentrations for the calibrators were all within ±4% of the assigned values. The assay was shown to be linear up to 1000 ng/mL (R2 0.9993).

Figure 2: Calibration curve for the analysis of cortisol. X = Calibrator diamond symbol = QC

Accuracy

The calculated concentrations of the % deviations for the six QC samples prepared at Wythenshawe hospital were all acceptable (mean %RSD -4.4%).

Precision

Cortisol determination of 10 replicate injections of a spiked urine sample at a concentration of 17 ng/mL gave a precision of 2.8 % CV.

Limit of Quantification

The limit of quantification (LOQ) was determined to be 0.5 ng/mL with a S/N of 15:1.

Recovery

Using the Automated Method Development (AMD) functionality of the Symbiosis System, an extraction recovery experiment was performed and calculated to be 98.3%.

Carry Over

The carry over was determined by analyzing a high cortisol standard (1000 ng/mL) followed by a water blank. The area for the water blank was divided by the area for the cortisol standard and expressed as a percentage to give a value of 0.03 %.

Patient Analysis

Twenty anonymised patient samples were analysed using the Symbiosis/Quattro micro. One sample was excluded from the method comparison because the measured cortisol concentration was out of the calibration range of the SMUHT method

The calculated cortisol concentrations obtained were in good agreement with the LC-MS/MS measurements, as shown in Figure 3.

Figure 3: Linear regression analysis.

One of the twenty patient samples analyzed showed elevated cortisol levels of clinical significance (Figure 4).

Figure 4: Chromatogram to show the response for cortisol in a patient with elevated cortisol levels (480.5 ng/mL).

Ion Suppression

The ion suppression was assessed by infusing a solution of cortisol (1000 ng/mL) at 10 μL/min post column and monitoring the MRM for cortisol when injecting a water blank and a urine sample. Minimal ion suppression was observed (Figure 5) and the use of a deuterated internal standard will compensate for these minor ion suppression effects.

Figure 5: Retention time of cortisol and the ion suppression chromatograms for the analysis of water and urine.

The dedicated on-line SPE functionality of the Symbiosis Pharma instrument allows for high-throughput analysis. The system has two SPE cartridge clamps enabling parallel SPE and sample analysis. Sample preparation is no longer the rate limiting step in high through put LC-MS/MS assays when using the Symbiosis Pharma system. A five minute method for the analysis of UFC has been developed using the Symbiosis Pharma/Quattro micro System. This method demonstrates excellent linearity (R2 0.9999), sensitivity and precision when injecting only 20 μL of urine.

The method developed was compared with a routine LC-MS/MS method. The calculated cortisol concentrations for twenty patients were in good agreement with the measurements from SMUHT.

Conclusion

The integrated Symbiosis Pharma/Quattro micro system is easy to use with the new MassLynx driver, enabling complete control of the system. A method for the direct analysis of cortisol in urine has been developed with good linearity, sensitivity, and precision.

References

  1. Lee C. Beta Hydroxy Cortisol Interferes with Immunoassay of UFC. Clin Chem 1996;42:1290–1.
  2. Murphy BEP. How much ‘UFC’ is Really Cortisol? Clin Chem 2000;46:793–4.
  3. Taylor RL, Machacek D, Singh RJ. Validation of a High-Throughput Liquid Chromatography–Tandem Mass Spectrometry Method for Urinary Cortisol and Cortisone. Clin Chem 2002;48:1511–1519.

Featured Products

720002126, July 2007

Back To Top Back To Top