• Application Note

The Analysis of Sudan and other Azo Dyes in Spices Using Liquid Chromatography-Tandem Quadrupole Mass Spectrometry

The Analysis of Sudan and other Azo Dyes in Spices Using Liquid Chromatography-Tandem Quadrupole Mass Spectrometry

  • Christelle Robert
  • Marijn Van Hulle
  • Simon Hird
  • Pierre-Yves Brasseur
  • Nathalie Gillard
  • CER Groupe
  • Waters Corporation

Abstract

Azo dyes, including sudan dyes, have been fraudulently and illegally used to enhance the visual surface color of spices and food. Robust monitoring programs based on reliable detection methods are required to assure the food is free from these harmful colors. A method has been developed for the simultaneous determination of 11 azo dyes including 7 Sudan dyes, Rhodamine, Dimethyl Yellow, Para Red, and Orange II, by using an ACQUITY UPLC I-Class coupled to a Xevo TQ-S micro MS/MS System, with a chromatographic run time of 14 min. The method uses simple extraction with a strong organic solvent, stable isotope analogues as internal standards, and does not require any lengthy clean-up steps. Excellent sensitivity was demonstrated from the analysis of matrix-matched standard at the lowest concentration (0.125 mg/kg), which indicates that the method is capable of detection in extracts at much lower concentrations or final extracts could be diluted further prior to LC-MS/MS. The mean recovery ranged from 93.8 to 115.2% and the precision of the method was also satisfactory for all analytes in both within-laboratory repeatability (0.8–7.7%) and within-laboratory reproducibility (1.6–7.7%) studies. The performance of the method has been demonstrated in paprika and is considered suitable for reliable quantitation down to concentrations well below the action limits used to monitor for the potential occurrence of the illegal dyes in food supply in Europe and elsewhere.  

Benefits

  • Broad scope of azo dyes in one analysis to improve laboratory efficiency
  • Sensitive detection and reliable quantitation with the Xevo TQ-S micro
  • Measurements down to concentrations well below limits used to monitor for economically motivated adulteration 

Introduction

Food colors are food additives that are used to make up for color losses following exposure to light, air, moisture, and variations in temperature, to enhance naturally occurring colors and to add color to foods that would otherwise be colorless or colored differently. Sudan dyes are not approved for use as colors in food in many countries including China, Australia, Canada, and Europe. For example, in the European Union, all additives, including colors, must be authorized and listed with conditions of use in the EU's ‘positive’ list contained in Regulation (EC) 1333/2008 and subsequent amendments.1 The presence of industrial dyes in food constitutes an adulteration of food products, since these substances are not authorized as food colors and their intake in food is a perceived risk to health. Azo dyes have been fraudulently and illegally used to enhance the visual surface color of spices and food.2 It has been estimated that the total cost of the recall of contaminated products in the UK in 2005, including loss of sales, destruction of goods, brand image damage, management time, and consultancy fees ran to over €200 million. 

In the last decade, the number of reports of the presence of Sudan dyes has decreased substantially probably due to the increased monitoring of these compounds in spices. Nevertheless, such adulterations remain of concern to the consumer, food industry, and regulatory bodies in various parts of the world. European food manufacturers, distributors, and retailers have a duty to ensure that their products are compliant with EU regulations and demonstrate due diligence in their operations. Robust monitoring programs based on reliable detection methods are required to assure the food is free from harmful colors. Various analytical methods have been reported in the literature for the determination of dyes in food and beverage.3 Methods should cover those dyes frequently detected (e.g. RASFF) and included in any mandatory import testing controls, those dyes considered as a risk to health by EFSA’s Scientific Panel and those based upon industrial intelligence. All these dyes can be analyzed by LC-MS/MS, but not within 1 run, so the very polar dyes tend to be excluded. Dyes have been detected in a wide range of food ingredients and finished products, but typically spices (e.g. dried chili, chili products, and curry powder) and palm oil are the highest priority and were subject to increased level of official controls. As these compounds are banned, they have no maximum permitted limits. For practical purposes there tends to be a concentration below which no action is taken if adulterated is detected; e.g. from accidental contamination. The Standing Committee on the Food Chain and Animal Health, SCoFCAH, at a meeting held in Brussels on 23 June 2006, decided that in order to adopt a consistent approach to enforcement across Europe, applied an action limit of 0.5 mg/kg to illegal dyes in food ingredients such as spices and palm oil.4 Subsequently, this was implemented by competent authorities in the various Members States, including the FASFC (Federal Agency for the Safety of the Food Chain) in Belgium. 

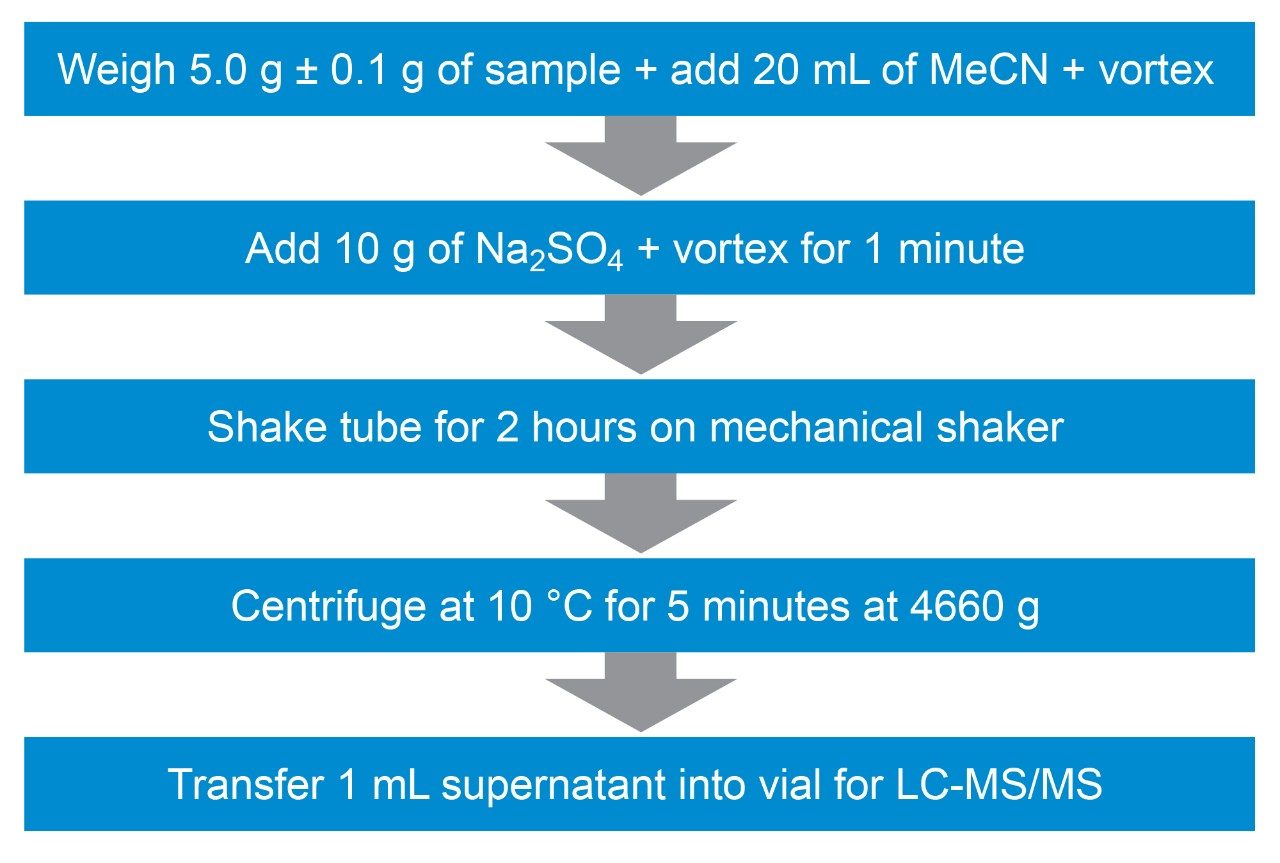
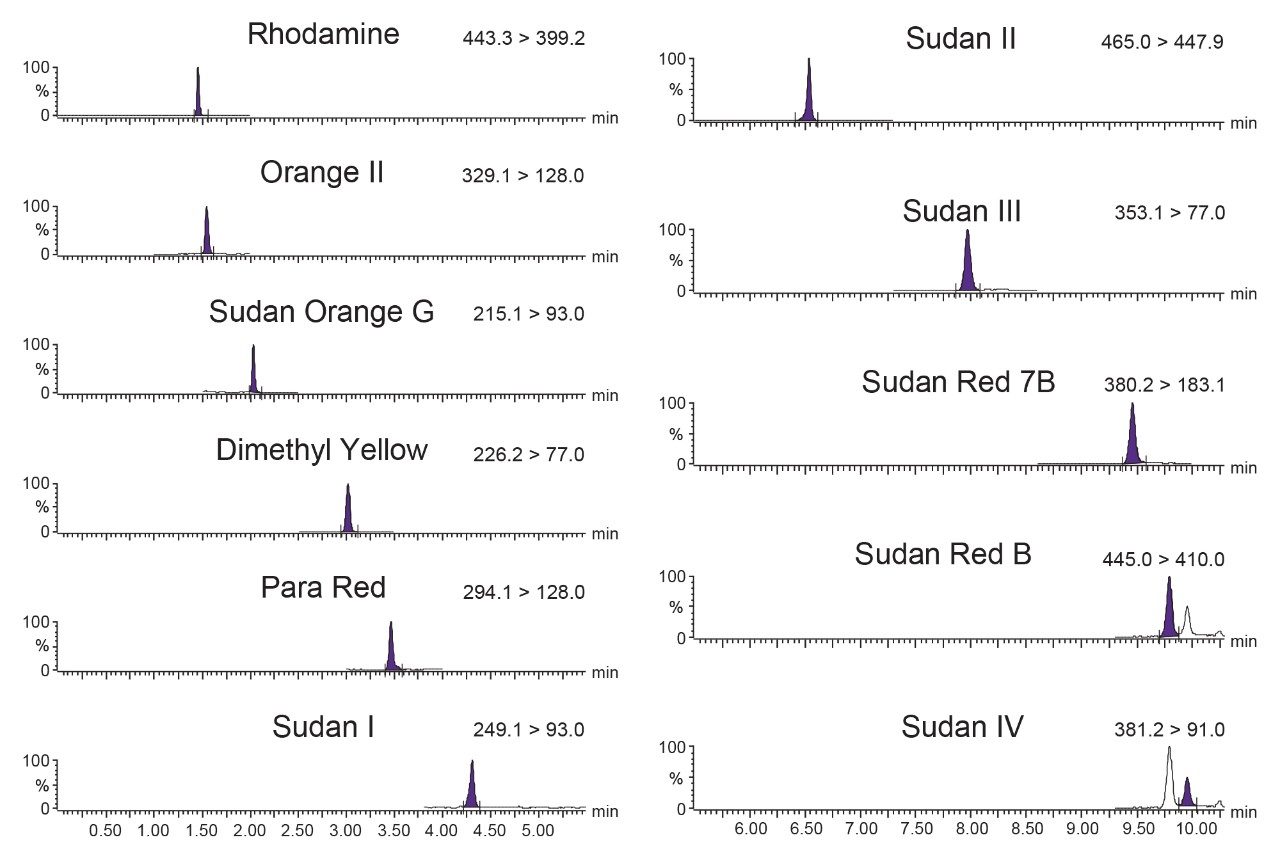
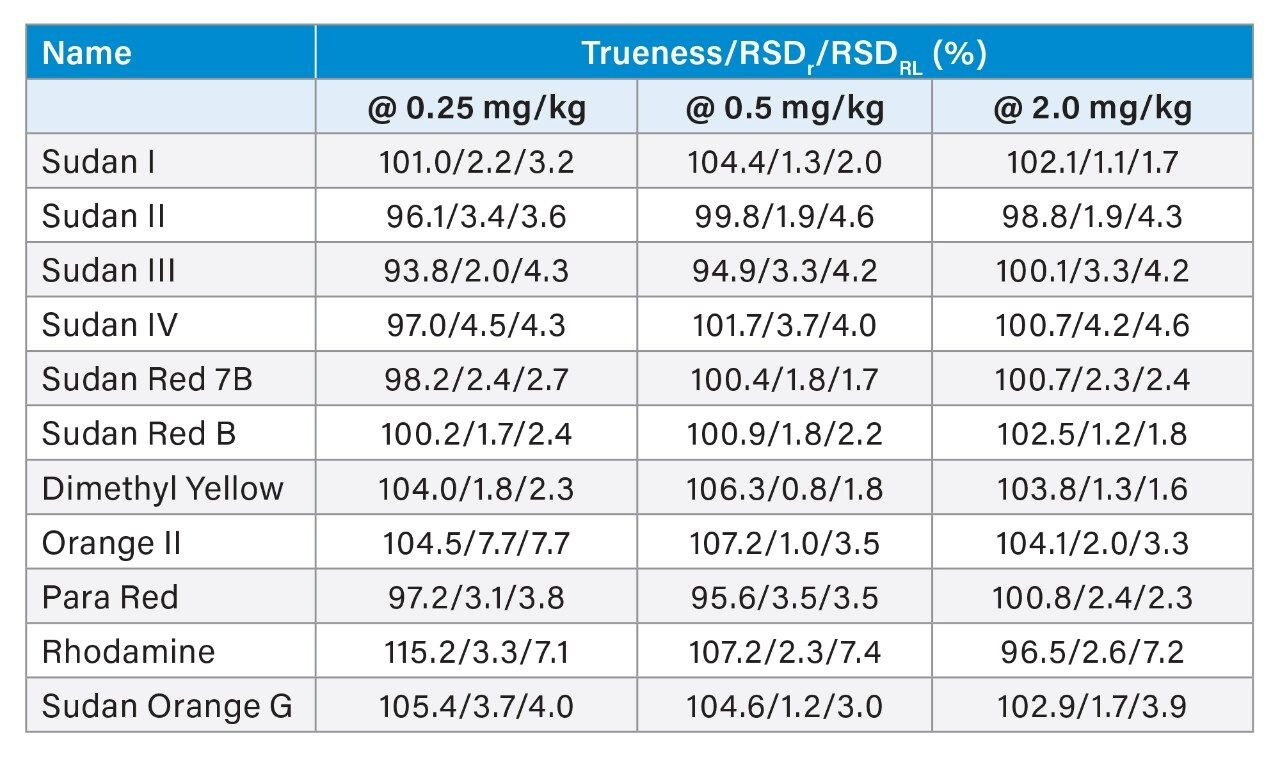
The combination of liquid chromatography with tandem mass spectrometry (LC-MS/MS) offers high sensitivity with outstanding selectivity and so has been extensively used in trace analysis of food.  Here we demonstrate the application of a simple approach for the determination of illegal dyes in paprika using UPLC-MS/MS after extraction of 11 dyes with a strong organic solvent, using stable isotope analogues as internal standards, without any lengthy clean-up steps. 

Experimental

Sample Extraction

Paprika was extracted, after the addition of internal standards, Sudan I-d5, and Sudan IV-d6, by shaking with acetonitrile (Figure 1). Matrix-matched standards were prepared in the paprika extract, previously shown to be blank, at the following concentrations: 0.125 mg/kg, 0.25 mg/kg, 0.5 mg/kg, 1.0 mg/kg, 2.0 mg/kg, and 3.0 mg/kg. 

Figure 1. Overview of sample preparation steps. 

UPLC Parameters

System:

ACQUITY UPLC I-Class with FTN Sample Manager

Column:

ACQUITY UPLC BEH C18, 2.1 x 100 mm, 1.7 µm (PN 186002352)

Column temp.:

40 °C

Sample temp.:

20 °C

Injection parameters:

2.5 µL

Mobile phases:

(A) 0.1% Formic acid + 5 mM HCOONH4 in water

(B) 0.1% Formic acid in methanol

Sample manager wash:

25/25/25/25 water/methanol/isopropanol/acetonitrile with 0.2% formic acid

Gradient

MS Parameters

MS system:

Xevo TQ-S micro

Polarity:

ES+

Capillary voltage (kV):

1.0

Source temperature (°C):

150 °C

Desolvation temperature (°C):

650 °C

Desolvation gas flow (L/Hr):

1100 L/hr

Cone gas flow (L/Hr):

50 L/Hr

Two MRM transitions per compound were used. The dwell times were set automatically using the autodwell function to give a minimum of 12 data points across each peak. The data were acquired using MassLynx software and processed using TargetLynx XS Application Manager. Table 1 summarizes the MRM transitions and the actual dwell time settings. The quantification traces are noted in bold. 

Table 1. MS Method parameters for all the dyes and their internal standards. 

Method Validation

Validation was performed using spiked blank samples based upon the 2002/657/EC guidelines5 as, in contrast to SANTE/12682/2019,6 these included measurements across multiple days. The following parameters were assessed: identification, selectivity, linearity, trueness, within-laboratory repeatability (RSDr), and within-laboratory reproducibility (RSDRL). The selectivity of the method was investigated through injecting standard solutions of all analytes and internal standards individually and through testing paprika, to check the presence of any interferences eluting at and around the retention times of the analytes. The linearity of the curves and individual residuals were checked. The trueness, RSDr, and RSDRL were derived from data from the replicate spiked samples, performed on three separate days by the same analyst. As these compounds have no maximum permitted limits in Europe, an assessment was made at 0.5, 1, and 4 times the action limit of 0.5 mg/kg. Identification was assessed by examining retention times and ion ratios.  

Results and Discussion

Chromatography

The ACQUITY UPLC BEH C18 Column provides excellent retention and peak shape for all the analytes with a baseline separation of the isobaric compounds Sudan Red B at retention time 9.82 minute and Sudan IV at a retention time of 9.98 minutes (Figure 2). The gradient starts off at 25% of organic solvent B in order to focus the relatively polar compounds Rhodamine, Orange II, Sudan Orange G, Dimethyl Yellow, and Para Red onto the column before the gradient is ramped up to 70% B and subsequently increased to 95% of B via a shallow gradient to elute off the other colorants. The total run time is 14 minutes. 

Figure 2. Chromatogram of a matrix-matched standard at 0.125 mg/kg showing all compounds. 

Sensitivity

Excellent sensitivity was demonstrated from the analysis of matrix-matched standards. Figure 2 shows typical chromatograms for the colorants from the analysis of the matrix-matched standard at the lowest concentration (0.125 mg/kg), which indicates that the method is capable of detection in extracts at much lower concentrations or final extracts could be diluted further prior to LC-MS/MS. 

Specificity, Selectivity, and Linearity

Seven samples were prepared on each of the 3 days and analysed subsequently. No signal was detected in the extracts that could lead to detection of false reporting of non-compliant samples. Rhodamine was detected at trace levels (<0.5% of the lowest calibrator) in the paprika. A 6-point calibration curve was prepared in matrix extract and acquired on each day. Linear fit with 1/x weighing was applied for all compounds except for Rhodamine for which a quadratic fit with 1/x weighing was applied. All values for correlation of determination (R2) from the matrix validation curves were >0.996, with individual residuals <20% (most <10%), demonstrating reliable quantification of all the dyes. Some examples of typical calibration curves are given in Figure 3. 

Figure 3. Typical residuals and calibration curves for a selection of the compounds included in this method. 

Trueness, Repeatability, and Reproducibility

The trueness, expressed by measured recovery, was evaluated using the data from the analysis of the spiked paprika test portions over the three days. The mean recoveries for each set of seven spikes, at the three concentrations, prepared and analyzed over 3 days, were within the range 93.8 to 115.2% and hence met the criteria set out in the 2002/657/EC document. The precision of the method was also satisfactory for all analytes in both RSDr (0.8–7.7%) and RSDRL (1.6–7.7%) studies. Trueness and precision are shown in Figures 4, 5, and Table 2. 

Figure 4. Plot of the recoveries (%) from the analysis of spikes from Days 1, 2, and 3. 
Figure 5. Plot of the repeatability (% RSDr) and within-lab reproducibility (RSDRL) from the analysis of spikes from Days 1, 2, and 3. 
Table 2. Validation results for the determination of azo dyes in paprika. 

Conclusion

This application note describes a simple method for the simultaneous determination of a series of different azo dyes including 7 Sudan dyes, Rhodamine, Dimethyl Yellow, Para Red, and Orange II, by using an ACQUITY UPLC I-Class coupled to a Xevo TQ-S micro MS/MS System.  The performance of the method has been demonstrated in paprika and is considered suitable for reliable quantitation down to concentrations well below the action limits used to monitor for the potential occurrence of the illegal dyes in food supply. 

References

  1. Regulation (EC) 1333/2008 of the European Parliament and of the Council of 16 December 2008 on food additives. OJ L 354, 31.12.2008, p.16–33.
  2. Galvin-King, P et al. (2018). Herb and spice fraud; the drivers, challenges and detection. Food Control, 88:85–97.
  3. Oplatowska-Stachowiak M and Elliott C (2017) Food colors: Existing and emerging food safety concerns, Critical Reviews in Food Science and Nutrition 57(3):524–548.
  4. Summary Record SANCO – D.1(06)D/411990 of the Standing Committee on the Food Chain and Animal Health https://ec.europa.eu/food/sites/food/files/safety/docs/reg-com_toxic_summary21_en.pdf.
  5. 2002/657/EC: Commission Decision of 12 August 2002 Implementing Council Directive 96/23/EC Concerning the Performance of Analytical Methods and the Interpretation of Results. OJ L 221, 17.8.2002, p. 8–36. 
  6. Document No. SANTE/12682/2019. Guidance Document on Analytical Quality, Control, and Method Validation Procedures for Pesticides Residues Analysis in Food and Feed. 

720007138, January 2021

Back To Top Back To Top