Raw Material Testing: Developing Methods for Quality Control of Phosphoramidites used in the Chemical Synthesis of Oligonucleotides
Abstract
Highly pure phosphoramidites are important for ensuring process robustness in the chemical synthesis of oligonucleotides. Although impurity classes are well understood and generally well controlled, there remains a level of risk associated with the presence of any impurities, even at trace levels. Because phosphoramidites are coupled to one another to form a growing oligonucleotide chain, impurities unique to each phosphoramidite are propagated throughout the synthesis each time that specific phosphoramidite is incorporated. This work highlights a single liquid chromatography-ultra violet-mass spectrometry (LC-UV-MS) method that can be used to assess identification and overall product purity of phosphoramidites within a compliance-ready workflow.
Benefits
- Method development for quality control testing of phosphoramidites using Empower™ 3 CDS for compliance-ready analysis
- Demonstrated mass confirmation of phosphoramidites using the ACQUITY™ QDa™ Detector for identification testing
- Evaluation of phosphoramidite oxidation and the impact on analytical LC methods
Introduction
Nucleic acid therapeutics continue to garner interest across a global landscape as an increasing number of products have received approval in US and EU markets.1 The chemical synthesis of oligonucleotides has evolved to become fairly routine and can be carried out quickly and efficiently using automated synthesizers. The predominant synthesis scheme uses phosphoramidite monomers as building blocks that are added to one another sequentially to form a growing oligonucleotide chain through a repetitive four-step process of de-blocking, coupling, capping, and oxidation. The structure of a single phosphoramidite contains a nucleotide modified with various protecting groups that aid in synthesis efficiency. Additional modifications to the base or sugar can also be included for increasing stability and nuclease resistance of the final product. Because any impurities associated with the phosphoramidites can be propagated throughout the synthesis, quality control of these materials is of critical importance.
Oligonucleotides are often considered more similar to small molecules than biologics due to the nature of their chemical synthesis. However, regulatory expectations are less defined due to inherent differences in the manufacturing process between the two. Although oligonucleotides are outside the scope of ICH guidance, some of the principles can still be applied. ICH Q11, which contains recommendations for the development and manufacture of drug substances, can be applied to phosphoramidite starting materials where impurity classes are well understood and well controlled.2,3 This is in contrast to ICH Q3 (Impurities), where it is generally accepted that impurity thresholds are higher for oligonucleotides than for small molecules.2,3
Owing to the lack of clarity around regulatory requirements, the objective of this work is to evaluate LC-UV-MS methods for phosphoramidite raw material testing using an ICH framework to design and outline methods with the understanding that in reality, specification is defined on a case-by-case basis. Although additional analytical techniques are used in defining specification, LC test methods are commonly used to assess purity and confirm identity. Table 1 shows an example specification for LC test methods adapted from Kiesman et al. which will guide the acceptance criteria used in our proof-of-concept study.2 First, the ACQUITY QDa Detector is evaluated for identity testing of phosphoramidites. After confirming that the ACQUITY QDa Detector offers mass confirmation within one atomic mass unit (amu) as proposed by the acceptance criteria for the three phosphoramidites tested, this same analytical method can then be extended to address overall product purity using a traditional approach that compares a sample to reference material.
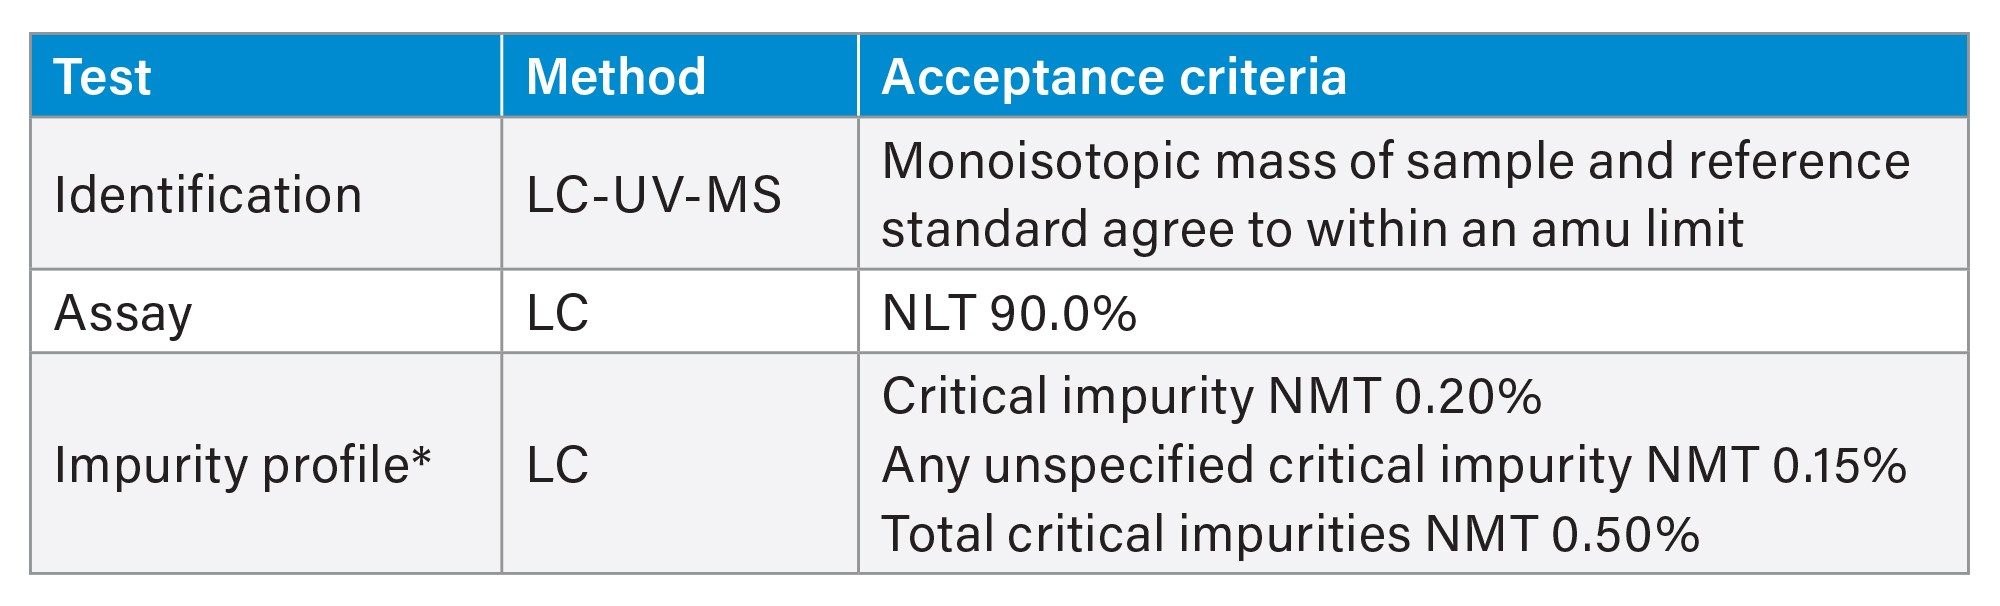
Table 1. LC test methods and specification of phosphoramidites adapted from Kiesman et al.2
* This work does not address impurity profiling, but LC test methods could be extended to include a purity assessment through HRMS characterization of impurities.
Experimental
Method development and data collection was performed by Waters scientists with the guidance of Janssen. The LC specification described in this work was adapted from Kiesman et al. and does not reflect the criteria used in Janssen methods.
Sample Description
Stock phosphoramidite solutions were prepared at 1 mg/mL in 0.01% (v/v) triethylamine (TEA) in anhydrous acetonitrile for DNA synthesis (less than 10 ppm water) and further diluted to working concentrations of 0.1 mg/mL, 0.01 mg/mL, and 0.001 mg/mL in the same diluent. The standard concentration used in experiments was 0.1 mg/mL unless otherwise indicated. Phosphoramidites were stored as a powder at -20 °C and were prepared fresh prior to use.
LC Conditions
|
LC system: |
ACQUITY UPLC H-Class PLUS Bio Binary System |
|
Detection: |
ACQUITY UPLC™ TUV Detector with analytical flow cell, 237 nm |
|
Column: |
ACQUITY UPLC BEH™ C18 Column, 130 Å, 1.7 µm, 2.1 x 150 mm (p/n: 186002353) |
|
Column temp.: |
24 °C |
|
Sample temp.: |
10 °C |
|
Injection volume: |
3.3 µL |
|
Mobile phase A: |
10 mM NH4HCO3 in water, pH 9.0 (pH adjusted with NH4OH, 20–22%) |
|
Mobile phase B: |
Acetonitrile |
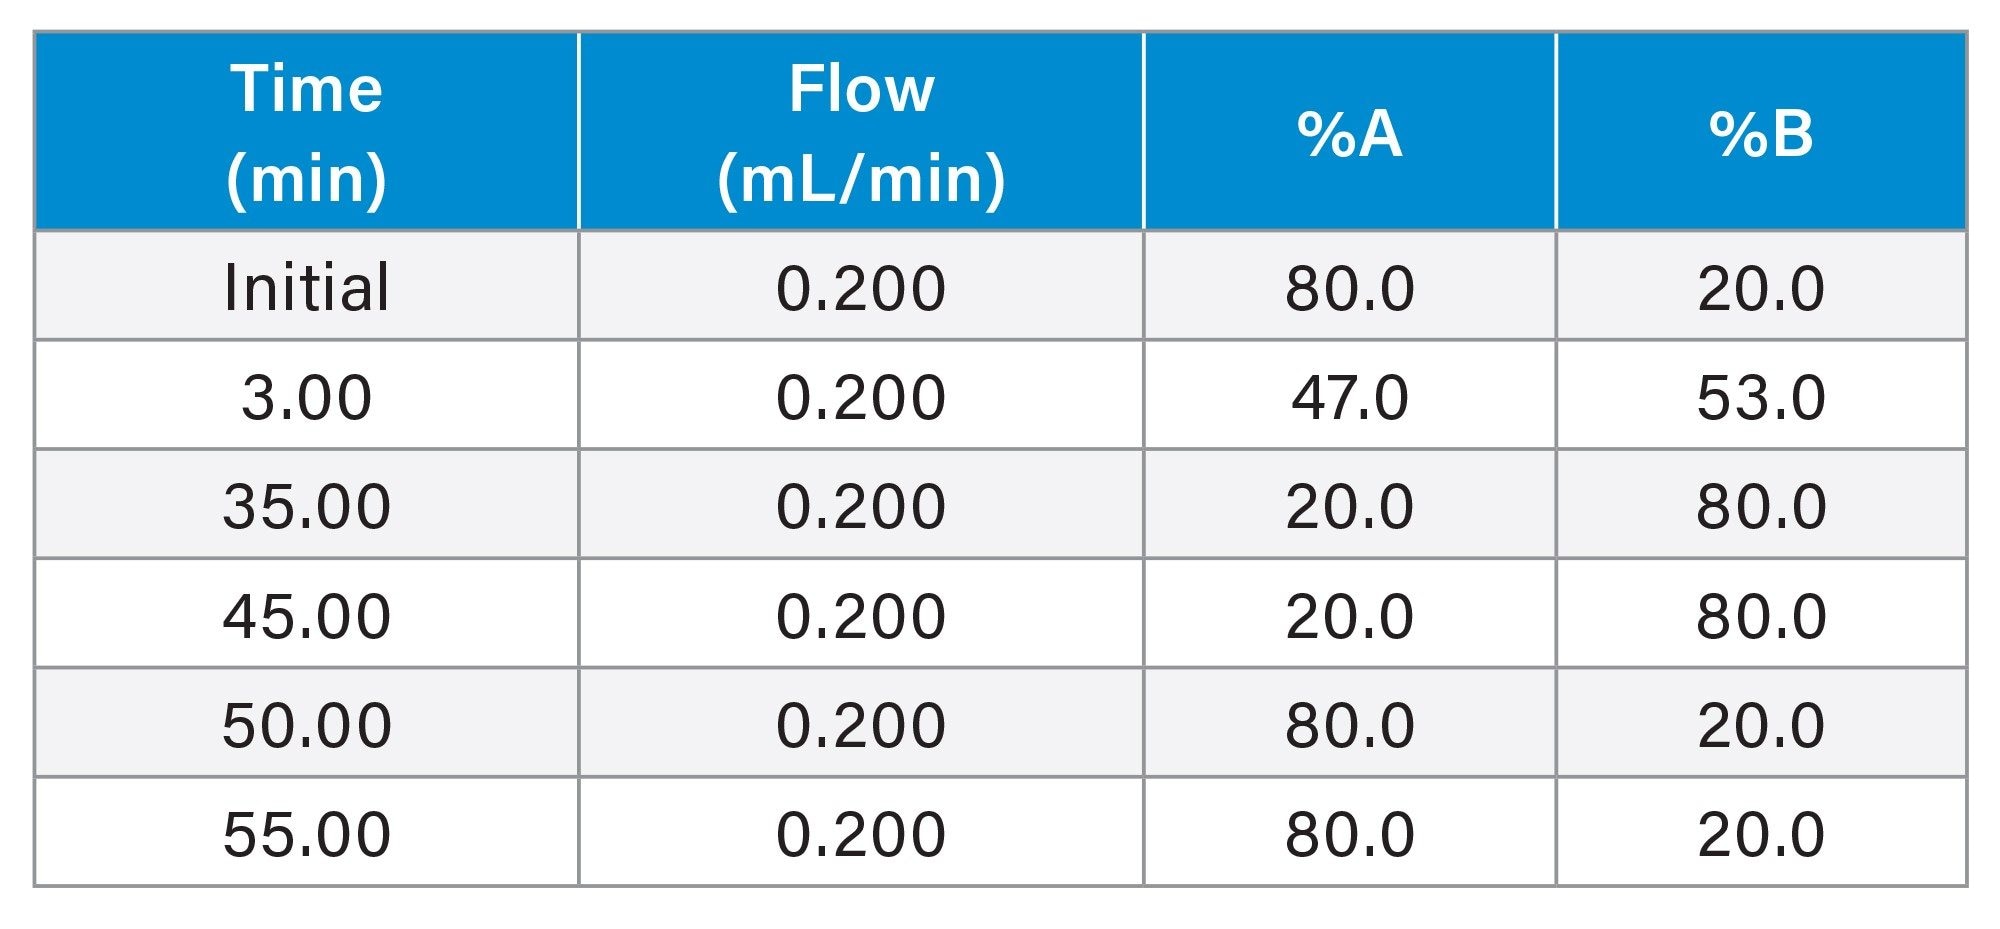
Gradient
MS Conditions
|
MS system: |
ACQUITY QDa Detector |
|
Ionization mode: |
ESI+ |
|
Acquisition range: |
150–1250 m/z |
|
Capillary voltage: |
0.8 kV |
|
Cone voltage: |
10 V |
|
Probe temp.: |
300 °C |
Data Management
Empower 3 Chromatography Data Software FR4
Results and Discussion
Phosphoramidite Identification Testing with the ACQUITY QDa Detector
Identification testing of phosphoramidite raw materials is traditionally carried out using LC-UV-MS. Although acceptance criteria can vary, the expectation is that the sample will be within an amu reporting limit of the reference material. To assess whether the ACQUITY QDa Detector is suitable for identification testing, three different phosphoramidites were evaluated: DMT-dG(ib) Phosphoramidite (dG), DMT-dA(bz) Phosphoramidite (dA), and DMT-2’-Fluoro-dA(bz) Phosphoramidite (2’F-dA). The phosphoramidite structure and corresponding mass information is reported in Figure 1. Because the ACQUITY QDa Detector is a single quadrupole detector where the base peak corresponds to the [M+H]+ monoisotopic ion for most small molecules, monoisotopic mass is reported as calculated by MassLynx™ MS Software.
![Phosphoramidite structure and monoisotopic mass as calculated by MassLynx MS Software. Structural differences among analytes include variable base protecting groups (a benzoyl group on deoxyadenosine and an isobutyryl group on deoxyguanosine) and a modification to the 2’-ribose to incorporate a fluorine atom. Insets show data from the ACQUITY QDa Detector for the isotope patterns of each amidite where the reported mass is for the [M+H]+ monoisotopic ion](/content/dam/waters/en/app-notes/2022/720007597/720007597en-f1.jpg.82.resize/img.jpg)
Phosphoramidites were dissolved in 0.01% (v/v) triethylamine in anhydrous acetonitrile and separated using an ACQUITY UPLC BEH C18 Column (130 Å, 1.7 µm, 2.1 x 150 mm) and a gradient composed of ammonium bicarbonate and acetonitrile. Controlling column temperature and mobile phase pH are two critical parameters for ensuring phosphoramidite stability and method robustness. A generic 55-minute LC method was employed for each of the phosphoramidites used in this study, but it should be noted that further method optimization may be required for impurity profiling of each unique phosphoramidite, as it can be difficult to separate co-eluting impurities from the phosphoramidite product peaks. From Figure 2, the resulting optical trace of each phosphoramidite shows two product peaks which are the result of two diastereomers at the phosphorous atom. The corresponding TIC shows a similar pattern, but because the diastereomers ionize similarly, small differences in peak intensity are observed between the TUV and TIC data. The insets of the raw data show the isotopic patterns of each phosphoramidite where the base peak corresponds to [M+H]+. Comparison of the experimental data to the calculated reference masses show good agreement and readily meet the specification guidelines of an amu as adapted from Kiesman et al. (Table 2).2
![LC-UV-QDa results for dG, dA, and 2’F-dA phosphoramidites prepared at 0.1 mg/mL. Chromatograms and TICs show good agreement where the two product peaks arise from a chiral center at the phosphorous atom. Arrows in the TUV trace indicate oxidation of P(III) to P(V), which are more clearly seen in the TIC. Insets show isotope patterns for each amidite where the reported mass is for the [M+H]+ monoisotopic ion. Insets are the average of 18 scans of dG 1, dA 1, and 2’F-dA 1, respectively, where dG 2, dA 2, and 2’F-dA 2 yield similar results](/content/dam/waters/en/app-notes/2022/720007597/720007597en-f2.jpg.82.resize/img.jpg)
![Identification testing of phosphoramidite raw materials adapted from Kiesman et al.2 Note that raw data generated by the QDa Detector corresponds to the [M+H]+ monoisotopic ion. Table values have been adjusted to report the mass of the neutral phosphoramidites](/content/dam/waters/en/app-notes/2022/720007597/720007597en-t2.jpg.82.resize/img.jpg)
Observing Phosphoramidite Oxidation Over an Injection Series and at Various Concentrations
Phosphoramidites are known to be susceptible to oxidation from P(III) to P(V), which similarly to the main product peaks, appears chromatographically as a doublet due to diastereomers. The oxidized phosphoramidite peaks are labelled with arrows in the chromatograms in Figure 2 and are even more distinct in the corresponding TICs. Because phosphoramidites are prone to oxidation, they are generally stored in an inert atmosphere and prepared in anhydrous acetonitrile to minimize exposure to water. When evaluating product purity, it is desirable to minimize these types of impurities because they lead to incorrectly assessing overall product purity. To study the increase in oxidation that is characteristically observed over time in LC analysis, an injection series was used to monitor oxidation over approximately 40 hours (40 injections). Injections of dA were made out of the same sample vial where Injection 1 was shown to have 1.14% total oxidation compared to Injection 40 which had 5.48% total oxidation (Figure 3). While the oxidation peaks can be observed and quantitated in the optical trace, The ACQUITY QDa Detector can also be incorporated to provide complementary data for monitoring oxidation. From the insets of Figure 3, the combined spectra of dA and the corresponding oxidation peak (Ox) confirm that the mass of the oxidation peaks are equal to 874.39 Da, or dA + 16.
![Monitoring dA oxidation over 40 hours (40 injections). Injections made out of the same vial show an increase in total oxidation of greater than 4% over the injection series (Injection 1: 1.14%, Injection 40: 5.48%). By preparing a fresh dilution, oxidation is reduced to 0.93% which is in line with the initial oxidation level. Insets show isotope patterns for dA 1 and Ox 1 where the reported mass is for the [M+H]+ monoisotopic ion. Insets are the average of 18 scans of dA 1 and Ox 1, respectively, where dA 2 and Ox 2 yield similar results](/content/dam/waters/en/app-notes/2022/720007597/720007597en-f3.jpg.82.resize/img.jpg)
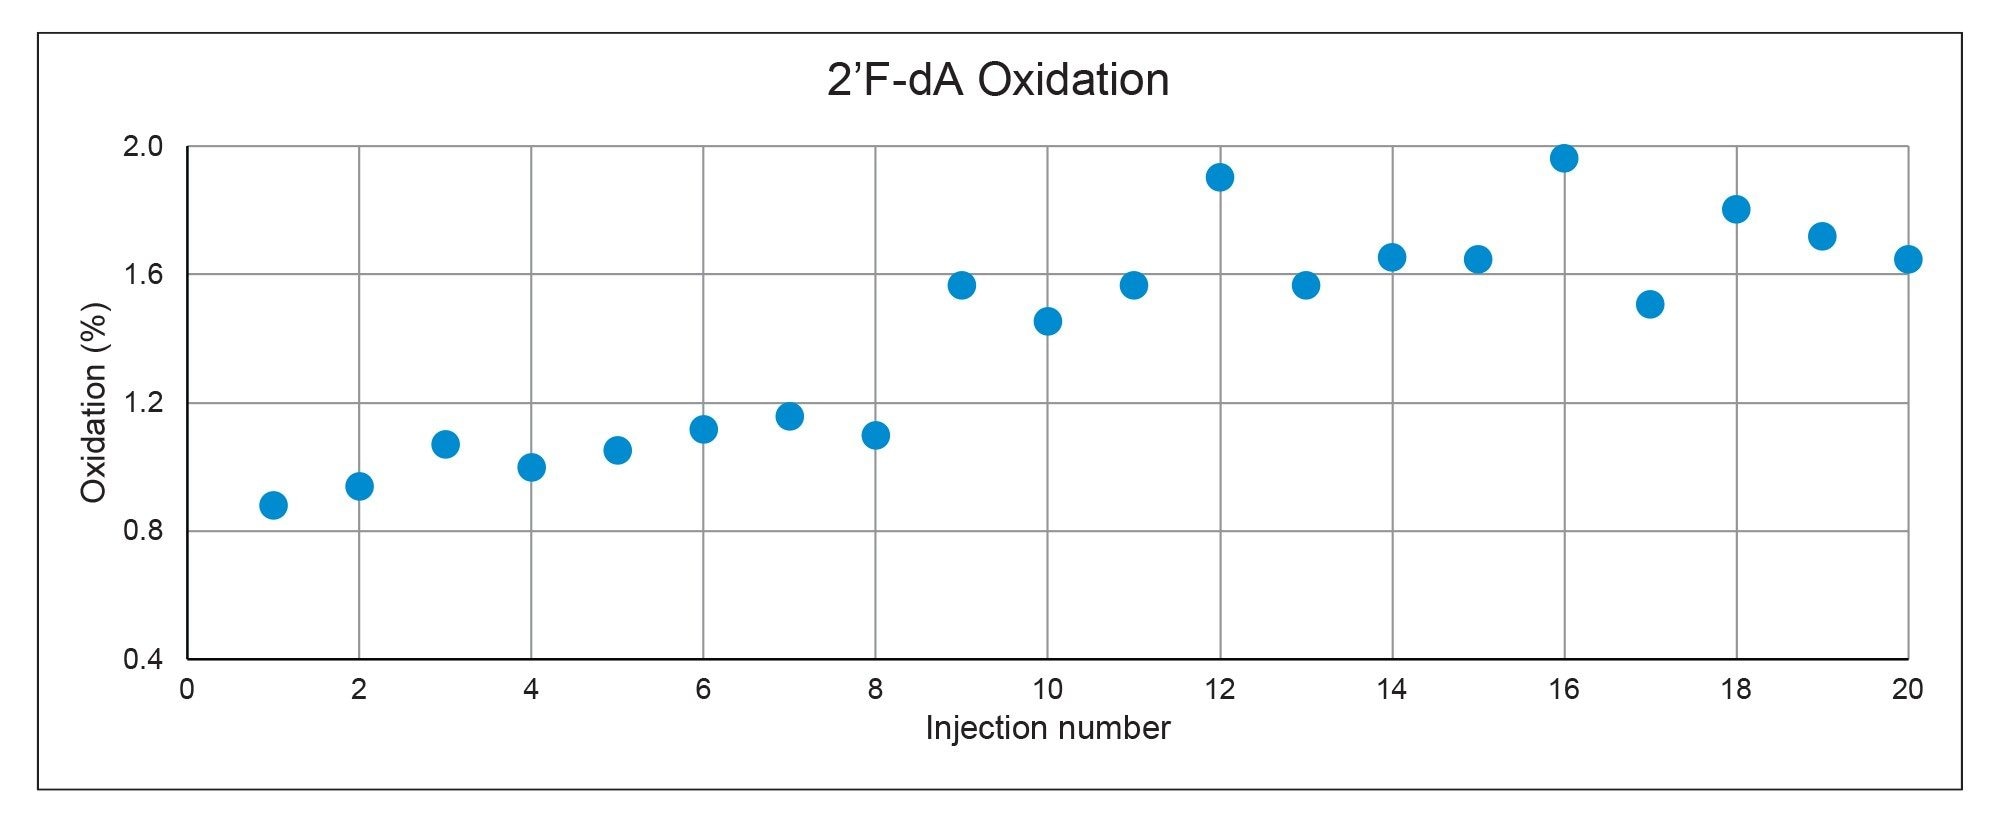
Even when injections are made from separate vials, oxidation is still expected to occur due to water content introduced into the sample vial through sample preparation, which is why high-quality anhydrous acetonitrile is critical. Injections of the 2’F-dA phosphoramidite, which is thought to be more susceptible to oxidation than dA, were carried out over 20 hours to monitor the increase in oxidation over this time period. Figure 4 plots the total percent oxidation associated with each injection, where an approximately 1% increase in oxidation was observed over the injection series. While this work does not investigate additional sources contributing to oxidation, there is data to suggest that incorporating reducing agents into the sample or mobile phase or conducting LC system passivation steps may help to mitigate this phenomenon.
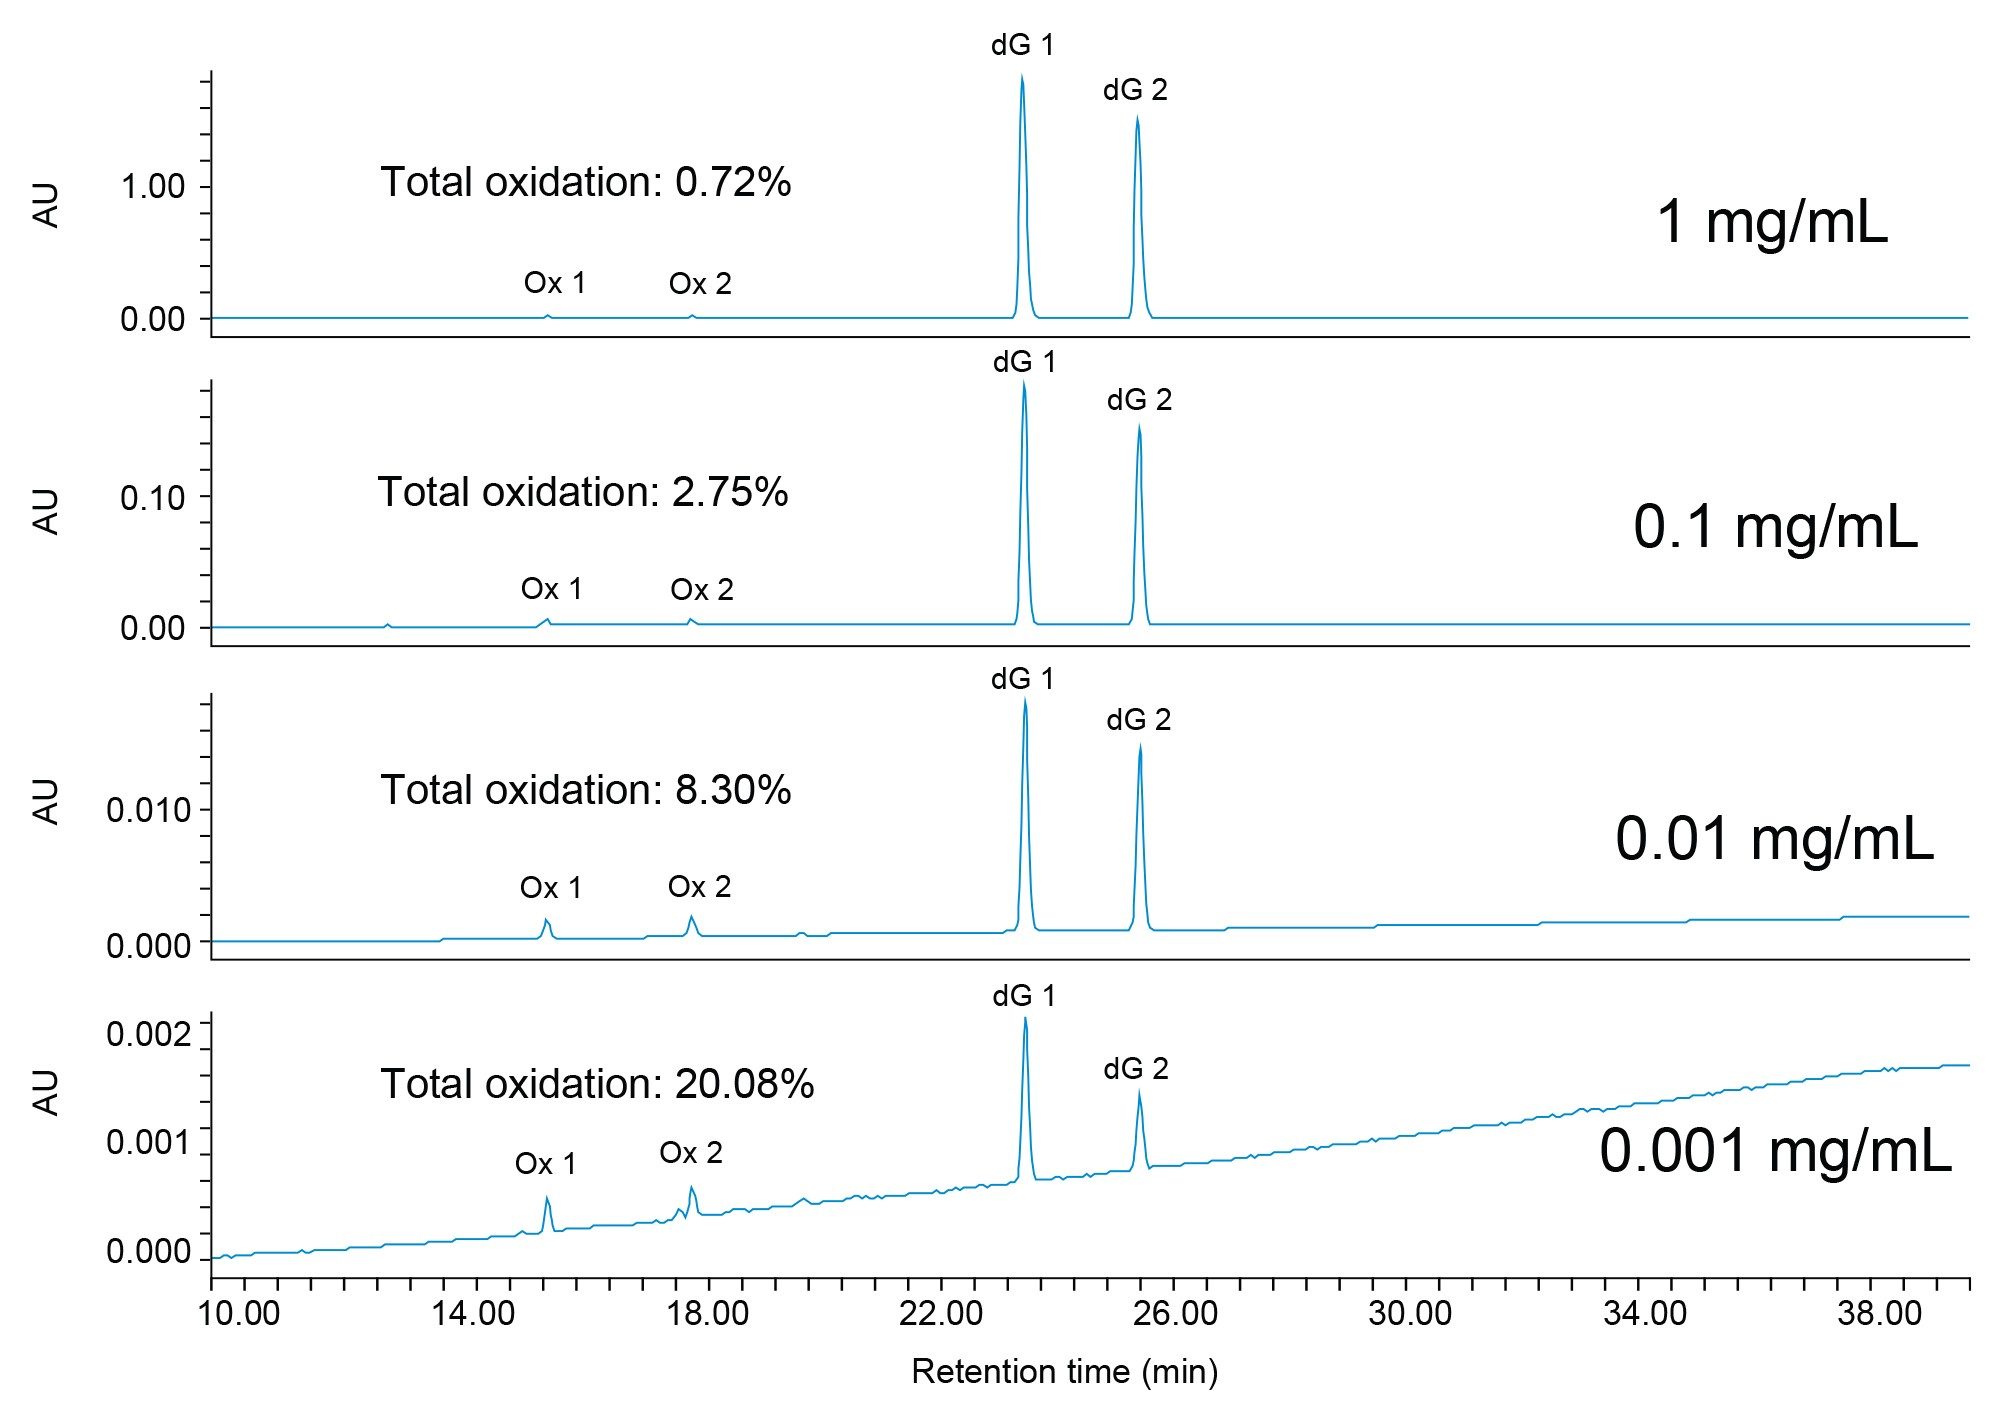
Oxidation also exhibits a concentration dependency, where an increase in oxidation can be observed for phosphoramidites prepared at lower concentrations. In Figure 5, total oxidation is reported for dG at 0.001, 0.01, 0.1, and 1 mg/mL. In addition to water content, the nucleoside identity also contributes to the rate of degradation, with dG being more susceptible.4 At the lowest concentration evaluated, 0.001 mg/mL, total oxidation was approximately 20%. All samples were prepared the same day using the same reagents so that any variables contributing to oxidation were maintained across preparations. If we make the assumption that the water content is comparable in all sample preparations, we can then infer that lower sample concentrations will be more heavily oxidized. This demonstrates that samples prepared at higher concentrations are less compromised by degradation artifacts induced through sample preparation. Preparing samples up to 1 mg/mL may prove beneficial for impurity profiling but there must be balance between minimizing degradation and the potential for detector saturation at higher concentrations.
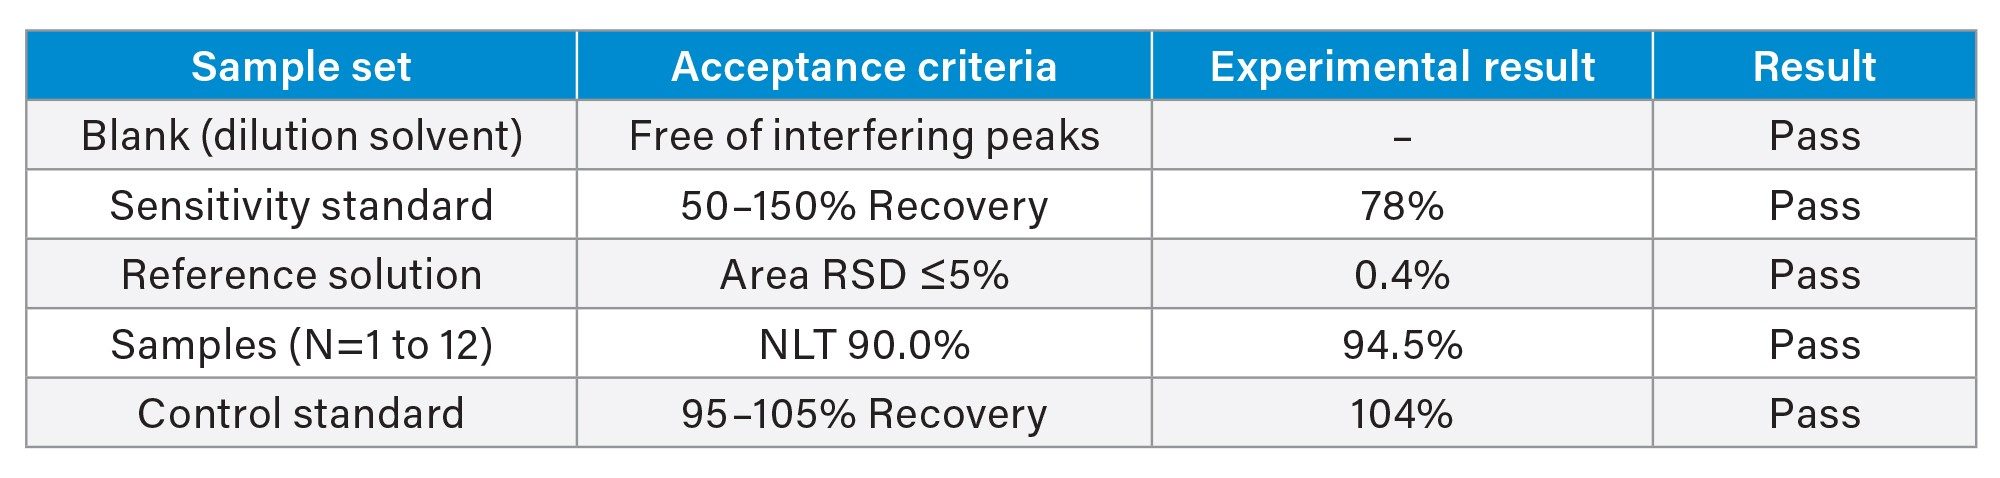
Setting Assay Criteria for Quality Control Testing
Knowledge of phosphoramidite oxidation and degradation and how to best minimize this phenomenon is a further consideration in establishing assay acceptance criteria. Because phosphoramidites prepared at low concentrations can be heavily oxidized, a sensitivity standard is used to assess recovery at the reporting threshold. To begin, a dilution solution of anhydrous acetonitrile was prepared with 0.01% (v/v) TEA. This dilution solution was used to prepare a reference solution at 1 mg/mL (100% level). The reference solution was further diluted to prepare a 1000x dilution to be used as the sensitivity standard, which is assessed at a 0.05% limit of quantitation. A sample set was then generated to include: a blank, the sensitivity standard, the reference solution, samples, and a control standard. To assess area precision, each injection of the reference solution was made out of a separate vial. The 1 mg/mL reference solution was also used for the control standard at the end of the sample set, and again, was injected out of a separate vial.
Table 3 reports acceptance criteria adapted from Kiesman et al. and the results generated for 2’F-dA.2 To summarize, the peak area repeatability of the reference standard showed a 0.4 %RSD with the control standard within 104% of the average response of the reference solution. Through calculating the limit of quantitation at 0.05% of the reference solution response, the sensitivity standard showed 78% recovery, which easily meets the acceptance criteria of 50–150%. A sample was prepared at 0.1 mg/mL and had a reported peak area of 94%, which also meets specification. While this work addresses overall product purity, it could also be extended to impurity profiling although further characterization of the impurities would be needed.
Conclusion
Stringent quality control of phosphoramidite starting materials is important for achieving a high-quality final oligonucleotide product. In this work, a single reversed-phase liquid chromatography method is used for assay and identification testing of three different phosphoramidites. The analytical methods used to assess purity are made more difficult by the instability of the phosphoramidites, which are susceptible to oxidation and additional degradation products when exposed to water, which can lead to incorrectly assessing overall product purity. Preparing samples at higher concentrations (approximately 0.1–1.0 mg/mL) as well as performing injections out of separate vials were found to reduce the oxidation that is commonly introduced through sample preparation. In building assay acceptance criteria, a sensitivity standard ensures method robustness by accounting for increased oxidation at lower concentrations. Future work could investigate the sources contributing to oxidation as well as additional mitigation steps.
References
- Kulkarni, J. A., Witzigmann, D., Thomson, S. B., Chen, S., Leavitt, B. R., Cullis, P. R., van der Meel, R. (2021). The Current Landscape of Nucleic Acid Therapeutics. Nature Nanotechnology, 16, 630–643.
- Kiesman, W. F., McPherson, A. K., Diorazio, L. J., Van den Bergh, L., Smith, P. D., Northall, J. M., Fettes, A., Wang, T., Mehlmann, M., Raza, S., Held, G. (2021). Perspectives on the Designation of Oligonucleotide Starting Materials. Nucleic Acid Therapeutics, 31, 93–113.
- The International Council for Harmonisation of Technical Requirements for Pharmaceuticals for Human Use (ICH), available: https://www.ich.org/page/quality-guidelines.
- Hargreaves, J. S., Kaiser, R., Wolber, P. K. (2015). The Degradation of dG Phosphoramidites in Solution. Nucleosides, Nucleotides and Nucleic Acids, 34, 691–707.
Acknowledgements
Katrien Donckers, Willy Verluyten, Irene Suarez Marina, Jean-Paul Boon and Mario Hellings are employees of Janssen Pharmaceutical Companies of Johnson & Johnson.
720007597, April 2022